
Recommendation Strategy Stats
Learn how to monitor the performance and usage of your recommendation strategy across engagements, messages, and channels.
Overview
The Stats page provides a comprehensive view of how your recommendation strategy is performing across channels, items, and user engagement. Use it to evaluate effectiveness, identify top-performing recommendations, and optimize delivery strategies.
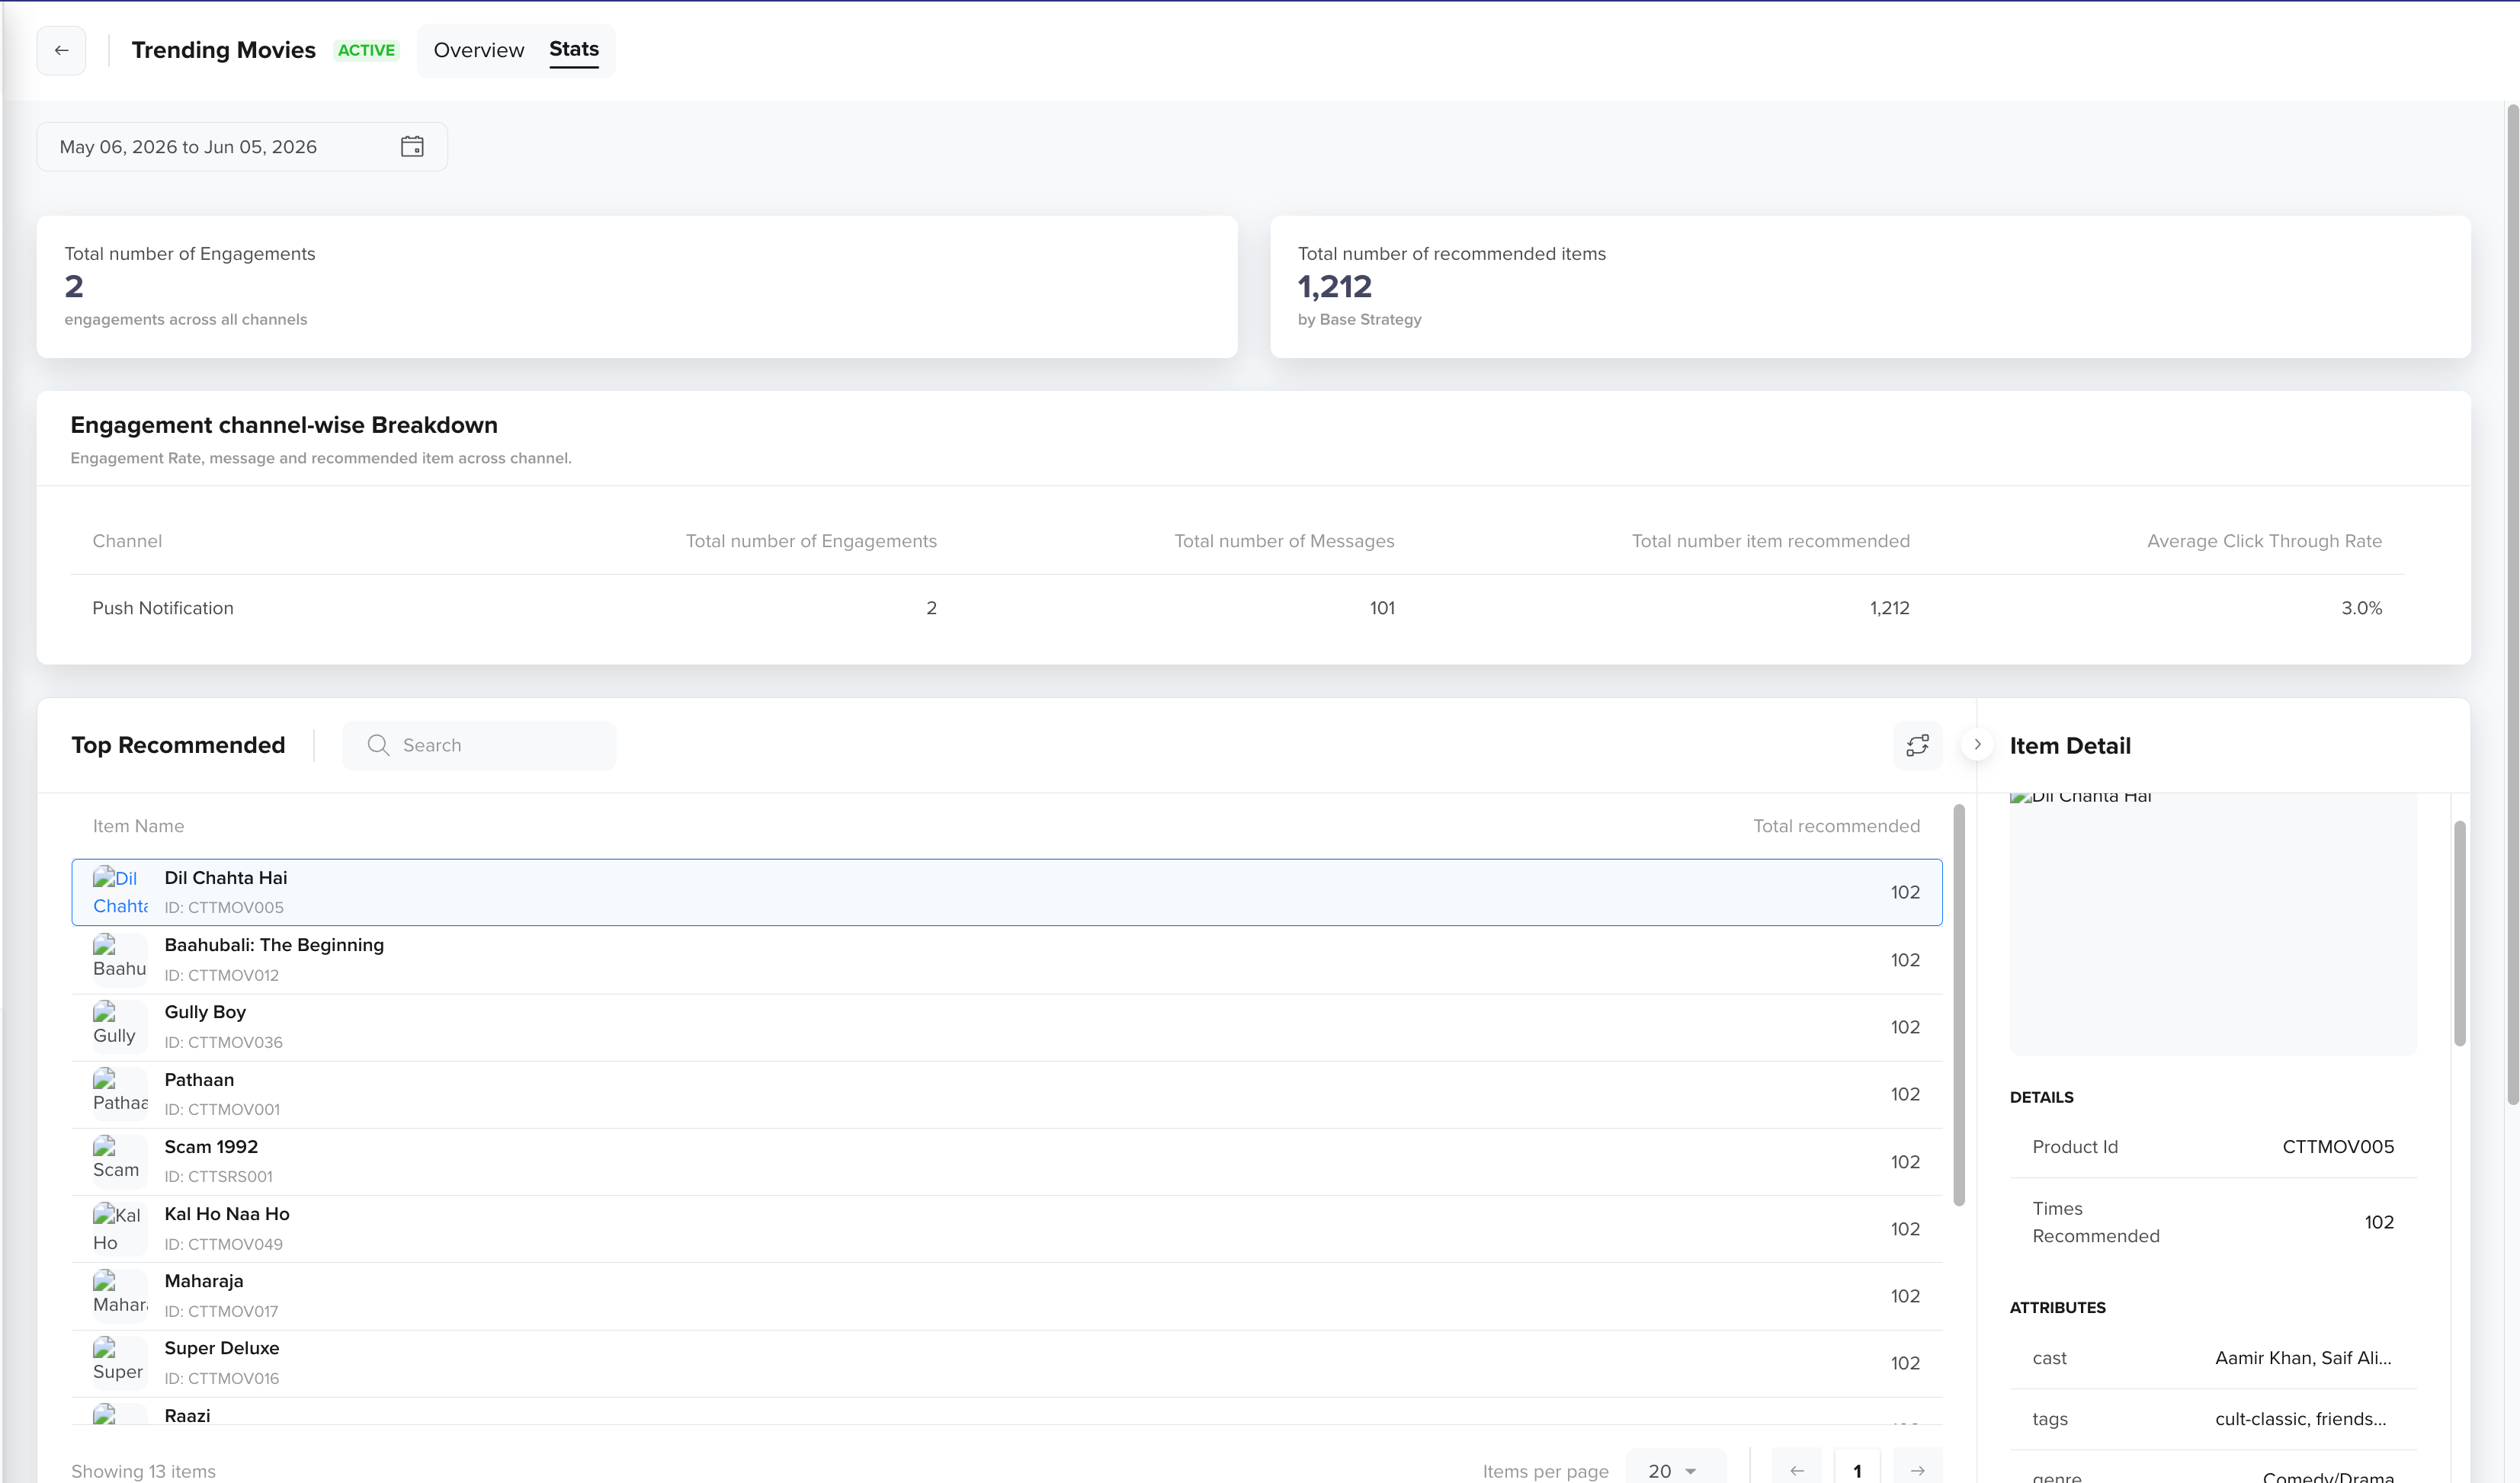
Recommendation Strategy Stats Page
It helps you understand the following:
- Channels driving the highest engagement
- Whether the recommendation volume aligns with engagement
- Items most frequently recommended versus most effective
- Opportunities to improve click-through rate by channel or item
Date Range and Filters
Select a date range to analyze recommendation performance over a specific period. All metrics on this page update dynamically based on the selected timeframe.
Key Metrics
At the top of the page, you can see a high-level summary of recommendation performance.
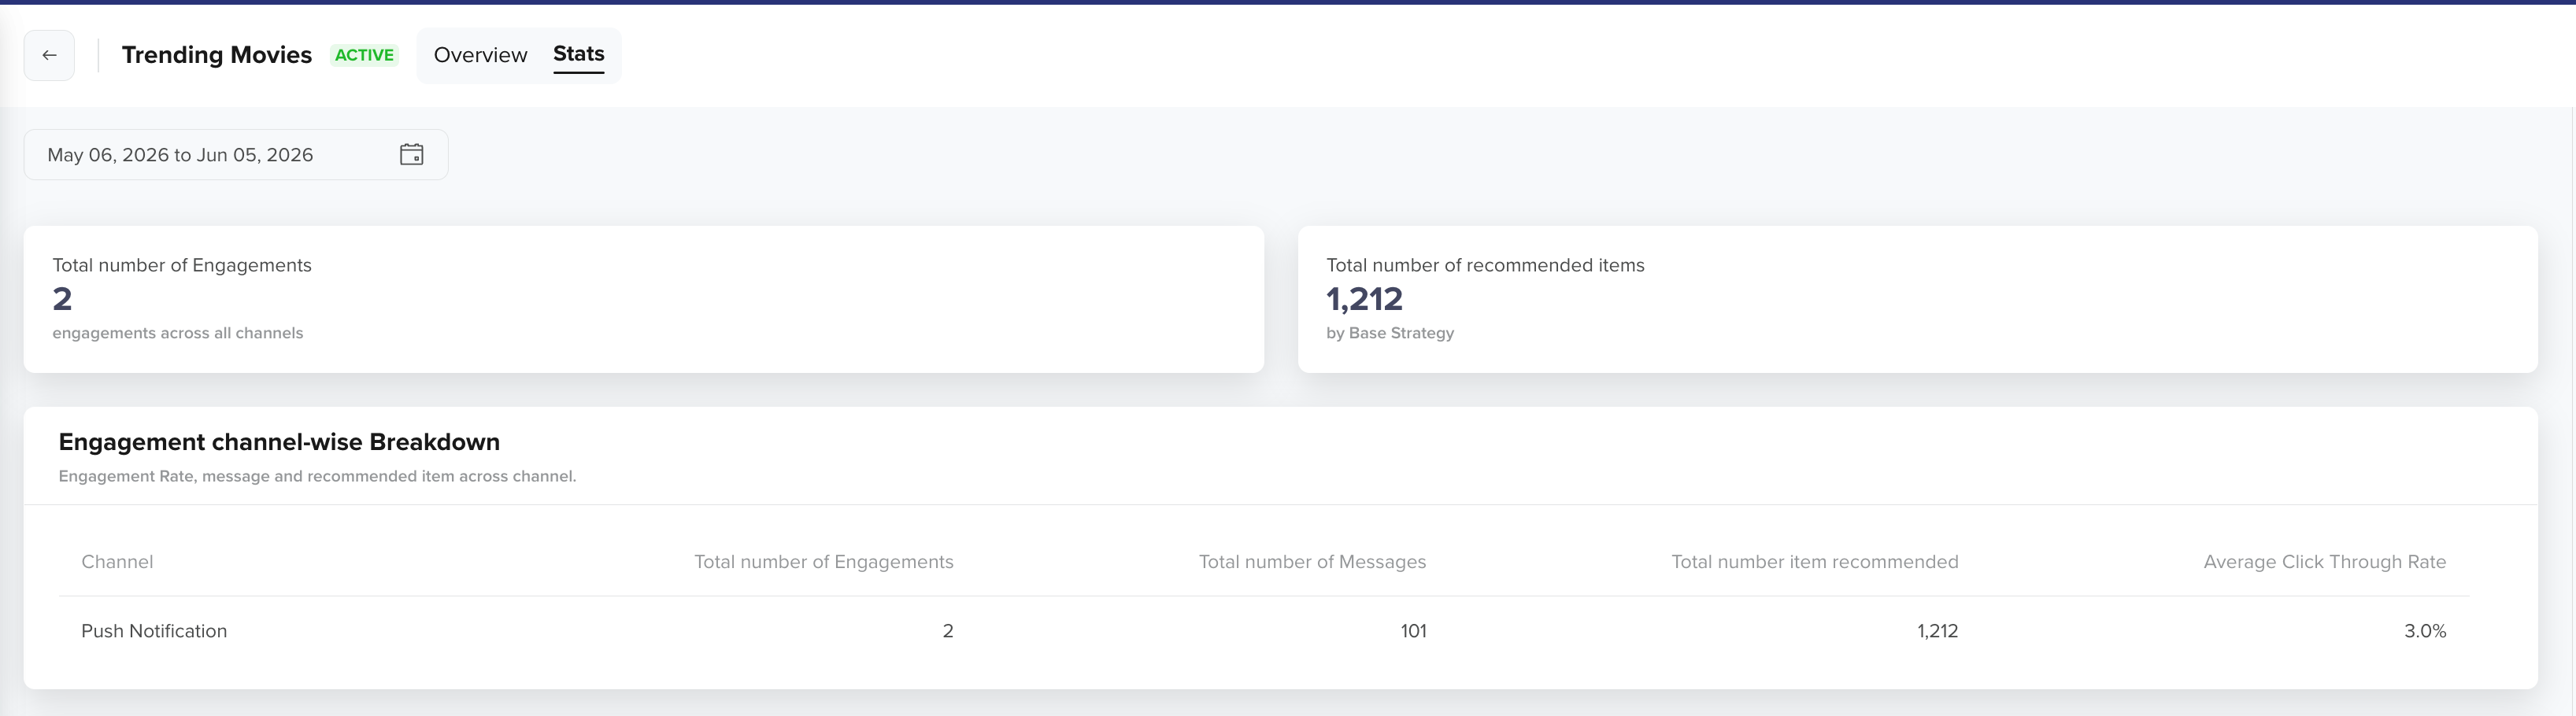
Key Metrics
Total number of engagements
The total number of campaigns, journeys, bulletins, and reminders using this strategy that recorded activity in the selected period, across all channels.
This metric helps you understand how broadly the strategy is being used across active engagements.
Total number of recommended items
The total number of recommendation instances served to users by the base strategy during the selected timeframe. This includes multiple exposures of the same item, each counted separately.
This metric helps you measure recommendation volume and distribution.
Engagement Channel-wise Breakdown
This section breaks down recommendation performance by delivery channel, helping you understand how each channel contributes to overall engagement. You can compare engagement volume, message delivery, recommendation count, and click-through efficiency across channels such as Push Notification, Email, SMS, and others.

Channel-wise Breakdown of Recommendation Strategy
The following metrics are displayed for each channel:
| Metric | Description |
|---|---|
| Total number of engagements | The total number of campaigns, journeys, bulletins, and reminders delivered through this channel that used the strategy in the selected period. |
| Total number of messages | The number of messages sent through the channel that contained recommendations. |
| Total number of items recommended | The total count of recommendation instances delivered through the channel. |
| Average click-through rate | The percentage of message views where at least one recommended item link was clicked. |
To drill into which engagements are active on a channel, click View all [Channel] engagements on the channel row, or use the three-dot menu to navigate directly to a specific engagement type:

View All Channel-wise Engagements
Top Recommended
This section displays the most frequently recommended items.
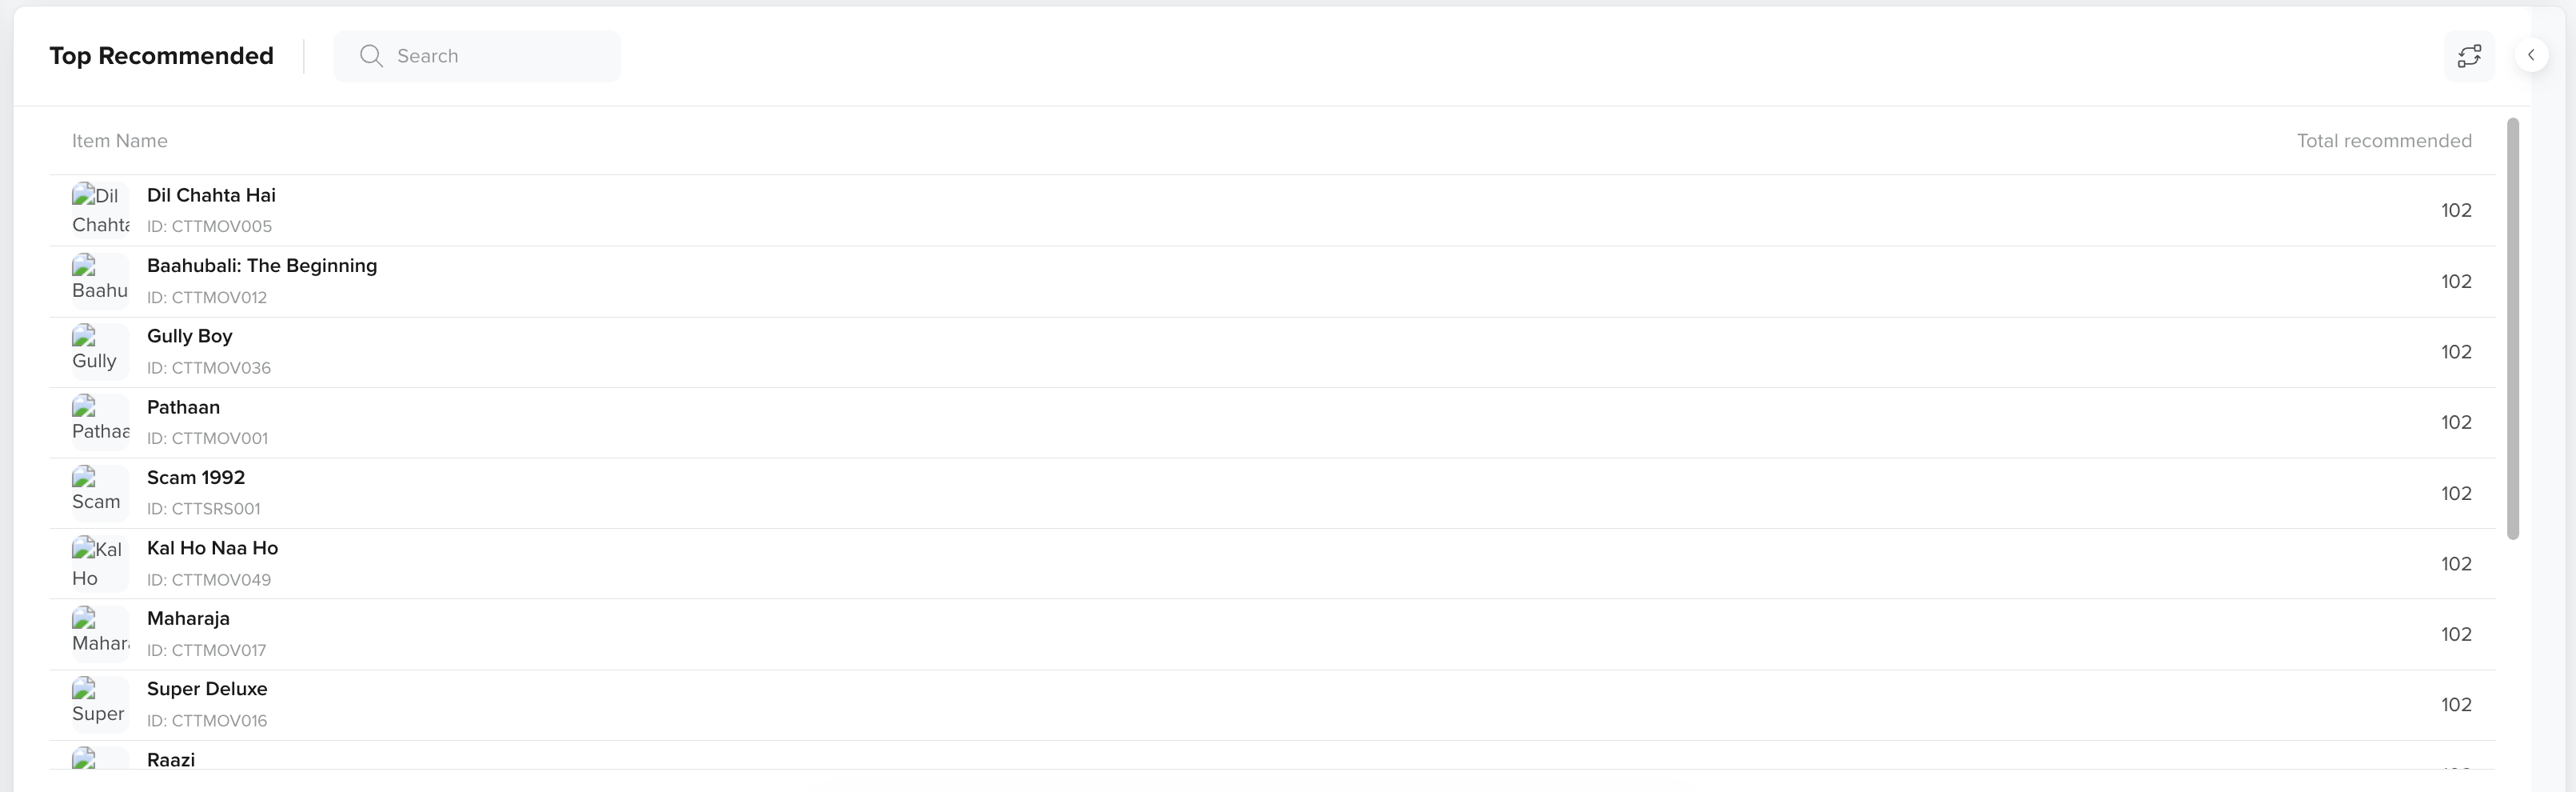
Top Recommended Items
Use it to:
- Evaluate the performance of individual items
- Identify high-converting recommendations
- Optimize item ranking strategies
The following table describes the columns in this section:
| Column | Description |
|---|---|
| Item Name | The name and ID of the recommended item. Click on an item to view its details in the Item Detail panel. |
| Total Recommended | The number of times the item was recommended to users in the selected period. |
To find a specific item, use the search bar to look up by name or ID.
Item Detail
When you select an item from the Top Recommended list, the Item Detail panel opens on the right side of the page.
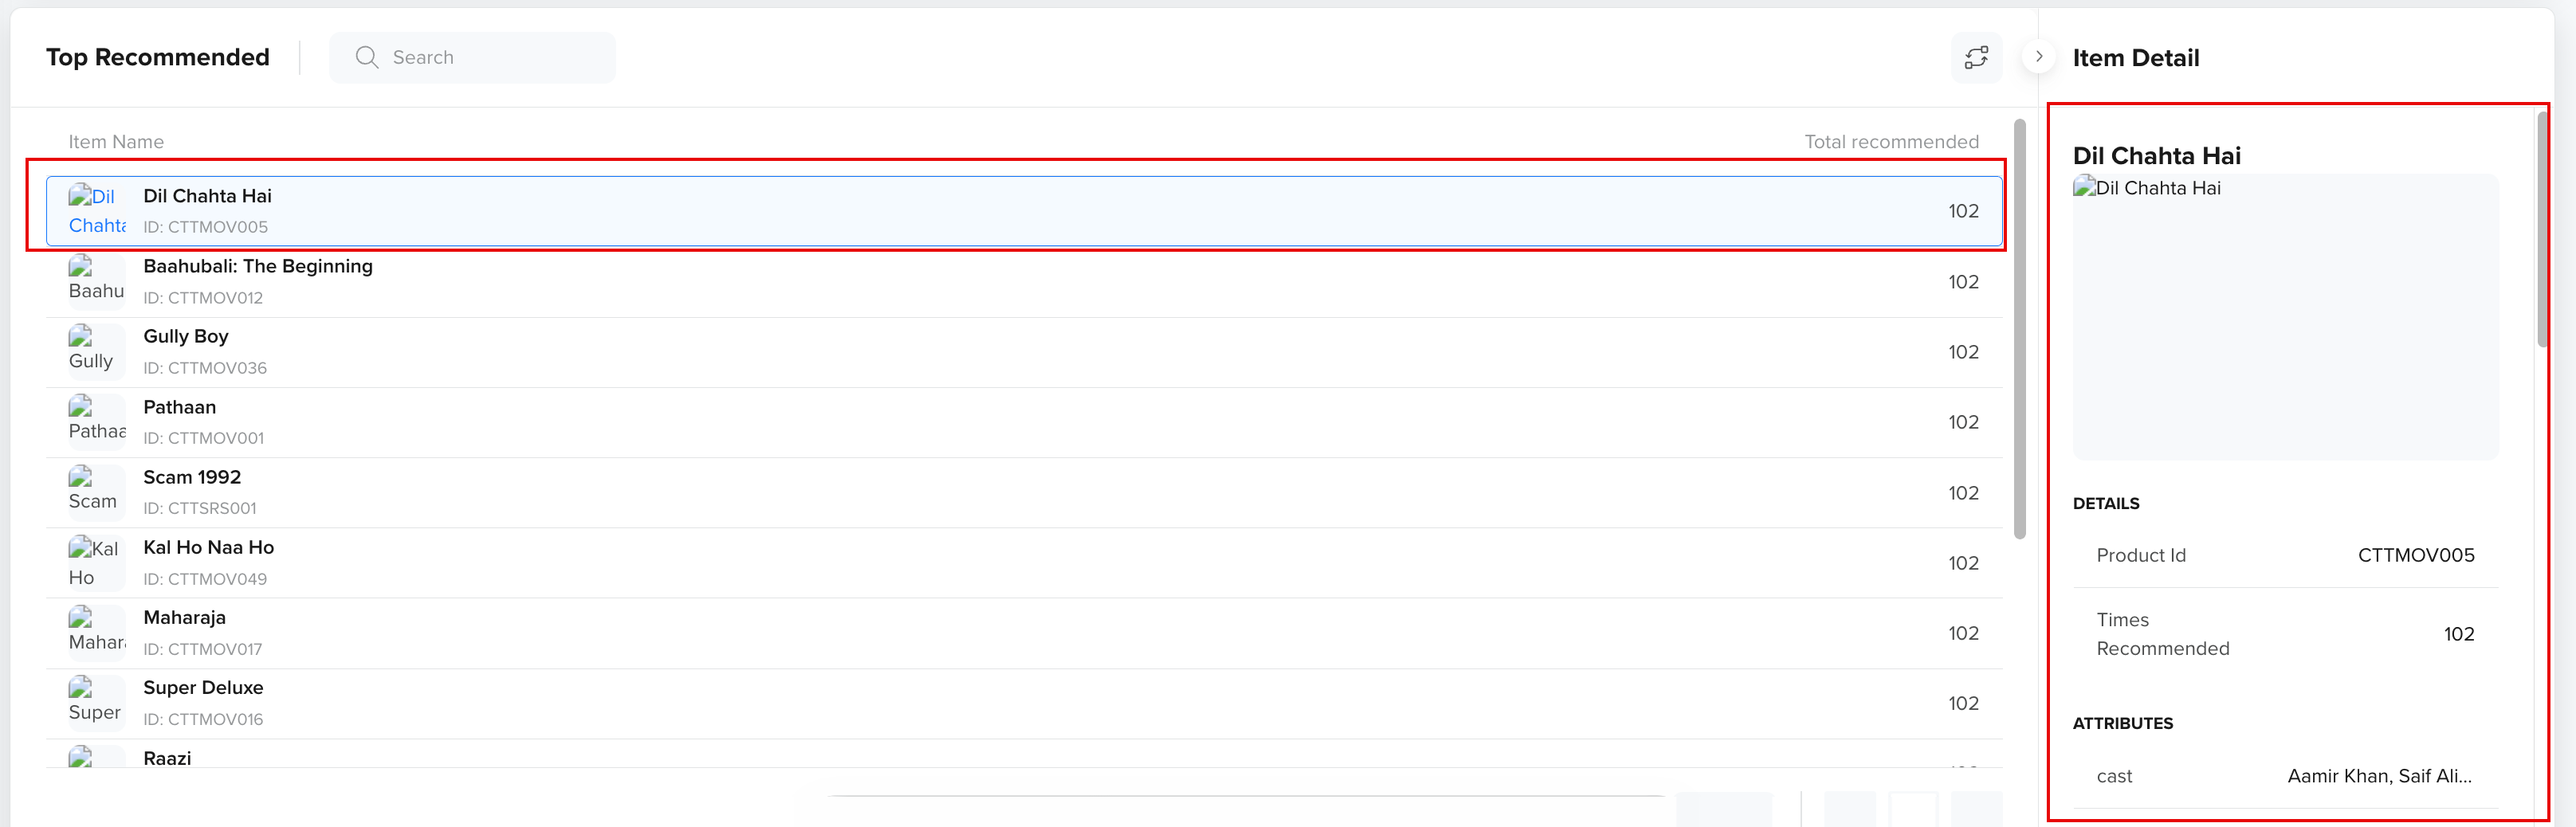
Item Detail Panel
The Item Detail panel displays the following:
| Column | Description |
|---|---|
| Detail | Displays the following:
|
| Attributes | Dynamic key-value pairs from the item catalog, for example, genre, cast, language, and rating. The attributes displayed depend on the catalog schema configured for your account. |
Updated about 2 months ago