Debugger
CleverTap Debugger: Enhancing Integration Troubleshooting
Public BetaThis feature is released in Public Beta. For more information about this integration, contact your Success Manager or the CleverTap Support.
Overview
The CleverTap Debugger feature is a robust tool that simplifies integration and debugging with CleverTap. The primary objective is to improve the go-live process by assisting users in auditing integration and swiftly resolving errors directly on the CleverTap dashboard.
Key Objectives
The Debugger feature aims for the following:
- Ensures data is correctly sent to CleverTap by visually confirming its ingestion.
- Provides a single place from where you can view events and user properties of debug-enabled profiles.
- Verifies the Reachability status.
- Enables you to check the data and data types sent from the App to CleverTap on a single view along with timestamps.
Prerequisites
Before using the CleverTap Debugger feature, ensure you have the following:
- Access to CleverTap Test or Production account.
- Successfully integrated CleverTap SDK's debugger-supported version into your application or website. The following table lists the Debugger-supported SDK versions for different platforms:
| Platform | Debugger-Supported Version |
|---|---|
| iOS | v5.2.1 or higher |
| Android | v.5.2.1 or higher |
| Cordova | v2.7.2. or higher |
| Flutter | v1.9.1 or higher |
| React Native | v1.1.2 or higher |
| Unity | v.3.0.0 or higher |
| Web | v.1.6.7 or higher |
-
Enabled the Debug Mode. The steps to enable this mode vary depending on your platform. Refer to the respective debugger documentation as listed below:
Access the Debugger Feature
Click the ![]() Debugger icon on the left pane of the CleverTap dashboard.
Debugger icon on the left pane of the CleverTap dashboard.
The Debugger page opens, displaying all the user profiles with their details.
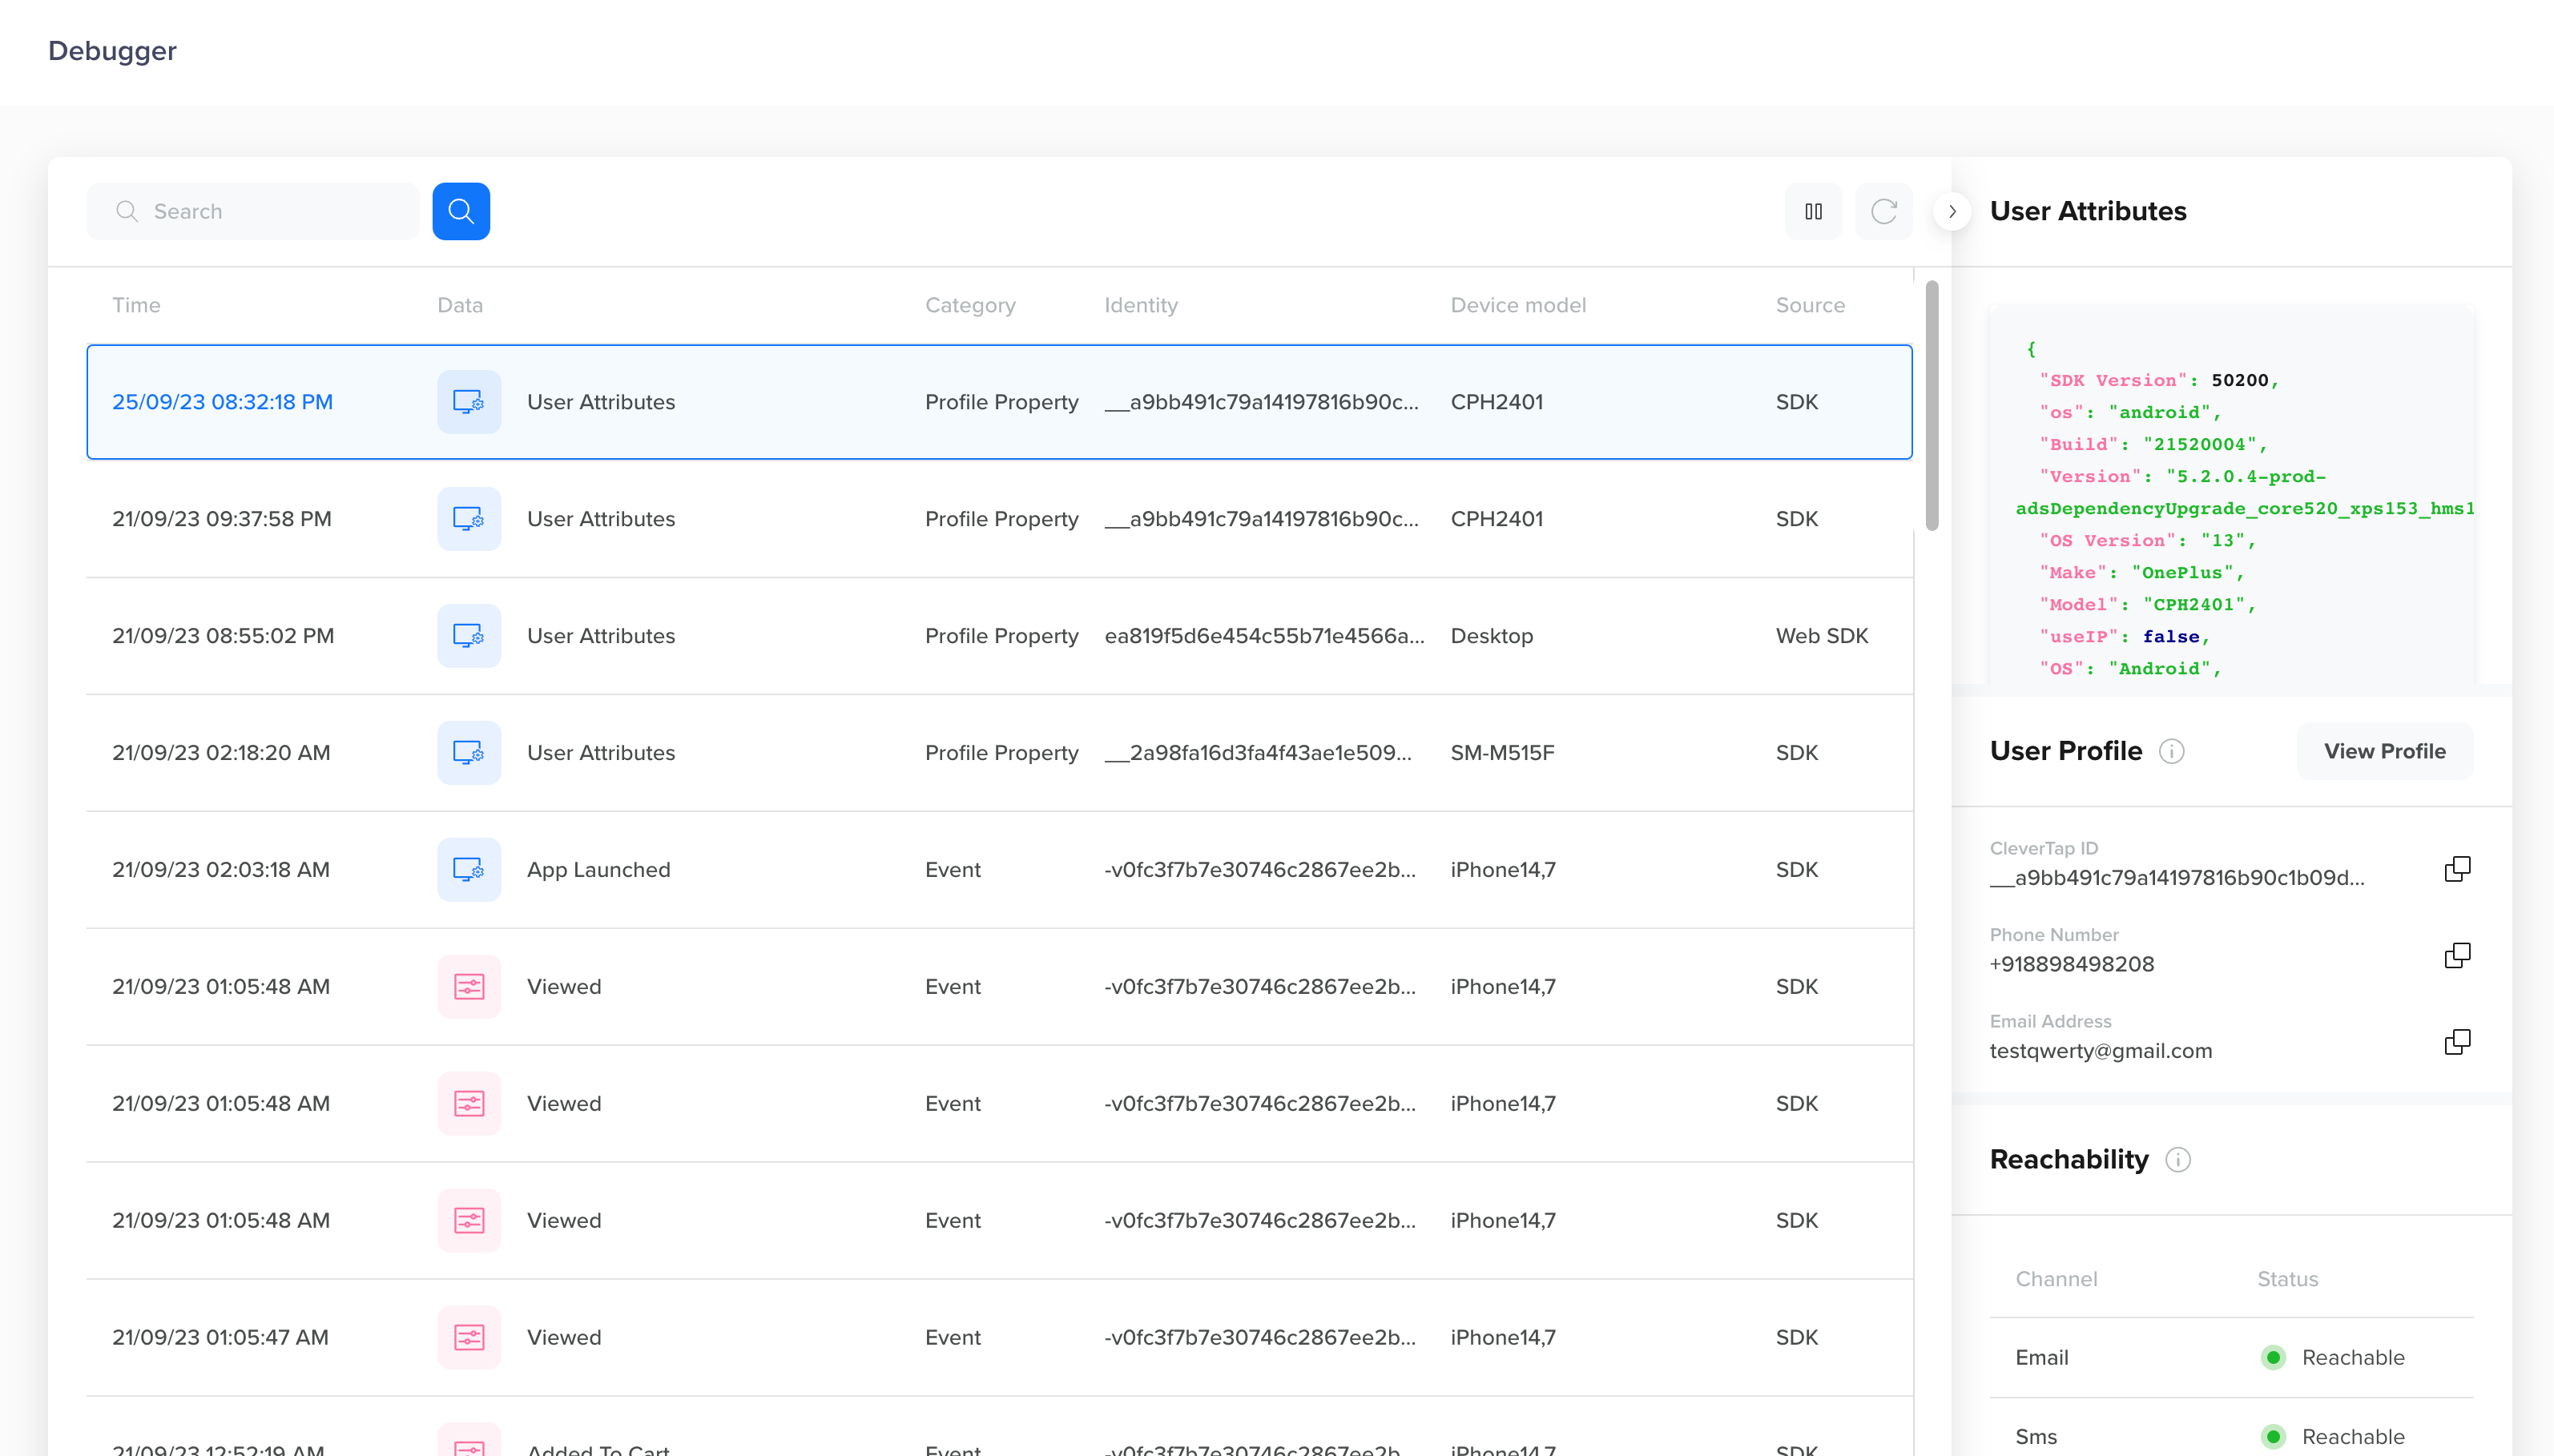 Accessing the Debugger Feature
Data Storage
- Debug data remains accessible for a duration of seven days from the time the data is fetched.
- Each account is equipped with the capacity to execute up to 1000 storage requests.
- The system can handle up to 100 incoming storage requests per minute.
You can view the following details for the debugged user profile:
| Field | Description |
|---|---|
| Time | This field displays the exact date and time when the user interaction occurred. |
| Data | This field displays the raw data associated with a specific user interaction. It includes information about the actions taken, events triggered, and any relevant data points tied to the user's activity. |
| Category | This indicates if the data in the user profile is Events or User Property. |
| Identity | This field displays a unique user ID. |
| Device model | This field displays the device model that the user uses. This can be instrumental in identifying hardware-specific issues or compatibility problems. |
| Source | This field displays the SDK associated with the user profile. |
Search
From the Debugger page, you can search for a user profile in the search bar. You can also search for event name, Identity, Device model, or Source.
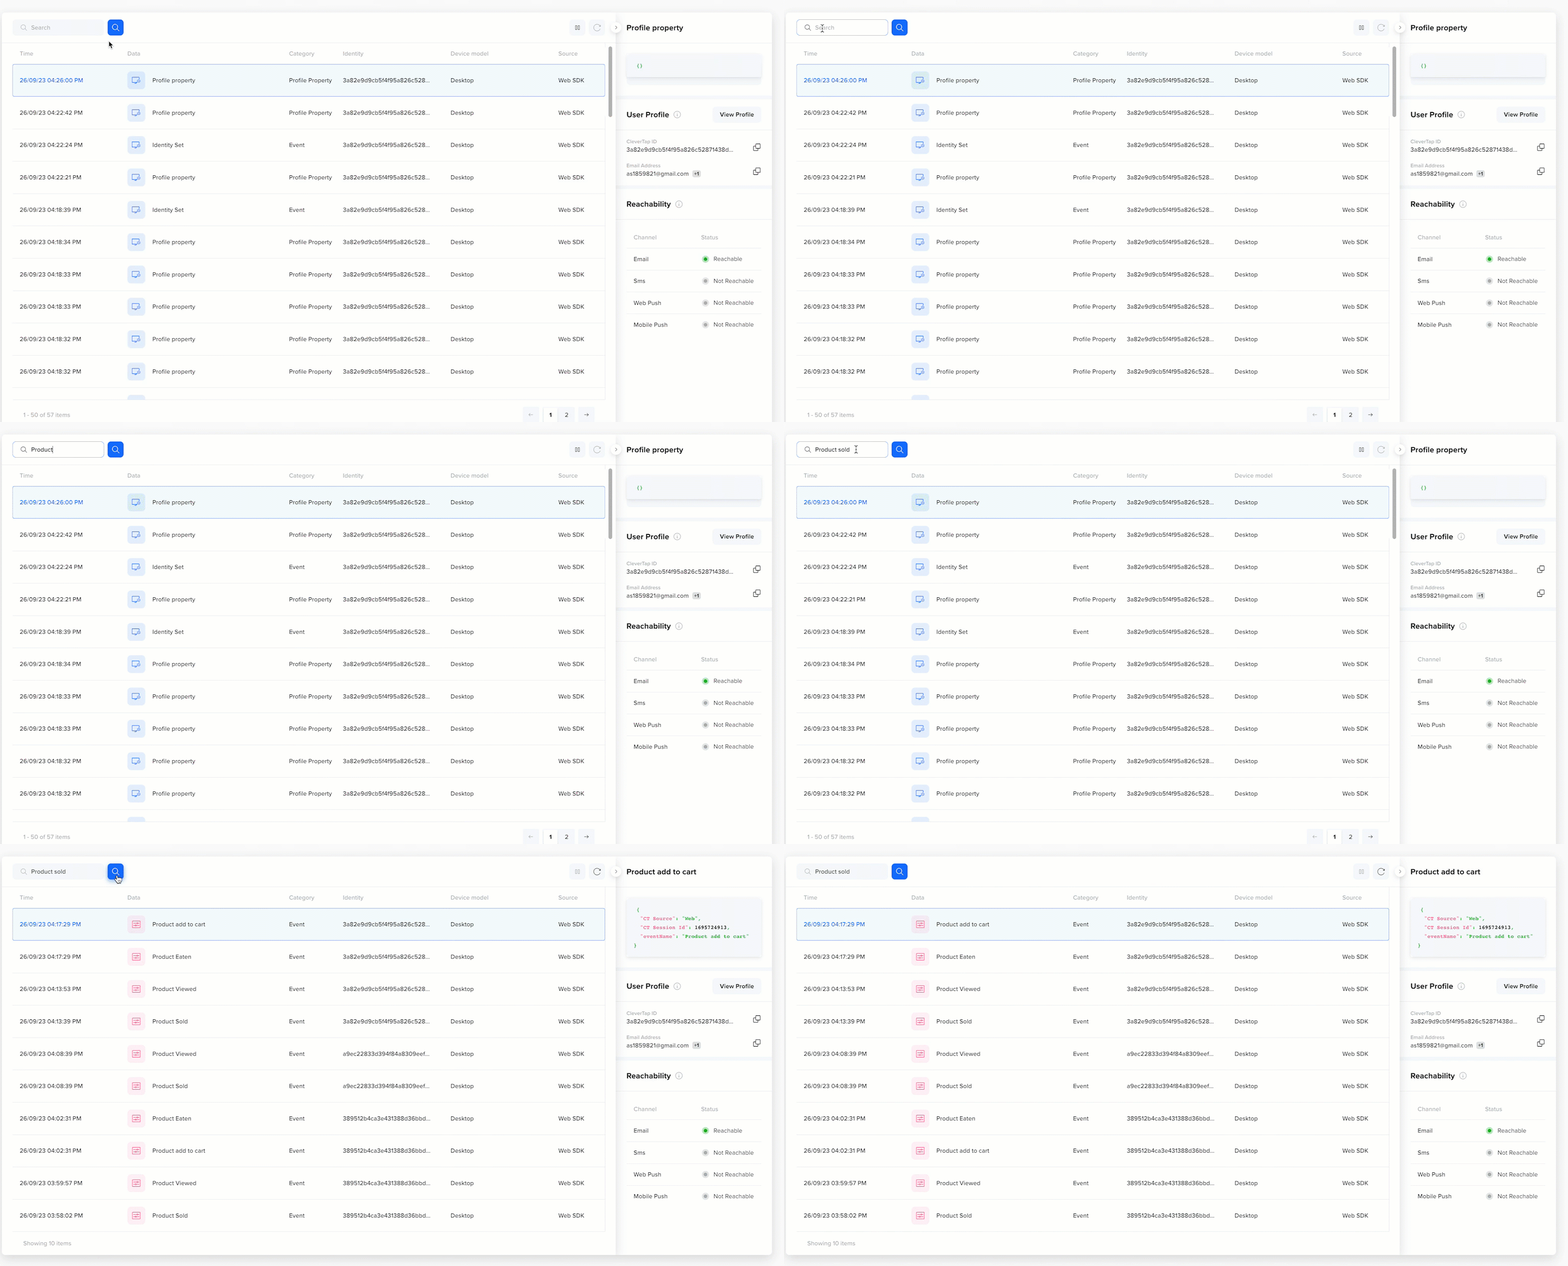 Search Functionality
Play/Pause for User Profile
You can use the Play or Pause icon to start or pause processes during debugging, making it easier to examine and control the execution of debugging sessions. This feature is available only at the user level.
Refresh
Click the ![]() Refresh icon to update the Debugger page. This action displays the most recent data when a filter is applied, or you are not on the initial.
Refresh icon to update the Debugger page. This action displays the most recent data when a filter is applied, or you are not on the initial.
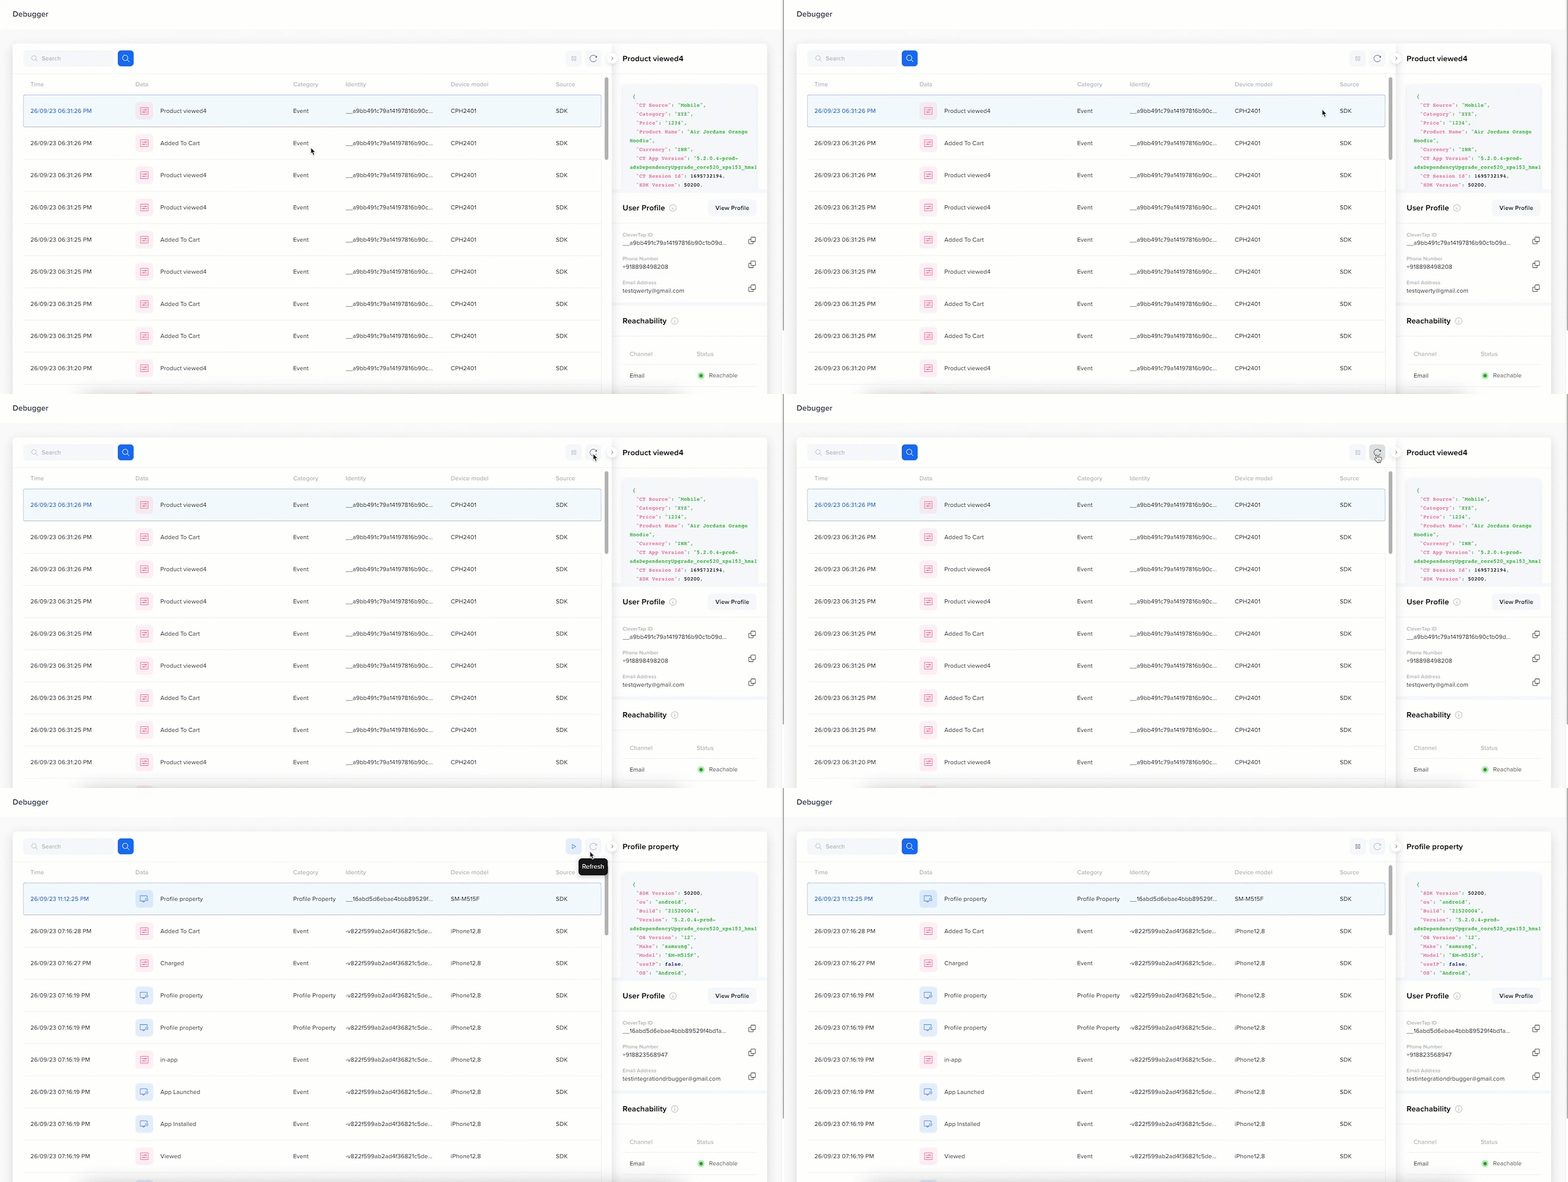 Refresh Functionality
Access User Profile
When troubleshooting user-specific issues or gaining deeper insights into user interactions, it is crucial to be able to delve into individual user profiles. Click on the individual user profile on the Debugger page to view the details on the left pane.
The following details appear on the left pane of the Debugger page.
User Profile
This section provides a summary of the primary identifiers selected for the project.
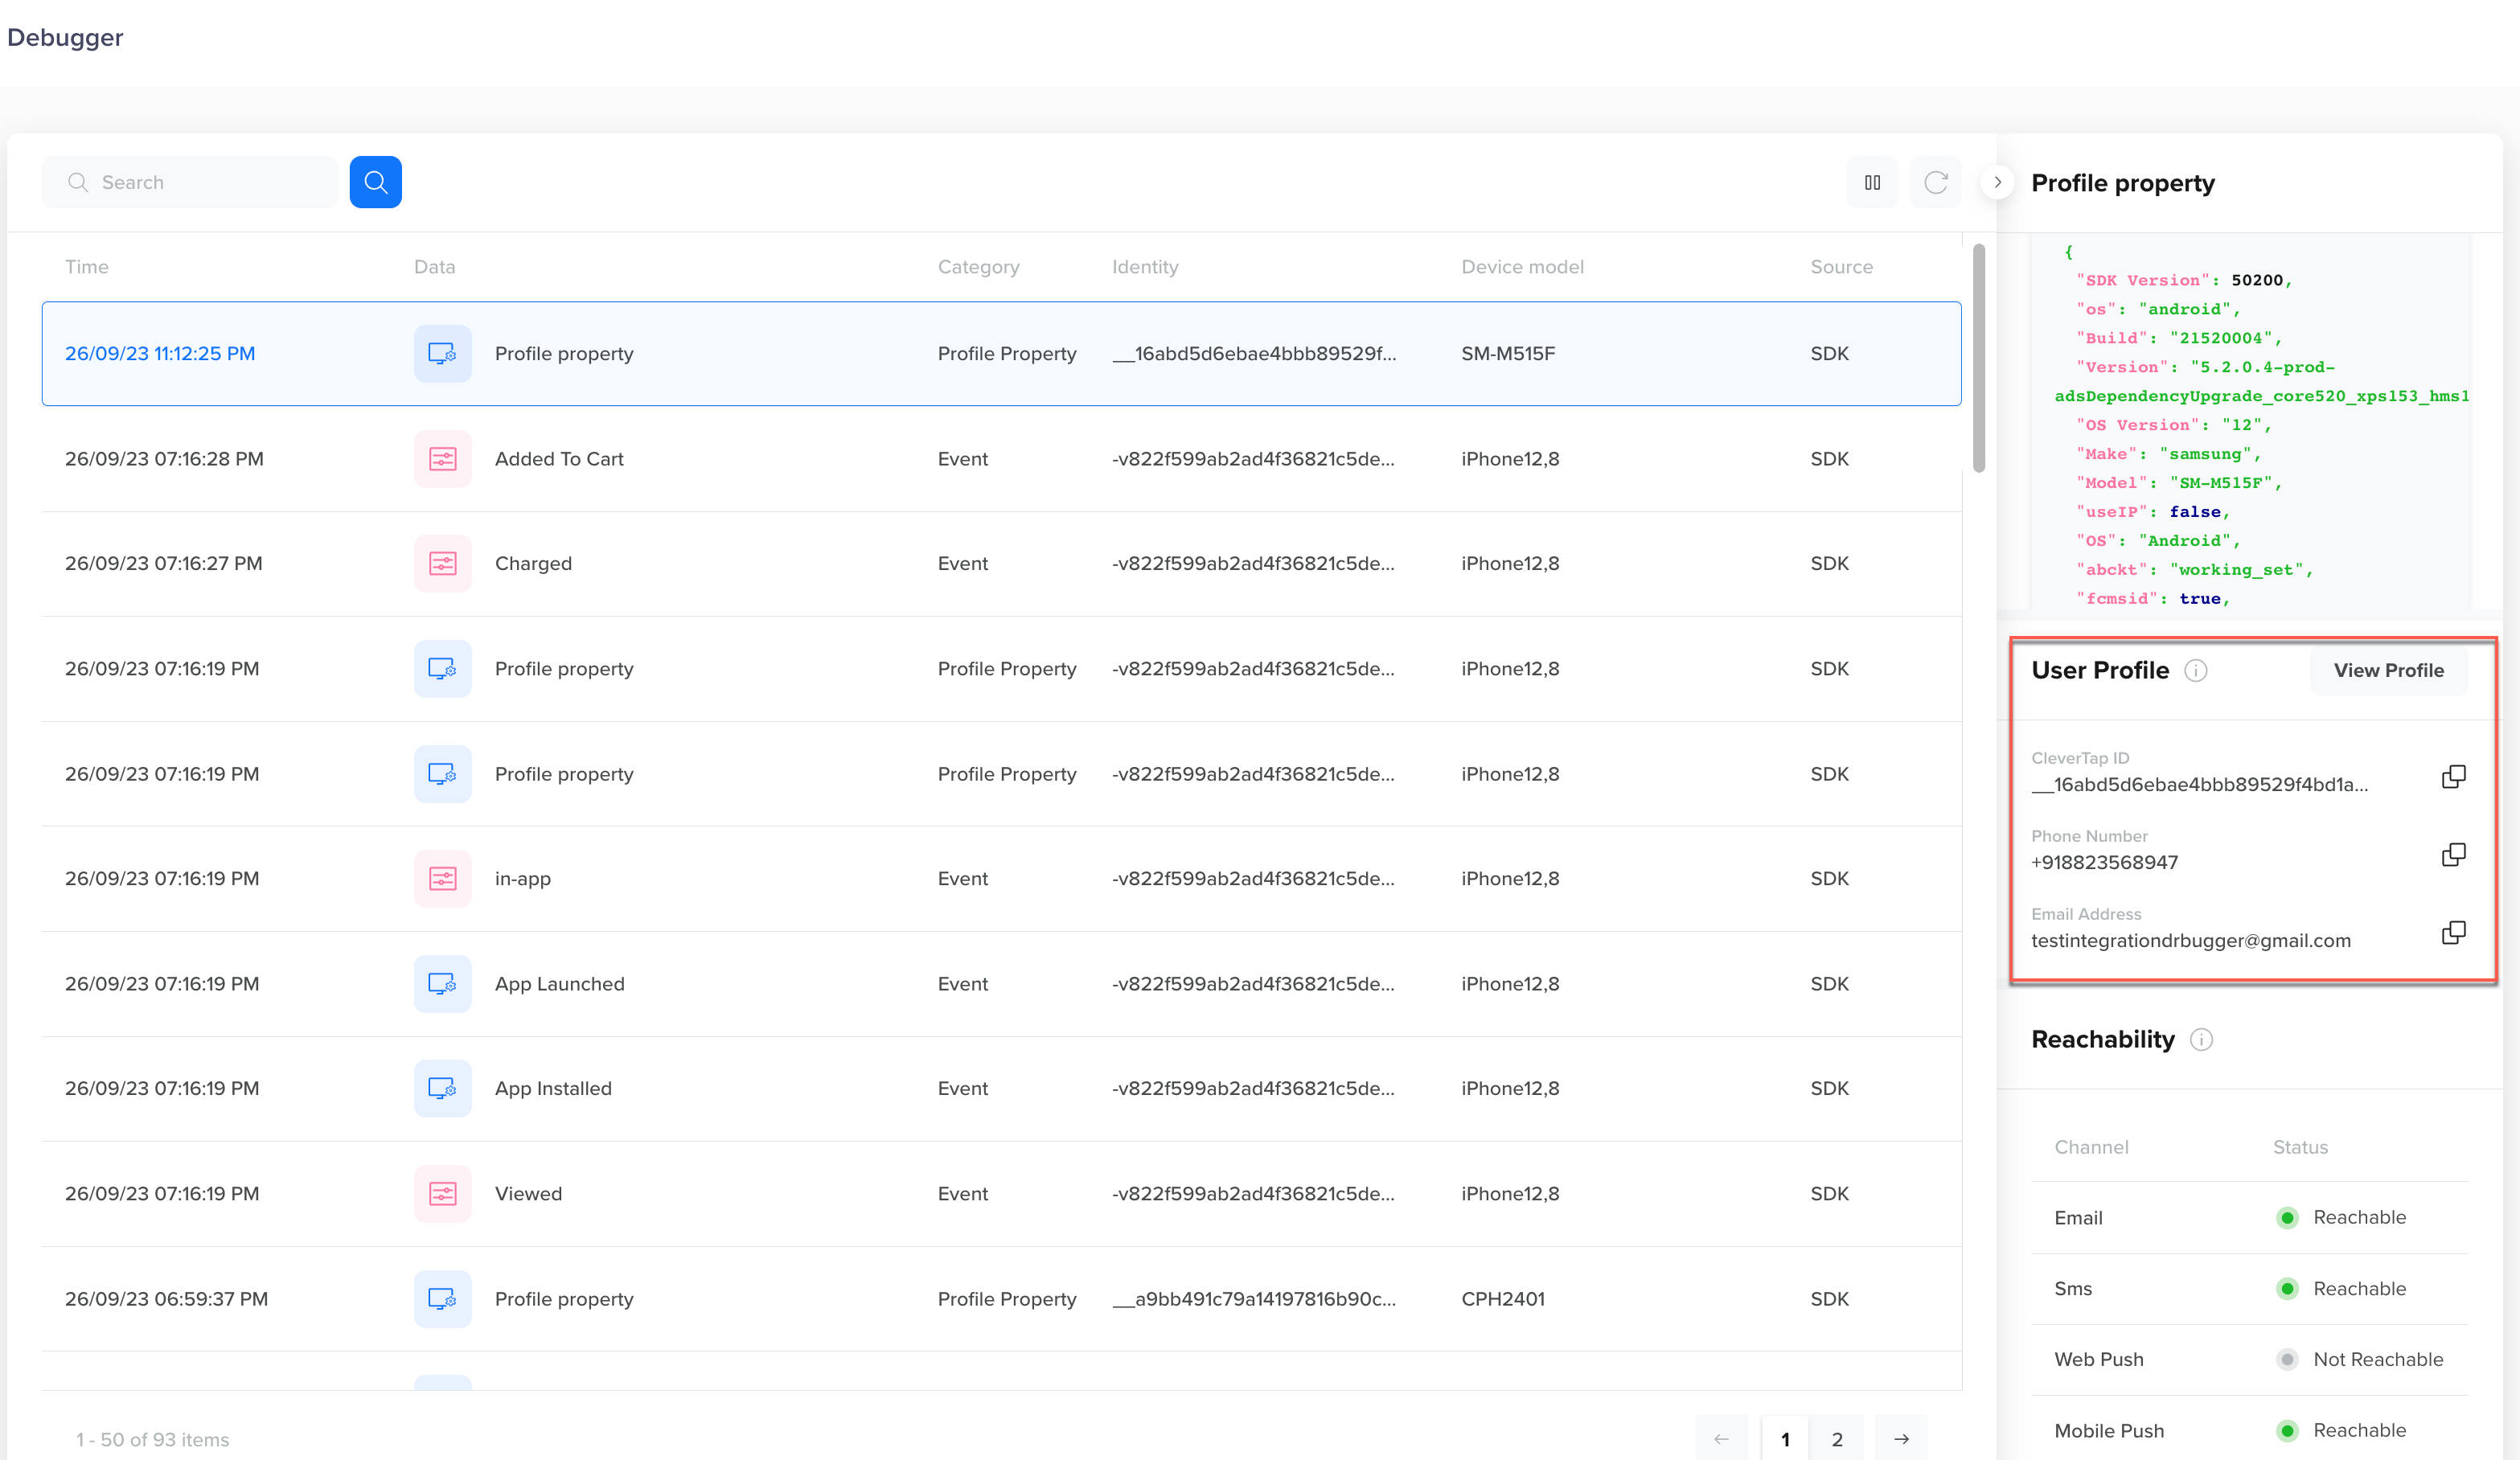 User Profile View
This summary typically includes:
| Field | Description |
|---|---|
| CleverTap ID | A unique identifier within the CleverTap system. |
| Phone Number | The user's registered phone number. |
| Email Address | The user's registered email address. |
To view the user profile details:
- Click the Copy icon beside the respective fields to copy CleverTap ID, Phone Number, or Email Address.
- Click the View Profile icon to check the individual user profile details. The Find People>
Profile page appears. For more information on user details, view Profile Details.
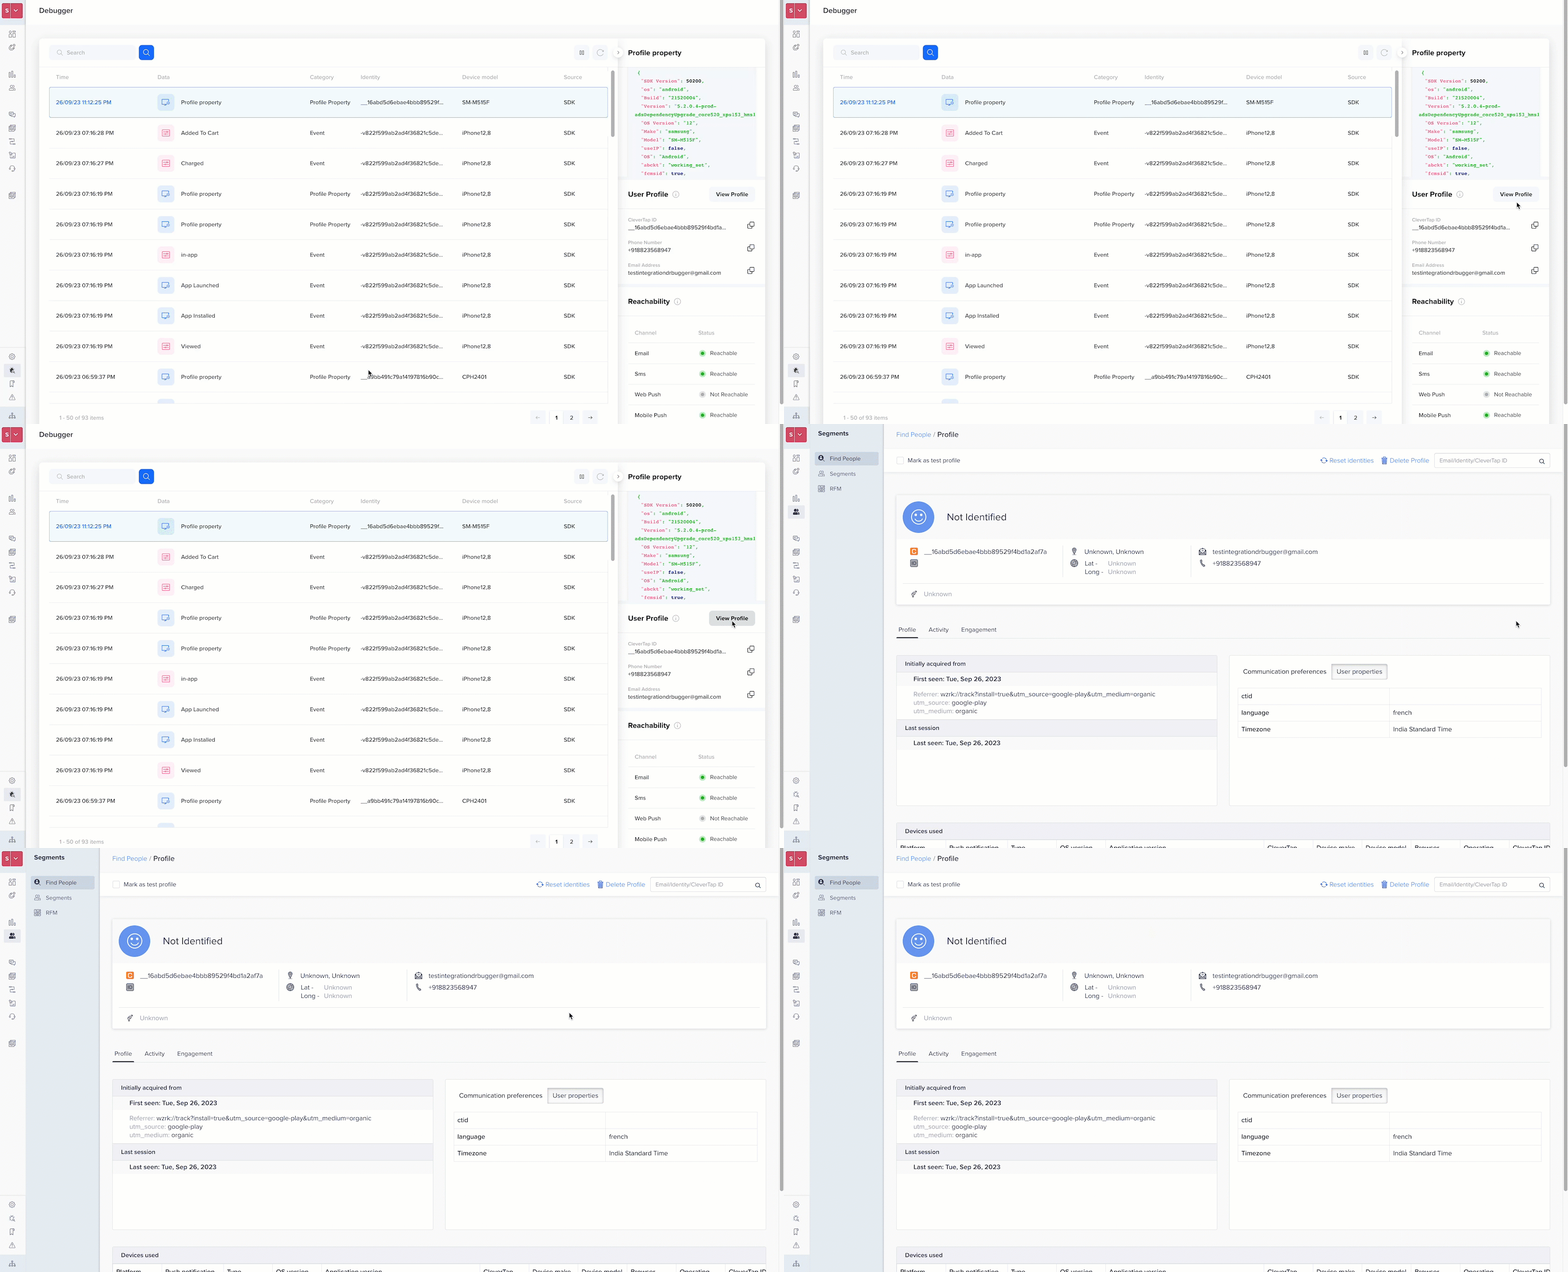 View Profile
User Profile states
- Identity Present- In this case, the user's identity is established, and the corresponding ID is displayed. If there is a profile push onto the profile, the data column displays Profile data, and the data type indicates whether it is a Profile property or identity. If both profile properties and identity are present, the profile property is shown.
- Identity Absent- If identity is not set, then the field is empty.
JSON Payload
In the JSON payload section, you can view the JSON payload of data coming in from the SDK/JSON for an event or user property.
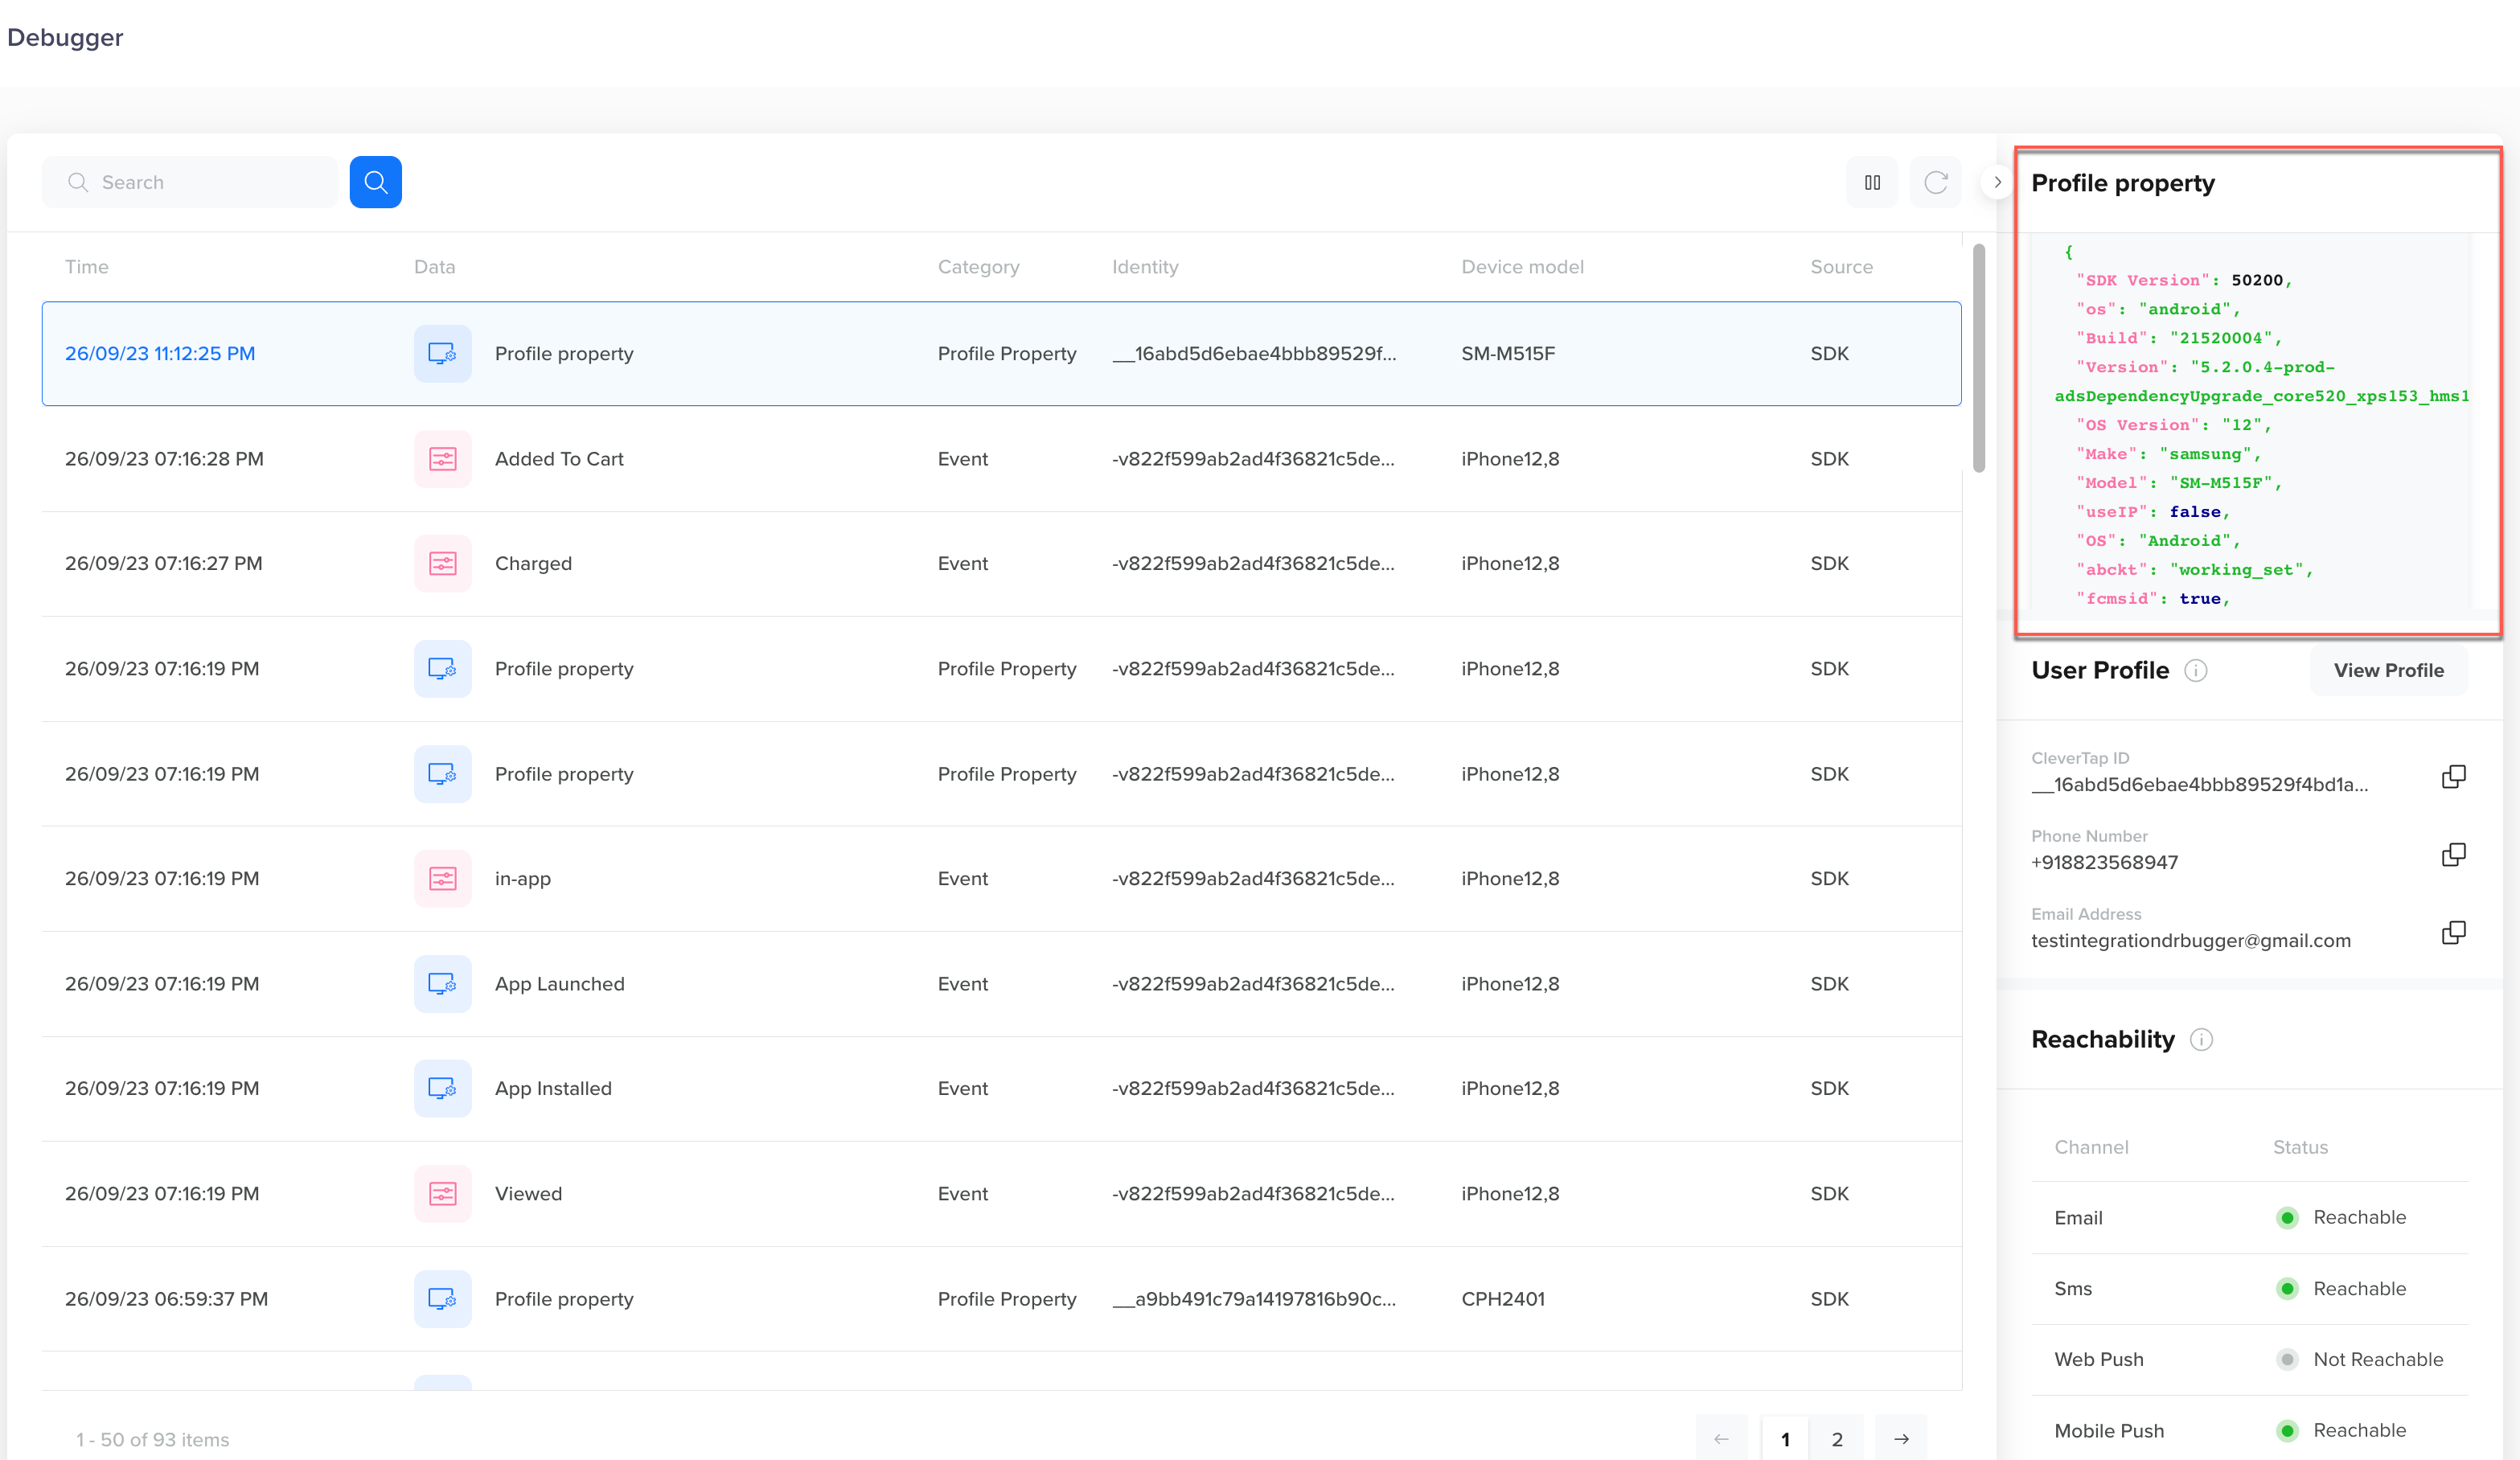 JSON Payload View
Reload TimeIf the JSON payload section does not load within 10 seconds, please refresh the page.
Reachability
This allows you to verify if the user is reachable on the following channels:
- Mobile Push
- SMS
- Web Push
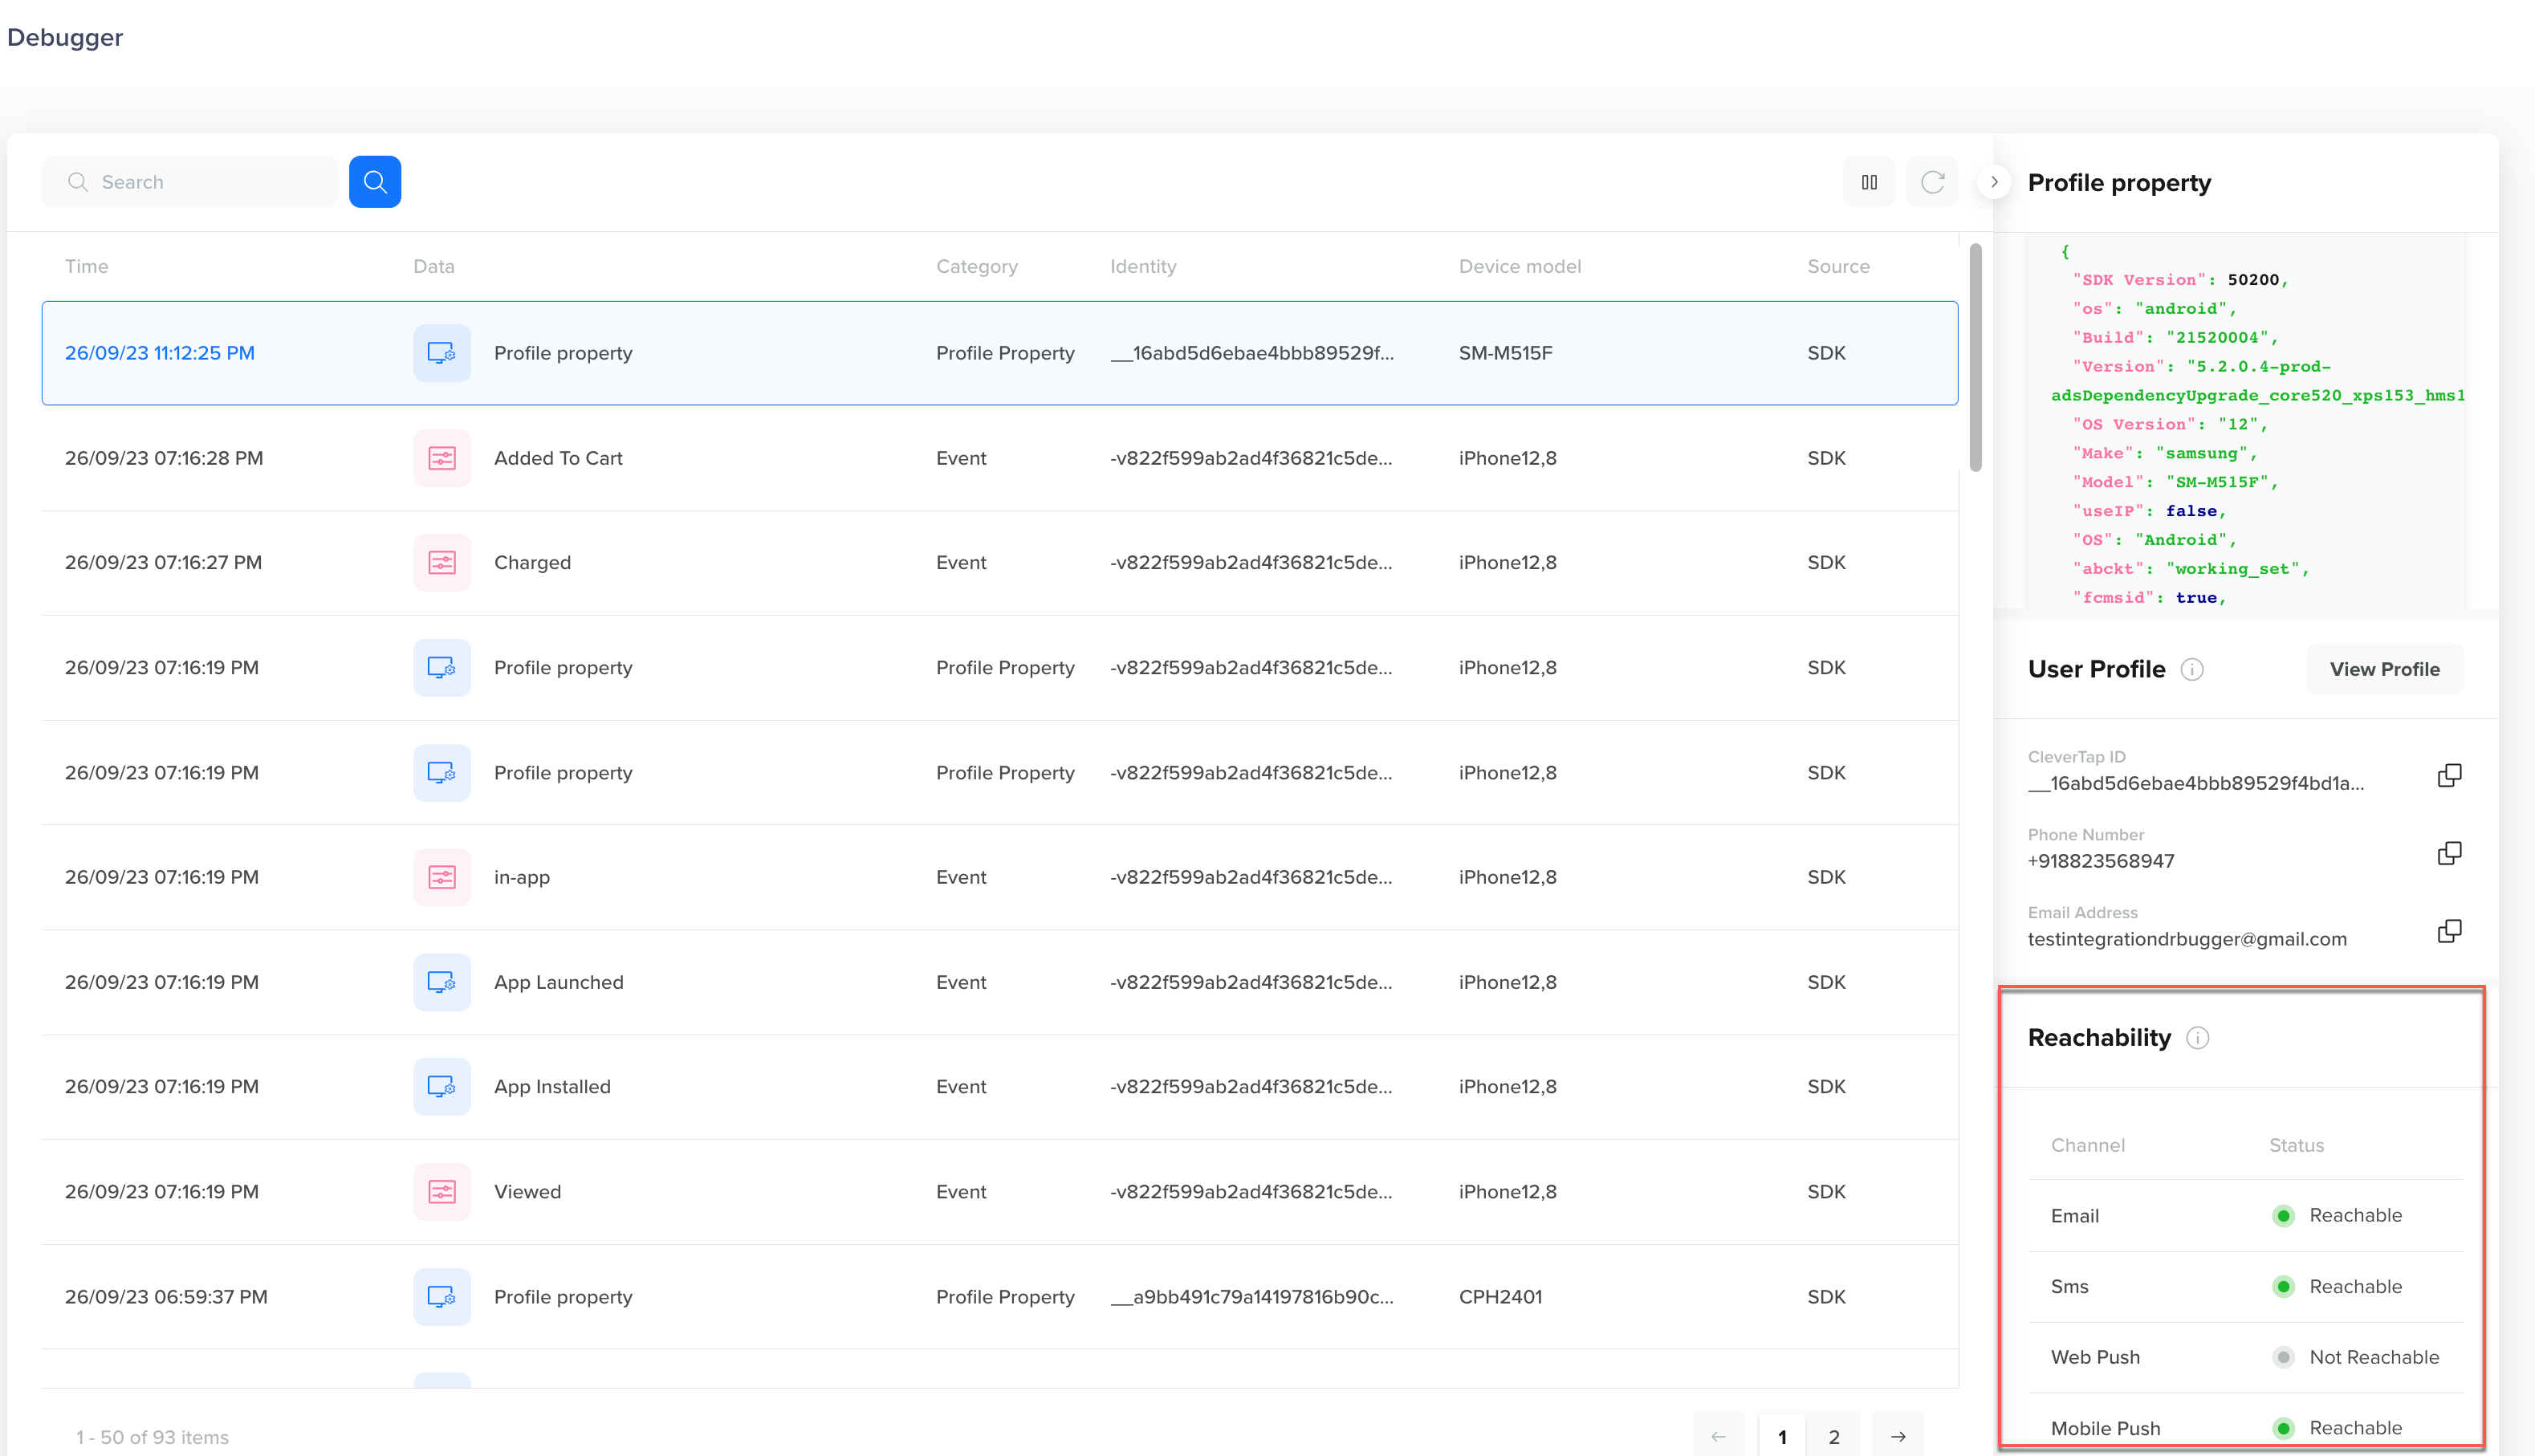 Channels Reachability
Under the Status column for individual channels, you can view the following state for the channels:
| Status | Description |
|---|---|
| Reachable | Indicates that the user is reachable on the respective channel. This is indicated by the green status icon. |
| Not Reachable | Indicates that the user is not reachable on the respective channel. This is indicated by the grey status icon. |
Updated 5 months ago
