Engagement Stats
Track and manage campaign performance across all journey channels with unified Engagement Stats.
Overview
Engagement Stats provide a unified view of how each messaging node performs across all versions of a journey, helping marketers make data-driven decisions.
For instance, a lifecycle marketing team may iterate on a welcome journey to improve user onboarding, testing different message sequences, timings, or channels in each version. With Engagement Stats, they can easily evaluate how each version performs in terms of overall engagement, delivery, and conversions, helping them identify the most effective strategy and continuously optimize user experiences across the funnel.
View Engagement Stats
To view engagement stats:
-
Go to Journeys. Click the desired Journey and click Engagement Stats.
-
Select the version from the Version dropdown to view the stats for the specific version of the Journey.
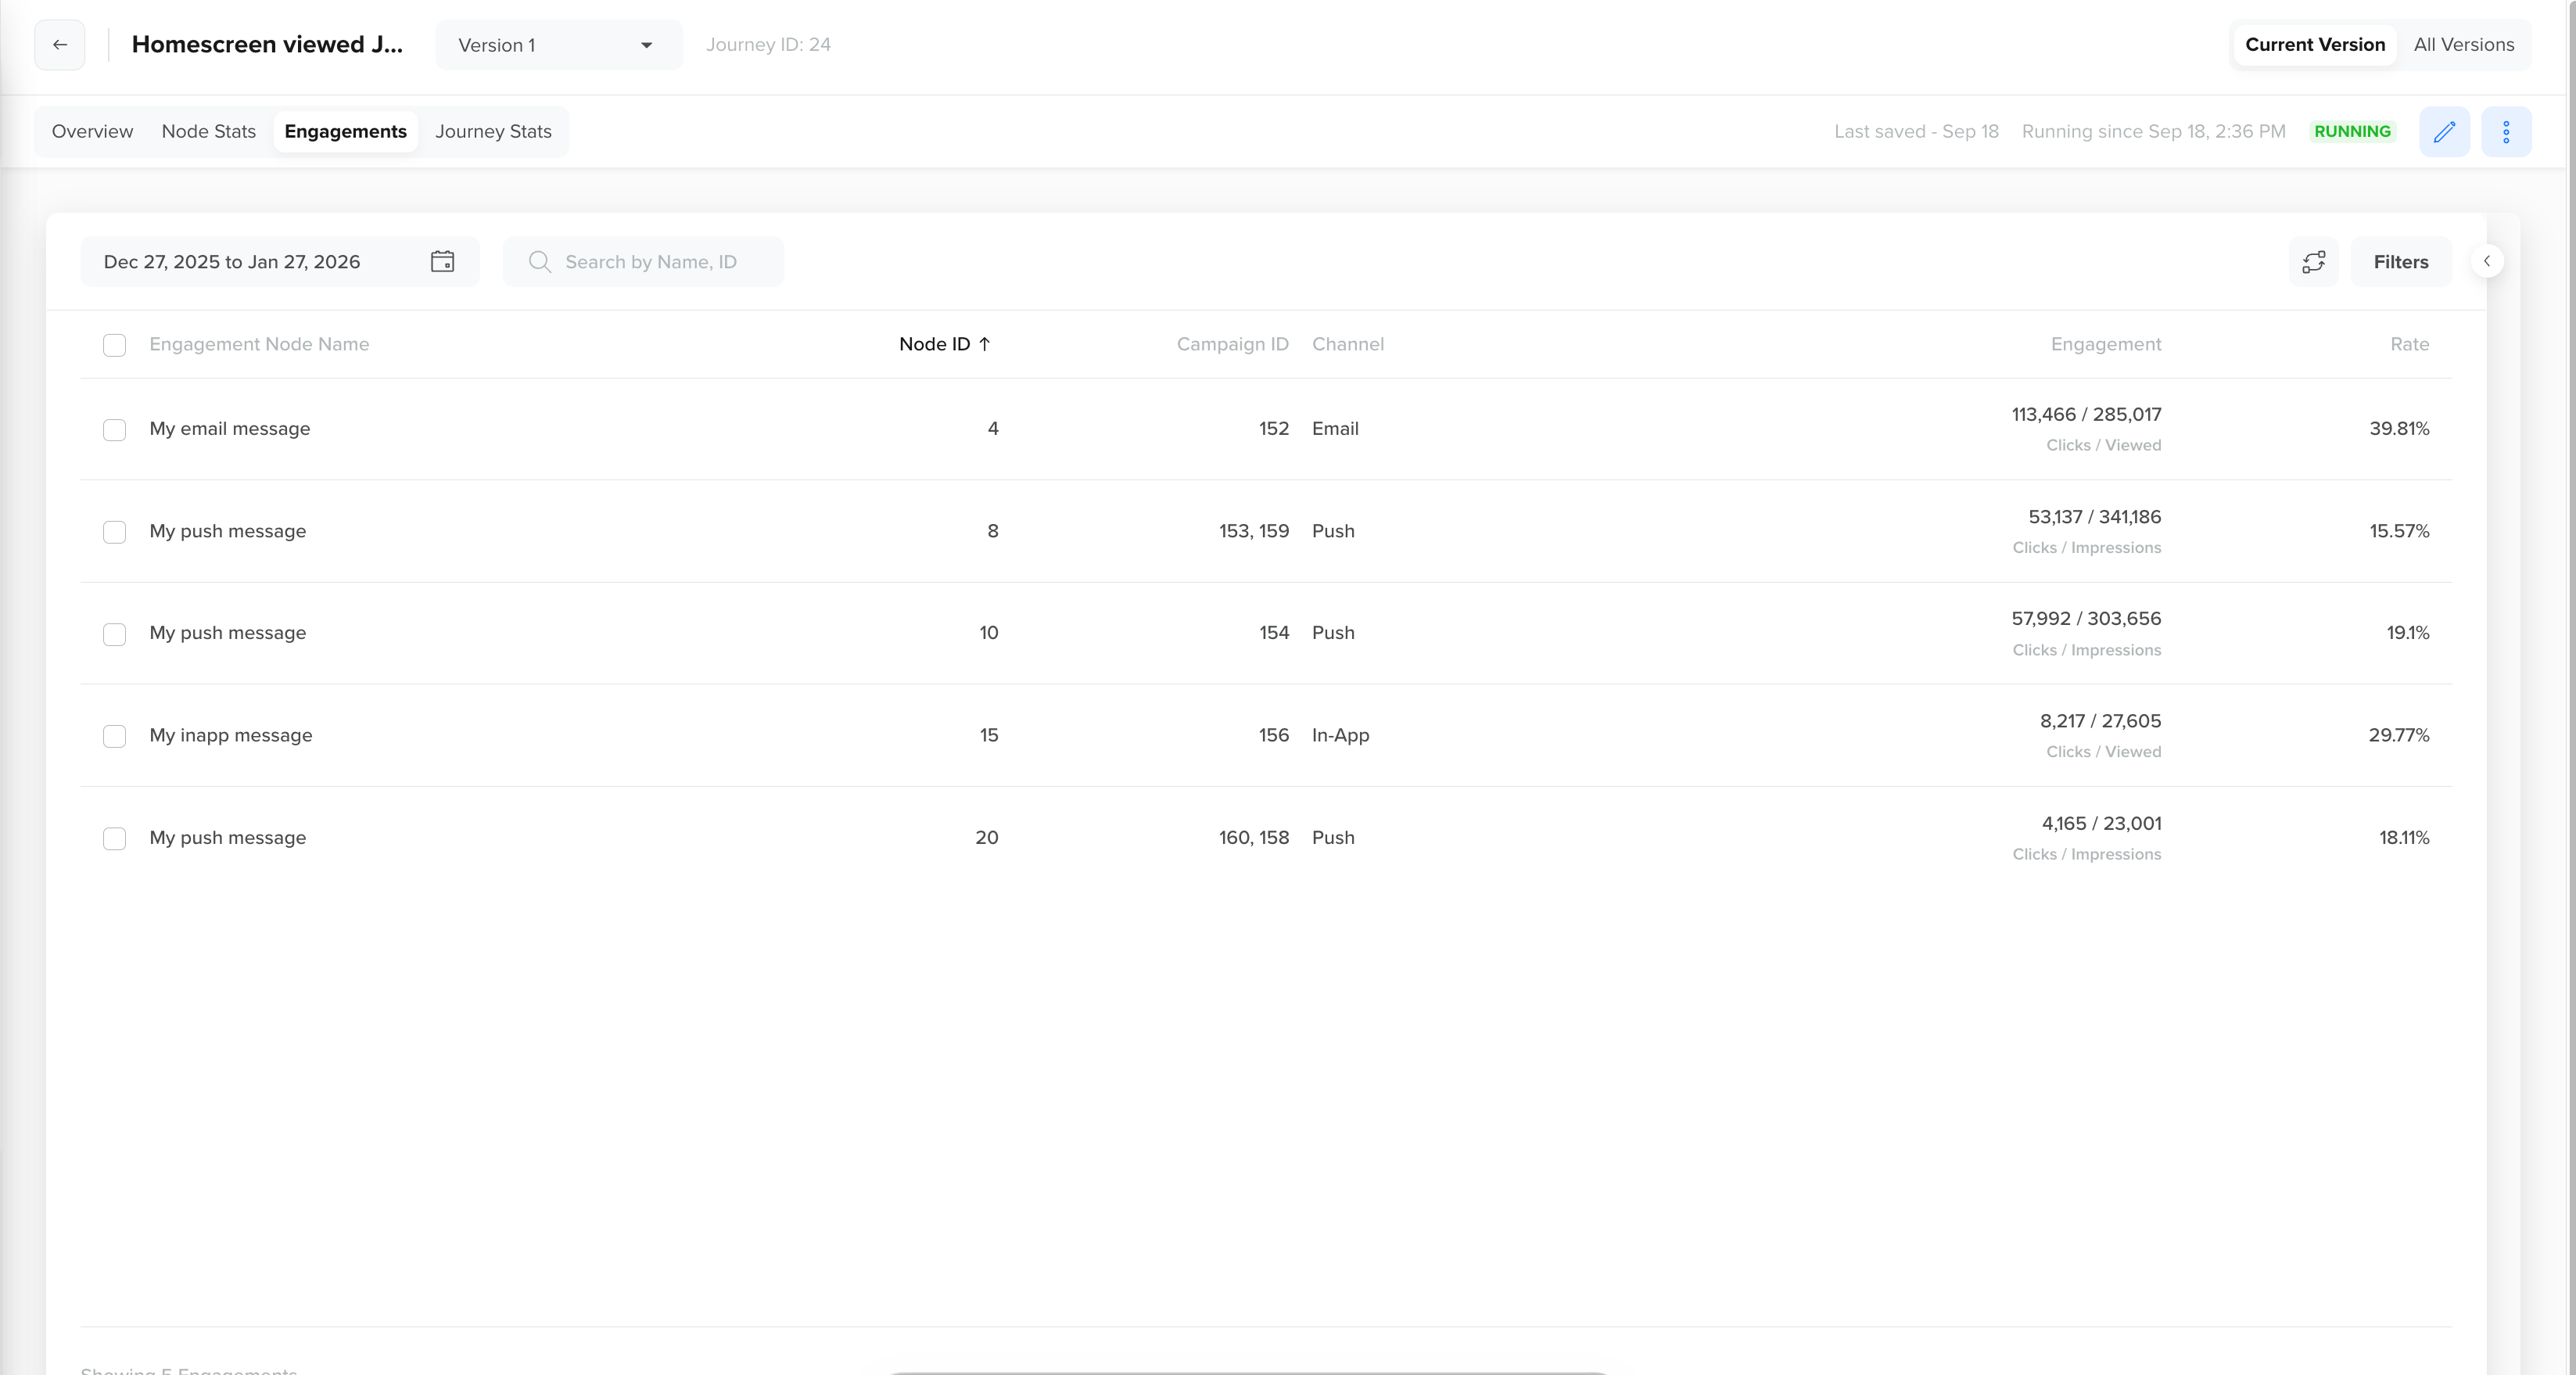
Engagement Stats
The following stats for each engagement node are displayed:
| Columns | Description |
|---|---|
| Engagement node name | Name of the engagement node. |
| Node ID | Unique identifier of the journey node. |
| Campaign ID | Identifier used to analyze the performance of an engagement node. If a node has multiple paths, multiple Campaign IDs may be shown. Analytics and reporting automatically combine stats across these IDs. |
| Channel | Type of messaging channel used. For example, SMS, Push, etc. |
| Engagement | The engagement achieved by the channel varies based on different calculation rules for each channel. |
| Rate | Rate of engagement for the node. For example, click percentage. |
| Sent | The total number of notifications sent to user devices. |
| Impressions | The total number of devices that receive the notifications. Calculated with (Impressions/Sent) * 100. Available only with CleverTap SDK 3.5.1 or later. |
| Delivered | These are the number of messages delivered to the user's device from a campaign. |
| Clicks | Number of clicks generated by the campaign and calculated as (Clicks/Sent) * 100. |
| Viewed | The number of messages viewed from the user's device. |
| Events Streamed | The count of events that were exported to Segment. |
| Webhook Streamed | Represents the total webhooks streamed to an endpoint. |
| Replied | These are the number of messages viewed from the user's device. |
| Converted users | The number of users who performed the conversion goal after receiving the campaign. |
| Goal 1 | The Journey goal. A Journey can have up to 3 goals. |
| Goal 2 | The Journey goal. A Journey can have up to 3 goals. |
| Goal 3 | The Journey goal. A Journey can have up to 3 goals. |
NoteWhen an engagement node has multiple Campaign IDs, all metrics (such as Sent, Delivered, Clicks, Engagement, and Conversion goals) represent combined data across those IDs.
You can also view the campaign stats for each engagement node by hovering over the engagement and then clicking the

Campaign Stats
Manage Engagement Stats
This section provides steps for managing engagement statistics. It describes how to filter data, search data, edit columns, set pagination, and download data as a CSV file.
Filter Engagement Stats
You can filter the engagement stats by channel. Click the Filters button in the top-right corner, then select the required channel. To clear the filter, click Reset all.
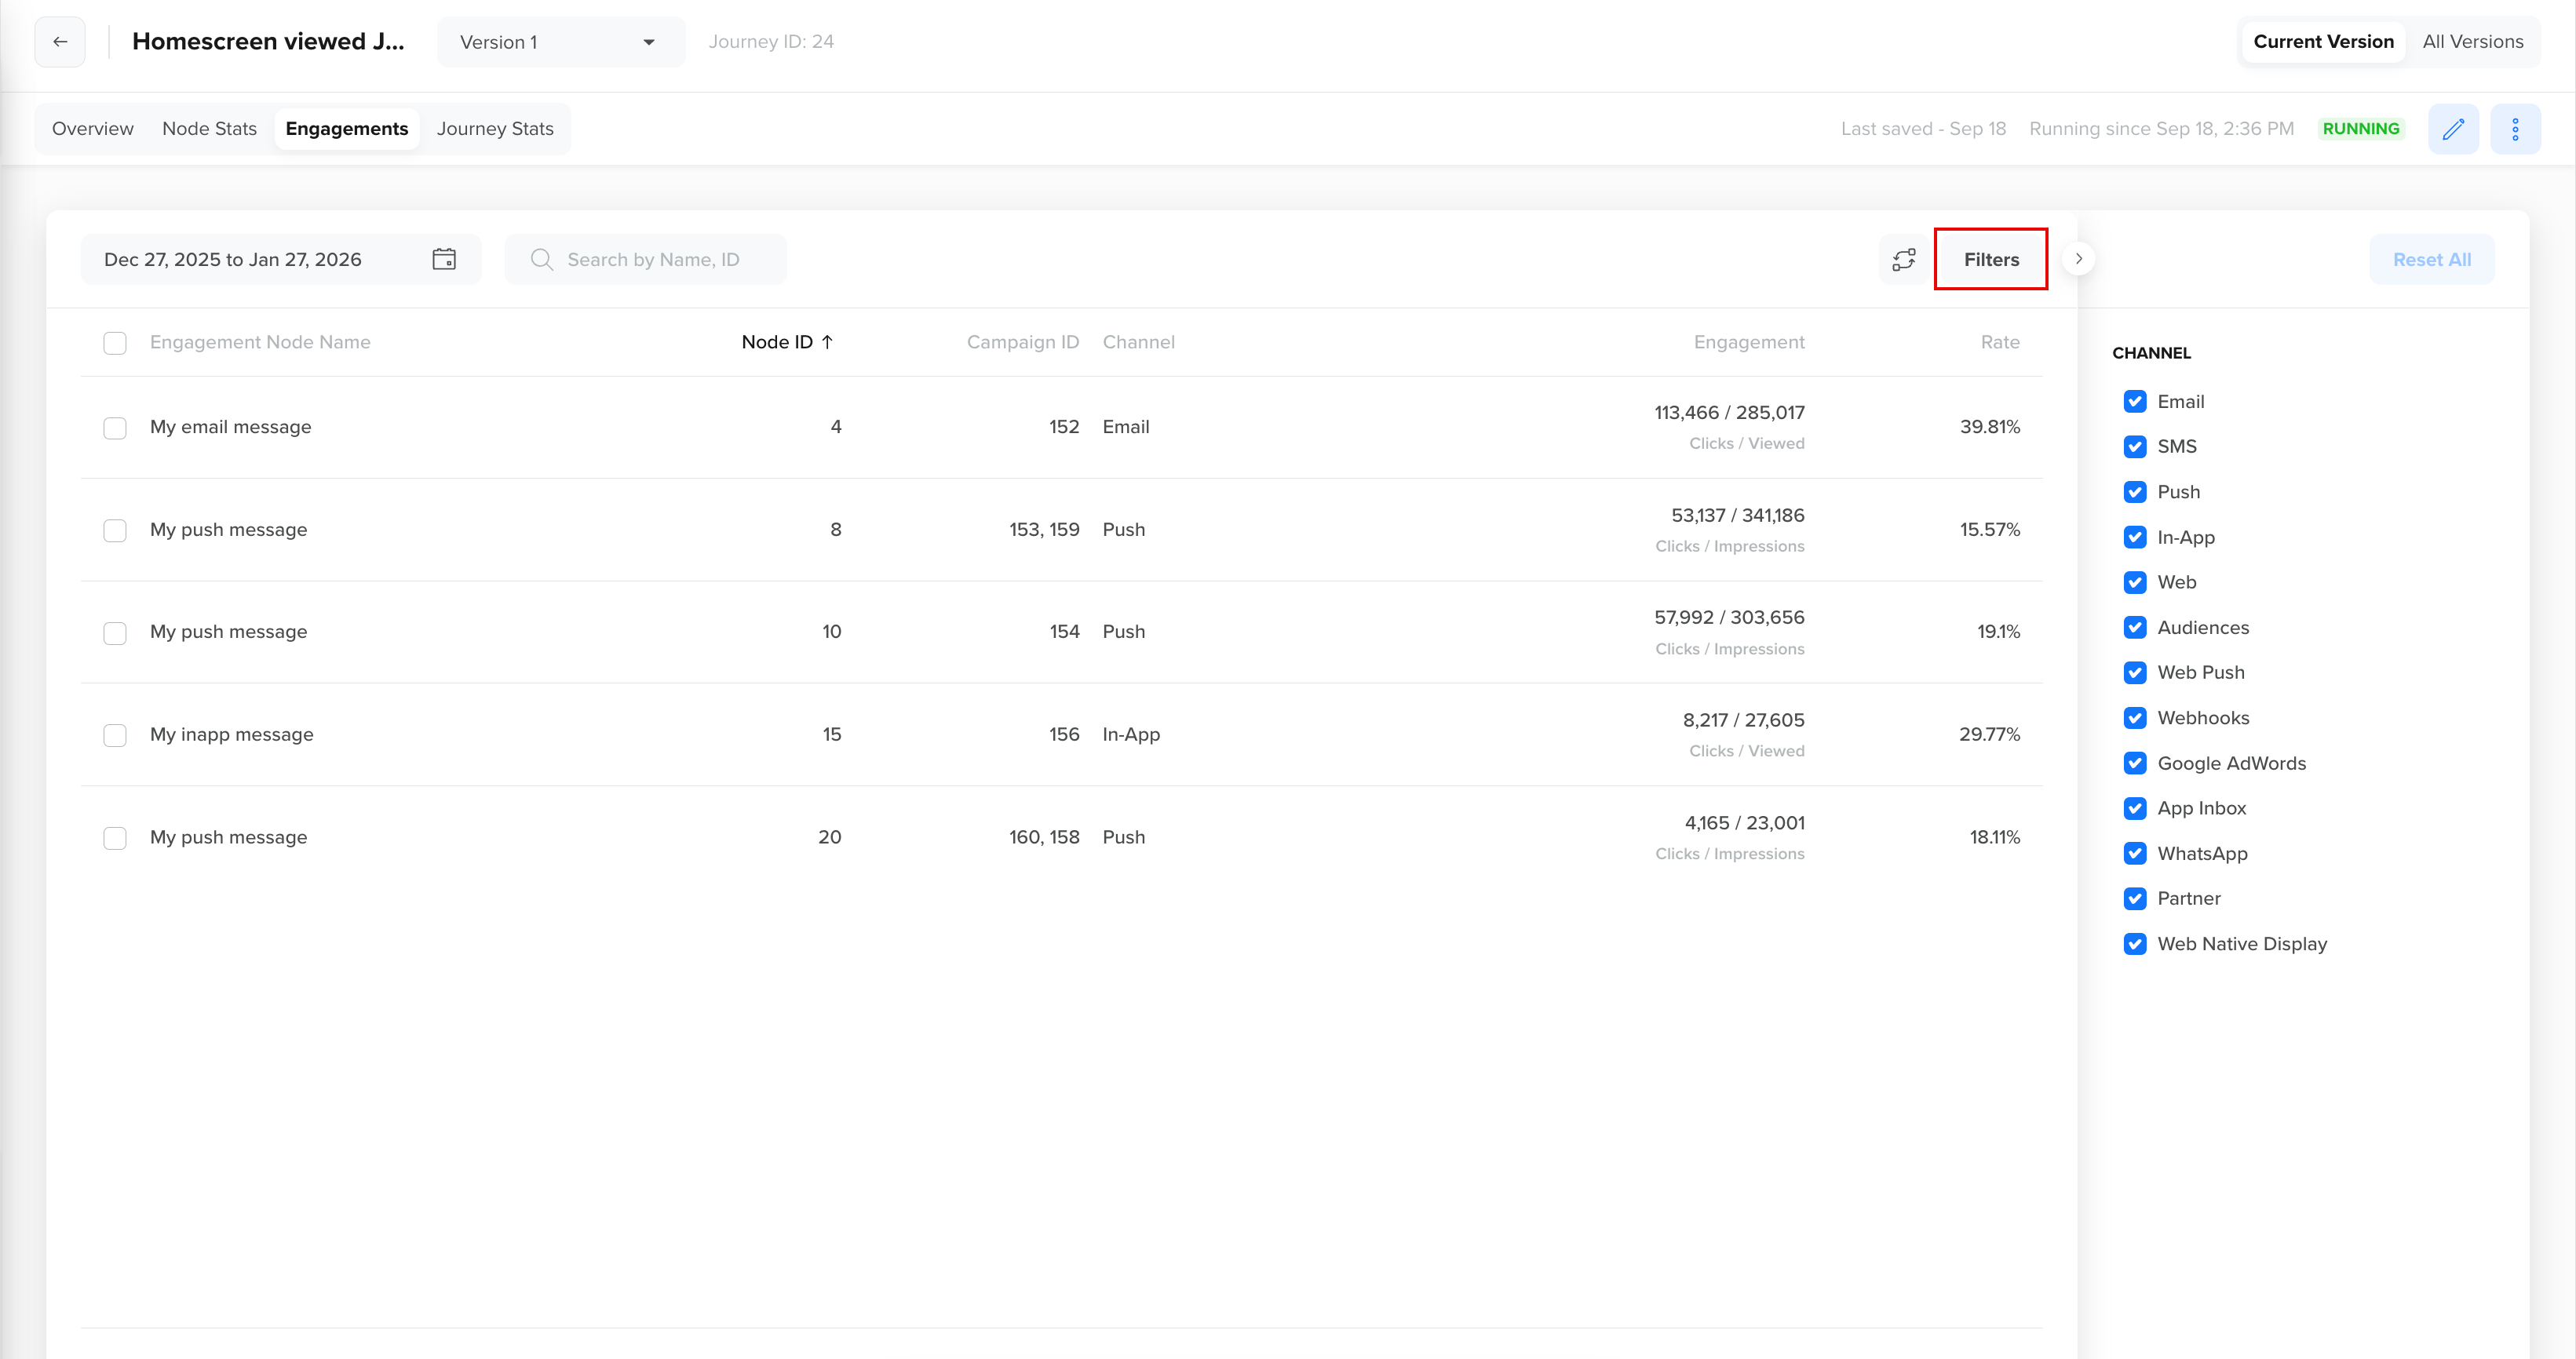
Filter Engagement Stats by Channel
Search Engagement Stats
Enter the name or the node ID to search for a particular engagement in the search box.
Search by Node ID
Edit Columns
While the table layout is fixed by default, you can still sort and filter the data to focus on the metrics that matter most. To sort and manage the engagement data effectively, perform the following steps:
- Click in the top right corner. The Edit Columns popup opens.

- Toggle ON to show the required column on the Engagements tab page.
- Drag and drop the columns to reorder them.
- Click Apply Changes.
Sort Engagement Stats Rows
Click the column header. The ↑ icon indicates that the data is sorted in ascending order. The ↓ icon indicates that the data is sorted in descending order.
Set Pagination for Engagement Stats
To choose how many items you view per page:
- Use the Items per page drop-down at the bottom of the Engagement Stats page.
- Select one of the following options: 10, 20, 30, or 40. By default, the page shows 20 stats.
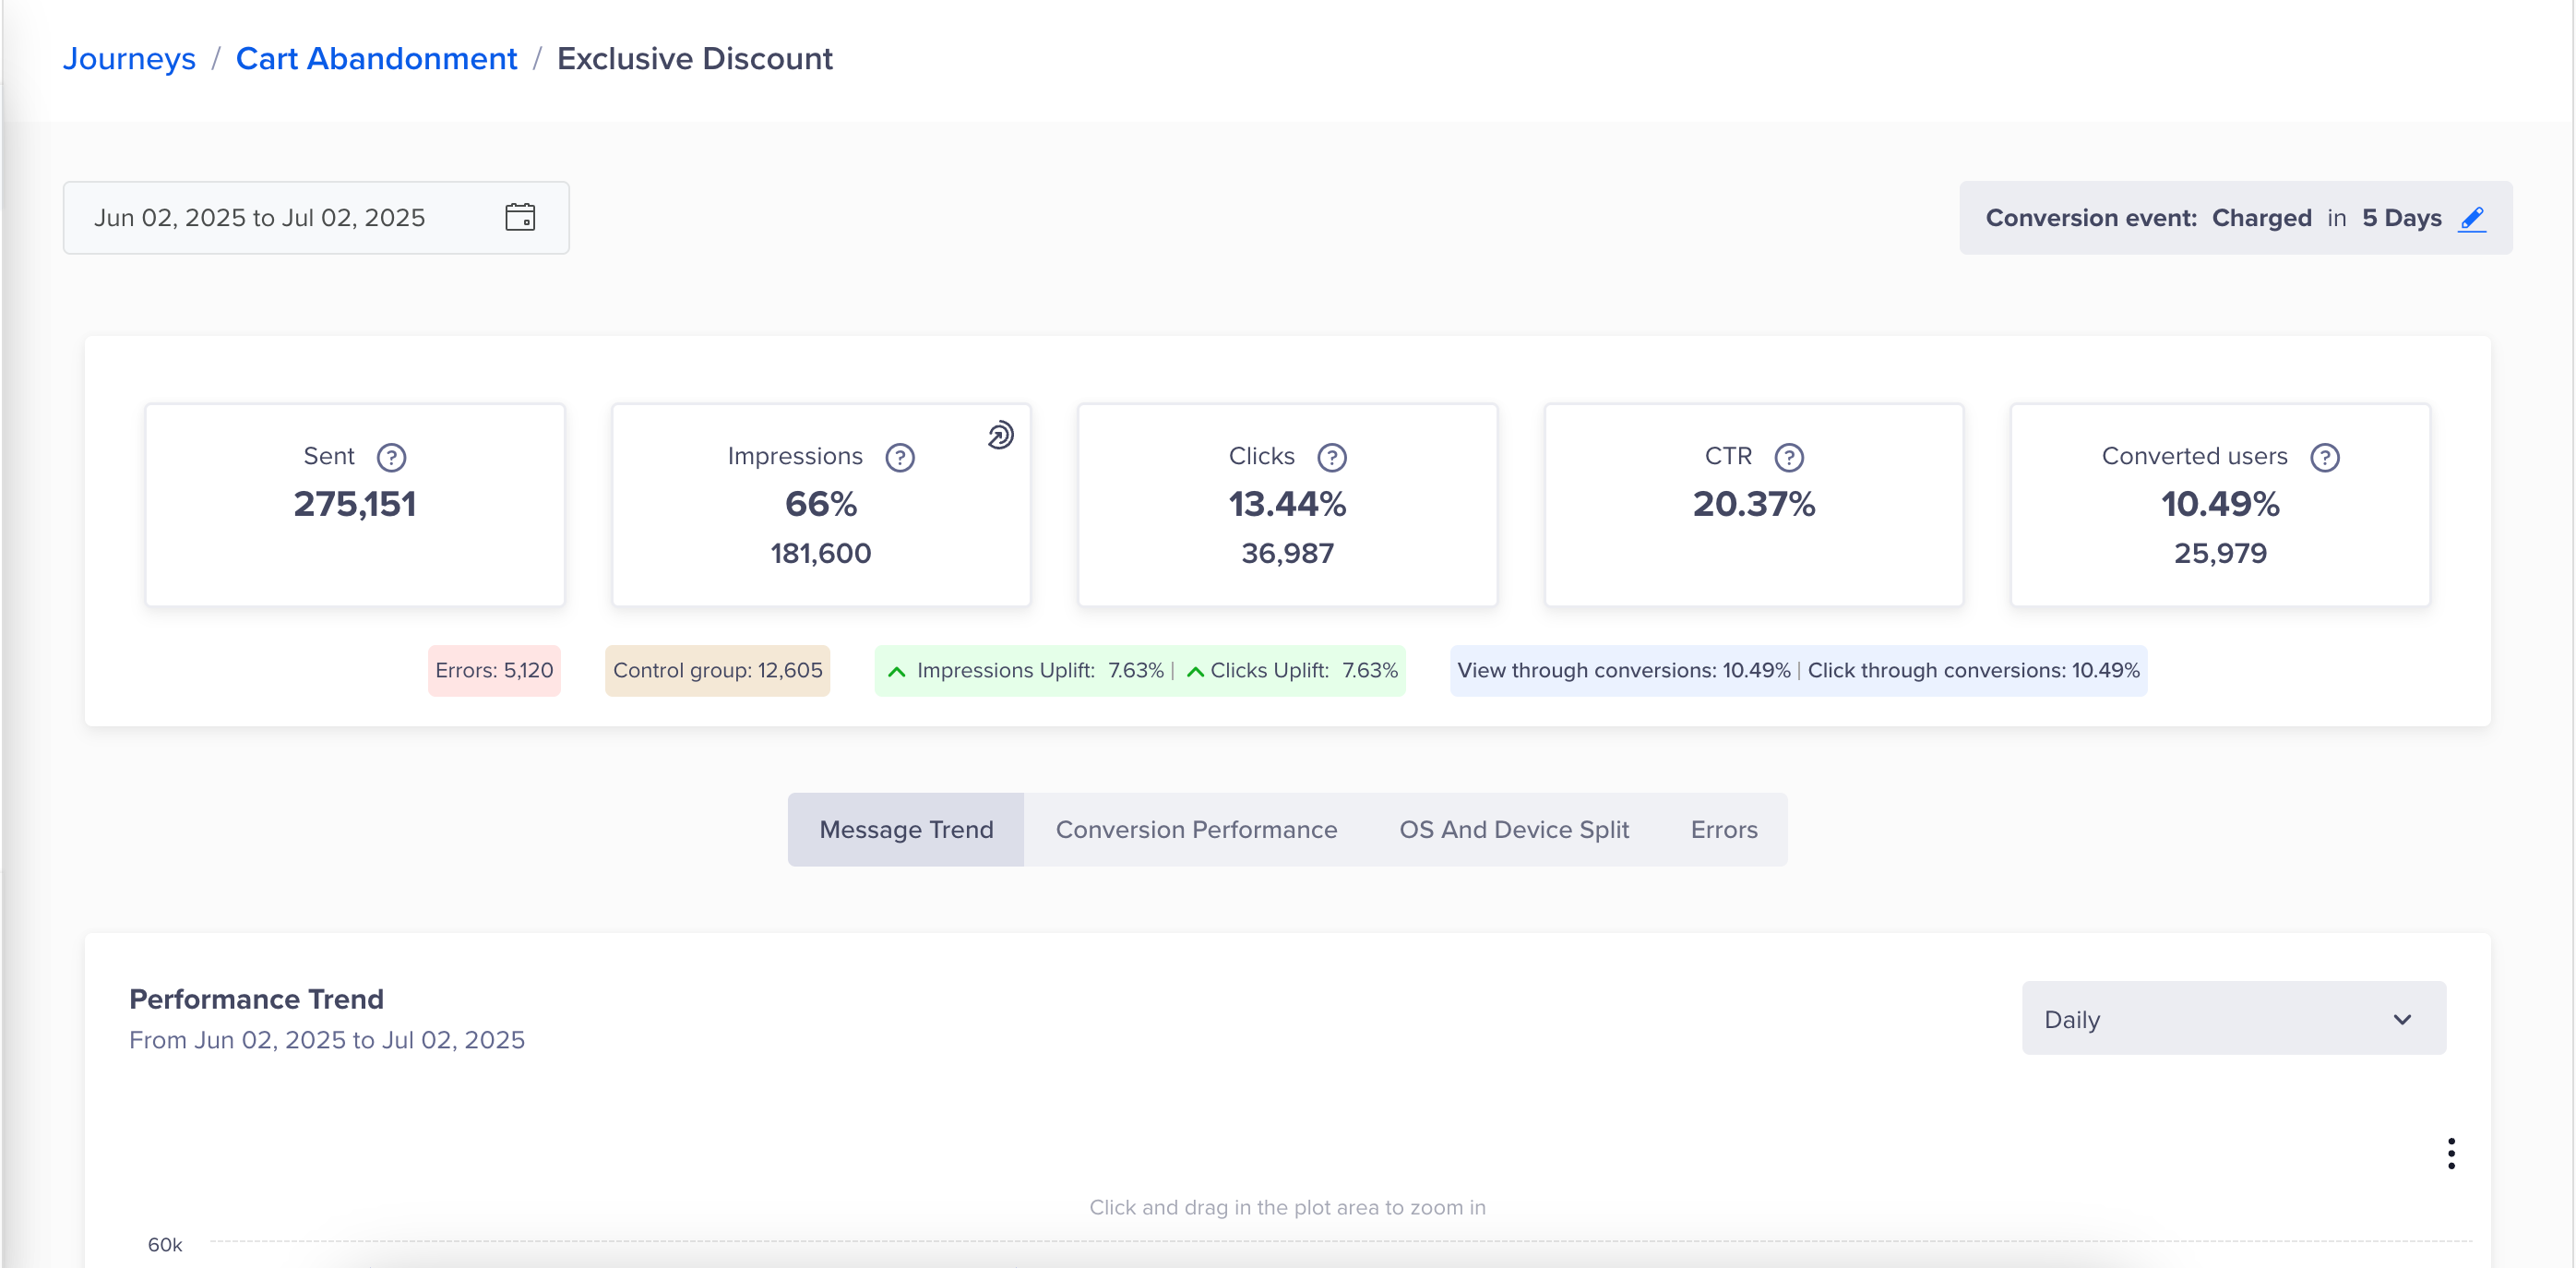
View Campaign Stats
To view the campaign stats for a channel, click


View Campaign Stats
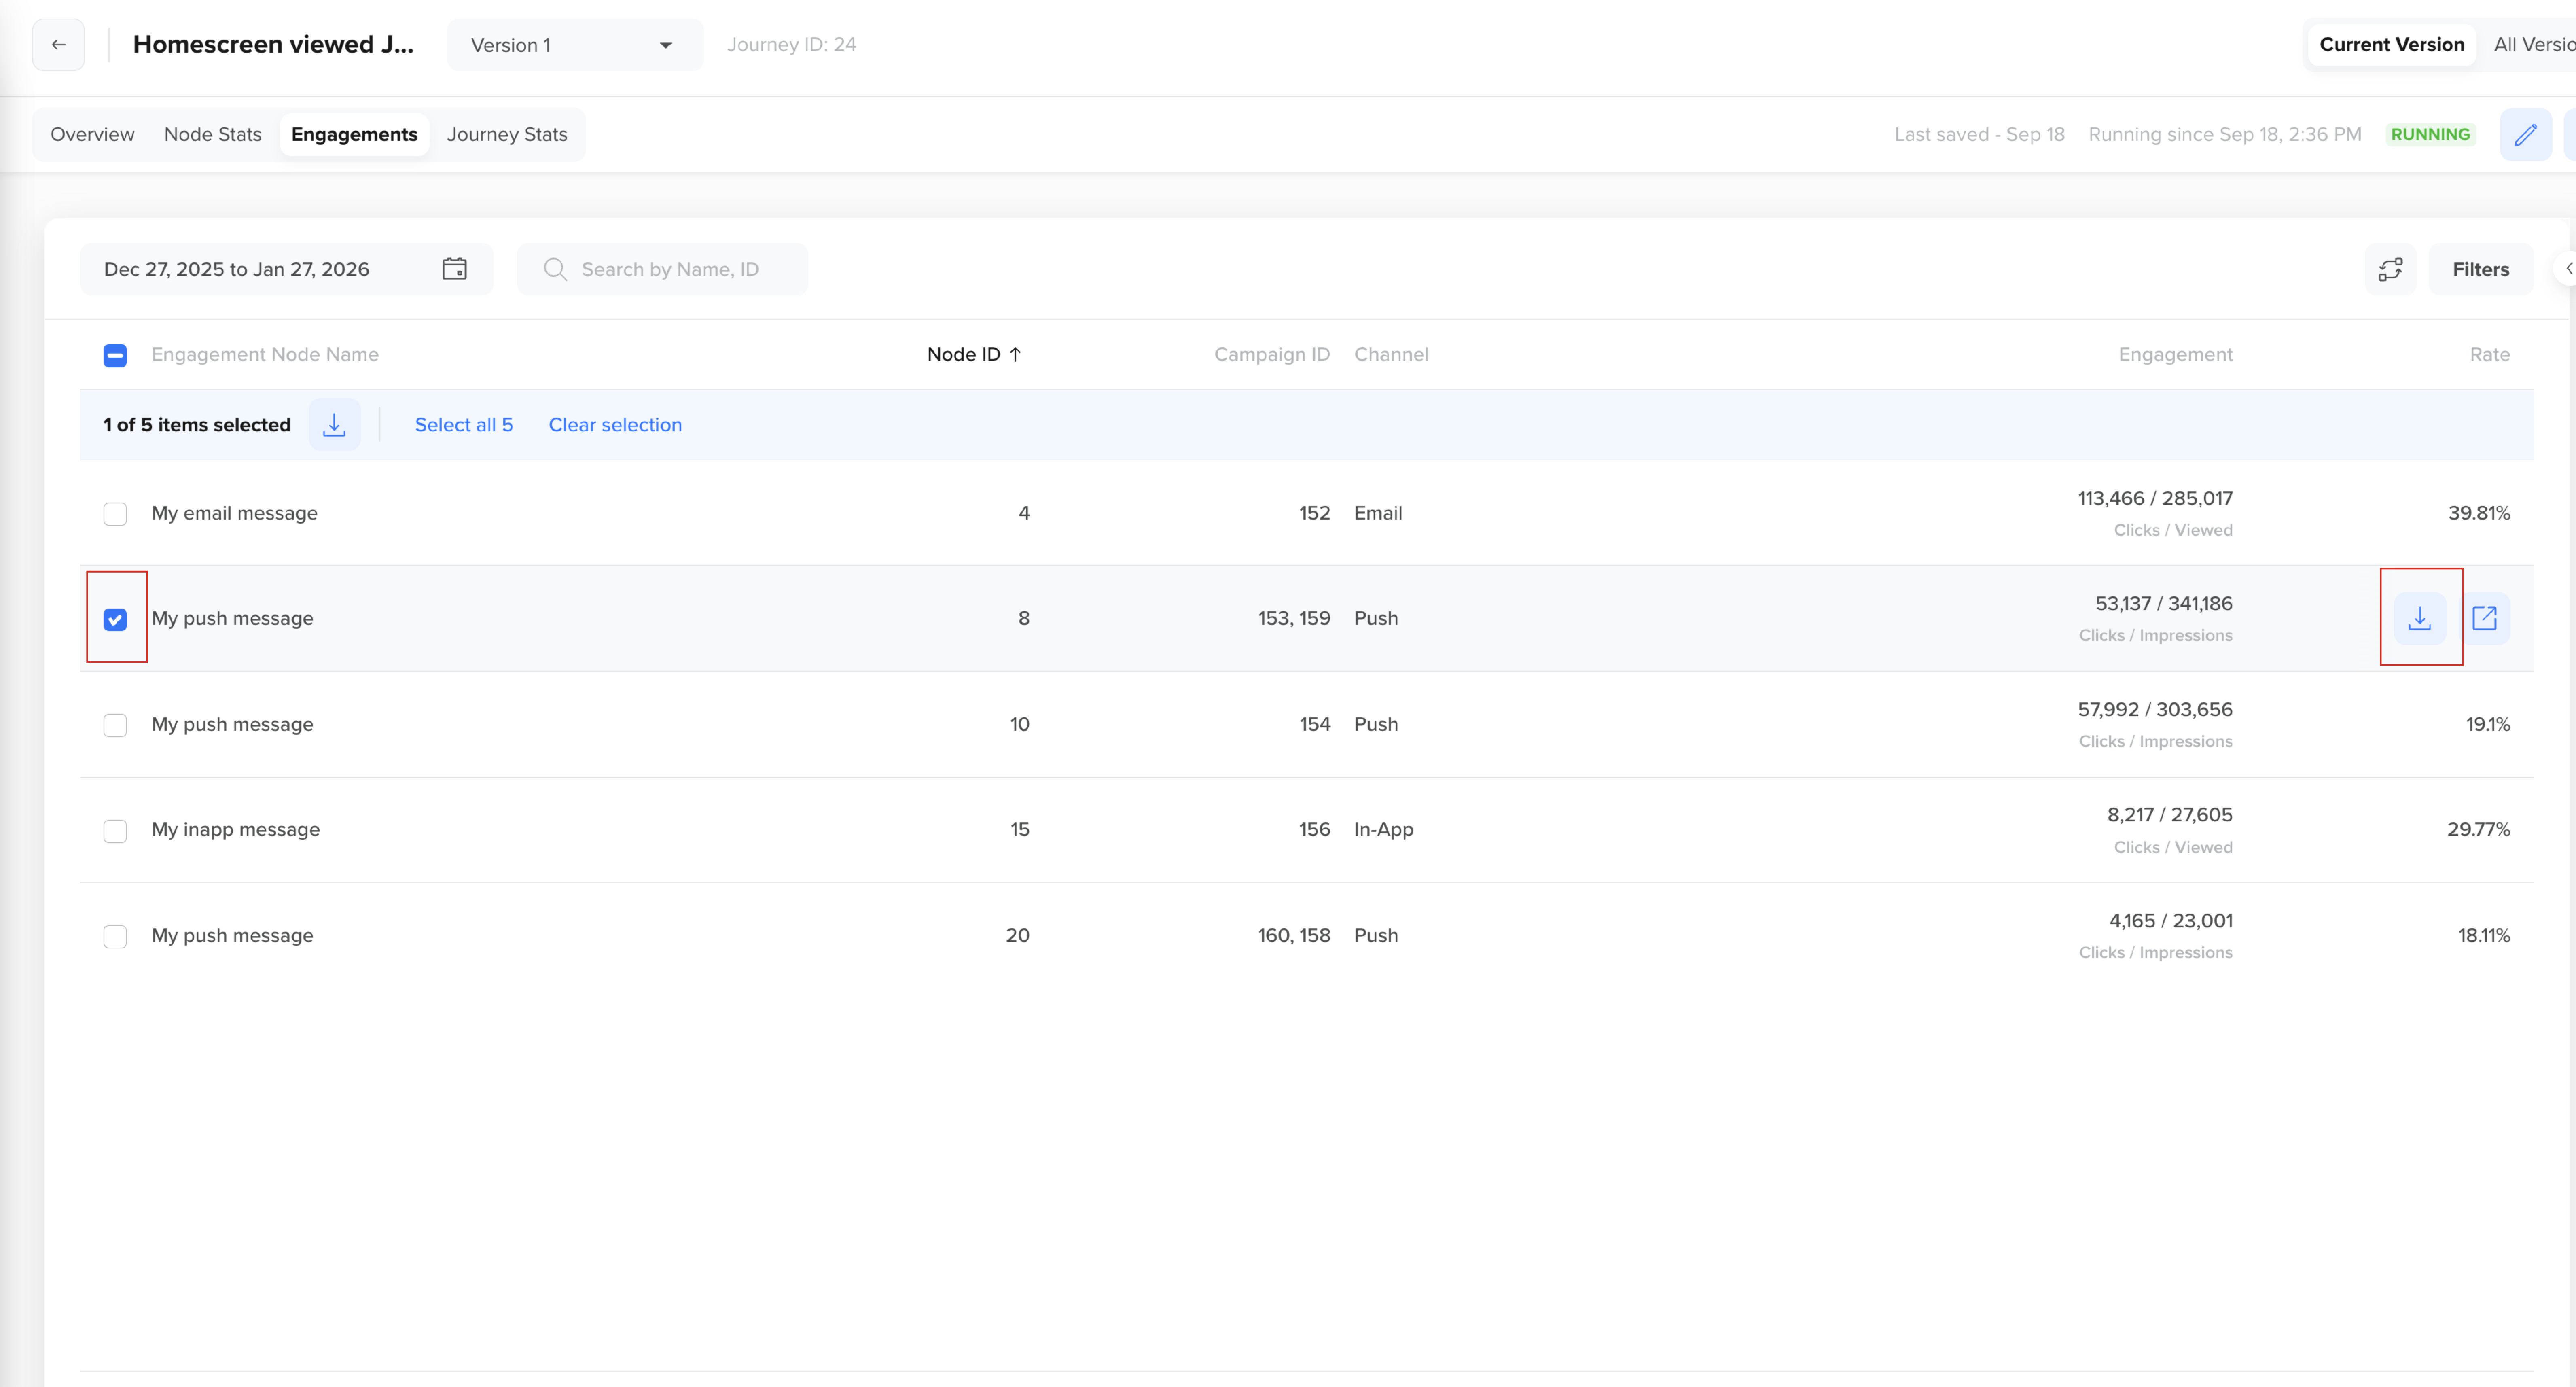
Download CSV for Engagement Stats
You can export engagement data from the Engagements tab of a Journey as a CSV file. The downloaded file includes key metrics such as Engagement Node Name, Node ID, Campaign ID, Channel, Impressions, Clicks, and Engagement Rate. This is useful for audits, offline analysis, or sharing performance reports.
To download the engagement stats CSV:
- Select the desired engagement nodes.
- Click the icon at the top of the table.

The CSV file downloads automatically. All the columns displayed on the screen are included in the CSV file.
CSV Download
For Journey engagement nodes with multiple paths, the downloaded CSV includes combined stats across all associated Campaign IDs.
Updated 6 months ago