A/B Test Results
Learn how to analyze your A/B Test results to conclude your experiments.
A/B Test Results
The A/B Test Results feature provides valuable insights from your experiments, aiding data-driven decision-making. It offers comprehensive analysis, intuitive visualization, statistical significance assessment, and variant distributed reporting. This helps users uncover insights leading to product enhancement, improved user engagement, and overall success of the A/B test.
It utilizes advanced filtration methods to ensure accurate data assessment. It includes only data captured during the user's participation in the test, excluding any data from instances where the user enters and leaves the AB test multiple times (unless the test is marked as 'Sticky'). This ensures that all the available metric data available on the Results page is clean and based on user behavior.
You can view the A/B Test Results for a particular period by selecting the time range from the Calendar widget in the top right corner. This helps segment and analyze data based on when events or observations occurred for the defined timeframe. You can view results for a short interval, such as a day, a week, or a month, or a longer span, such as a year or multiple years. You define the timeframe to analyze your A/B Test as follows:
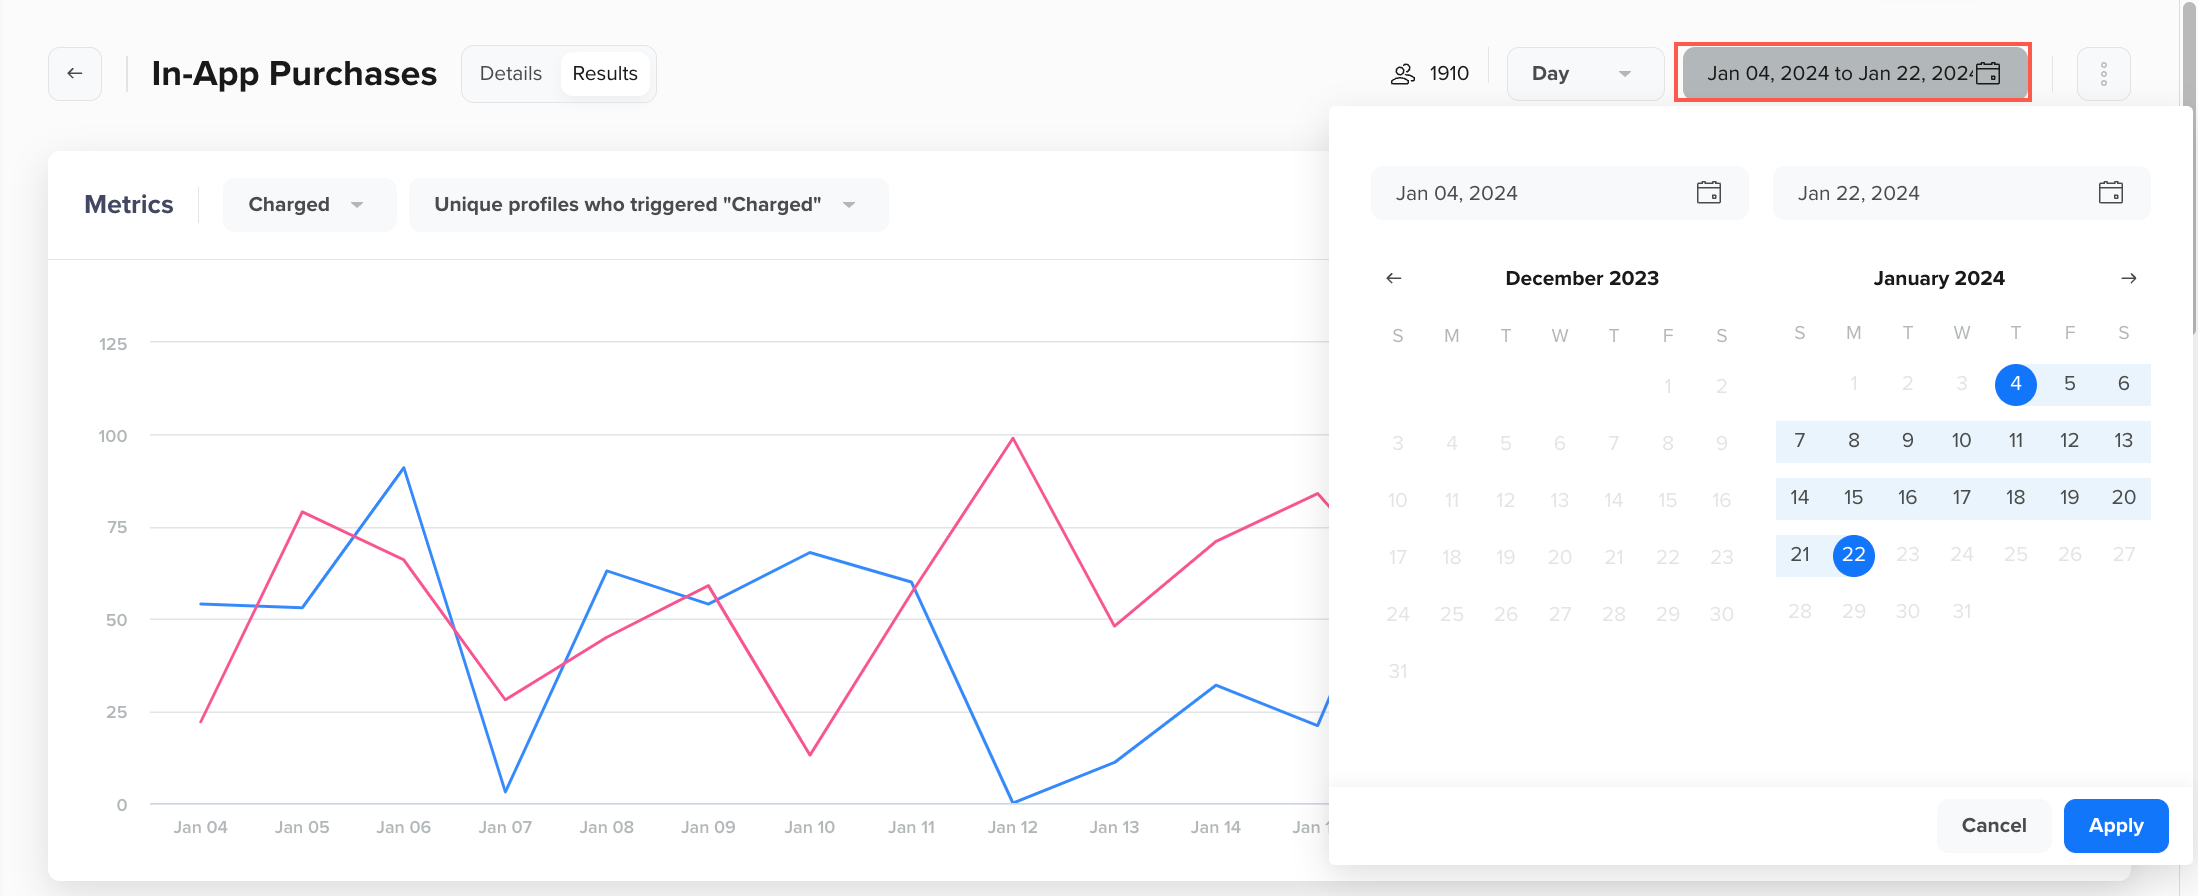
Define the Time Frame using the Calendar Widget
You can further categorize your data based on platform attributes such as Operating system) and User Properties using the Group by option (refer to the following image):
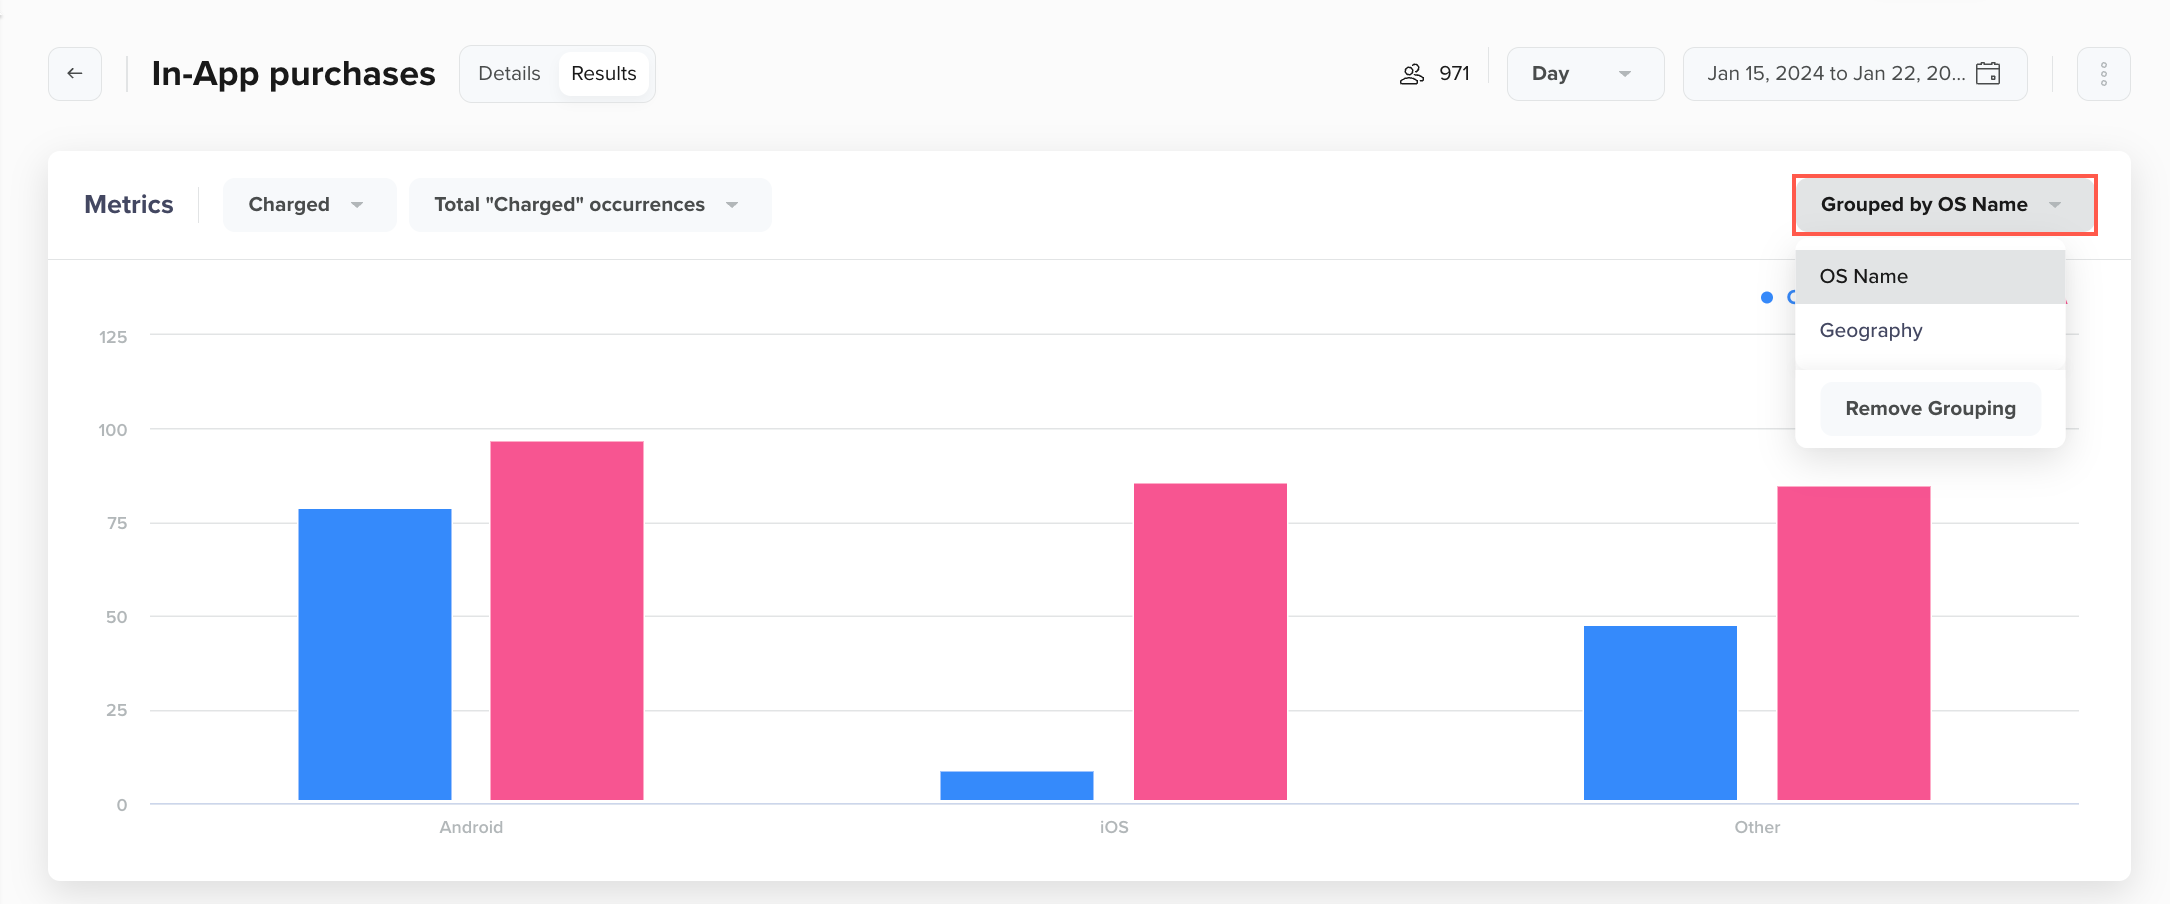
Group by OS Name
This helps in getting a granular view of users, allowing you to make data-driven decisions across distinct operating systems or users with different properties.
Also, hovering over the Users icon adjacent to the Results tab offers a high-level breakdown of actual users entering the A/B test across different Variants and the Control group (see the following image).
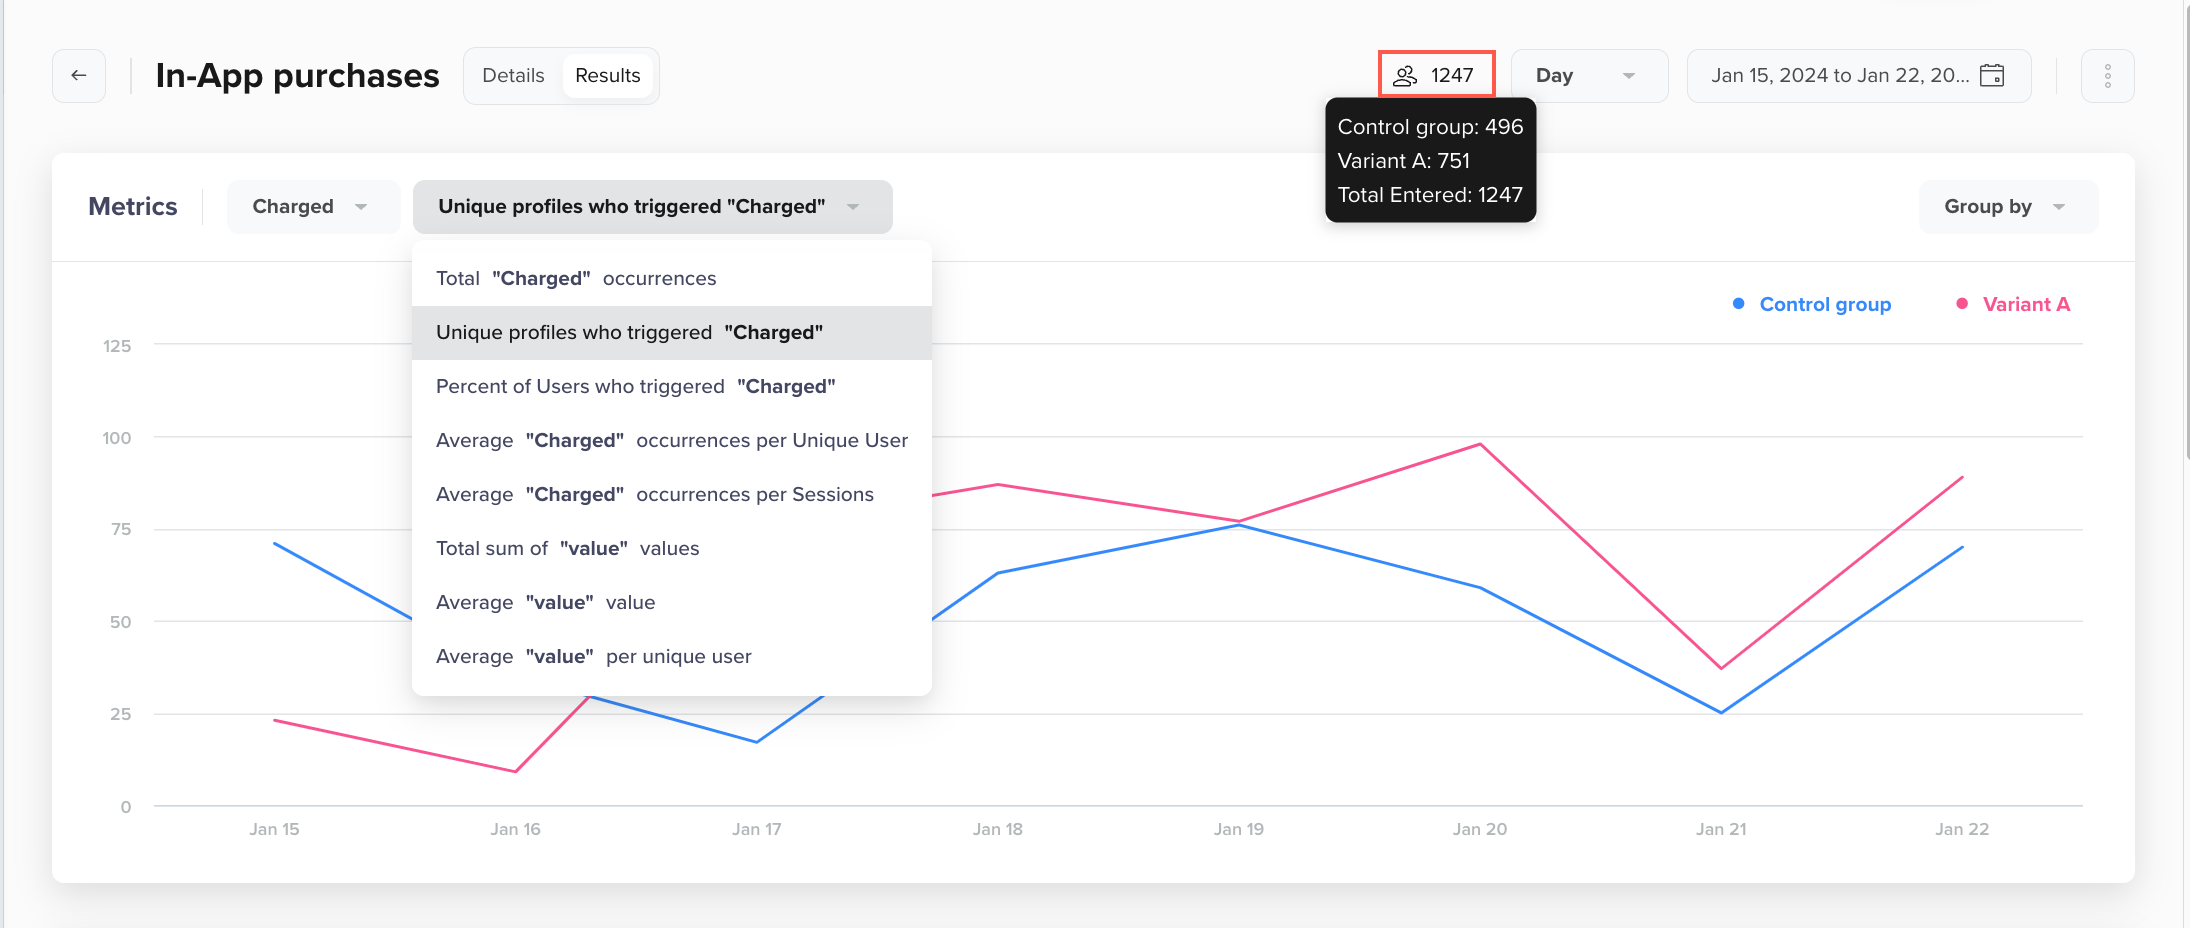
Total users entering across the variants
Now, the available metrics in the A/B test can be categorized into Common and Goal metrics.
Common Metrics
Common metrics are accessible for every A/B test, regardless of whether you have chosen specific Event-based Goals. The common metrics include:
- Unique Users: This refers to the count of individual users who have interacted with a website, application, or service during a specific period. Each user is counted only once, regardless of how often they visit or use the platform within that timeframe.
- Returning Users: This refers to the individuals who have visited or interacted with a website, application, or service more than once during a specific period. They are distinguished from Unique Users who have engaged with the platform on multiple occasions.
- First-time Users: This refers to the individuals who visit or interact with a website, application, or service for the first time during a specific period. These users are new to the platform and have not engaged with it before within the defined timeframe.
- Sessions: This refers to the individual visits or interactions a user has with a website, application, or service during a particular timeframe. A session starts when a user accesses the app and ends after a period of inactivity or when the user leaves the app.
Tracking sessions are a great way to measure engagement for certain apps, such as video or music streaming, news, etc. You must enable session tracking from the CleverTap dashboard to track user sessions. To enable session tracking, navigate to Settings > Session analytics and toggle ON the session tracking.
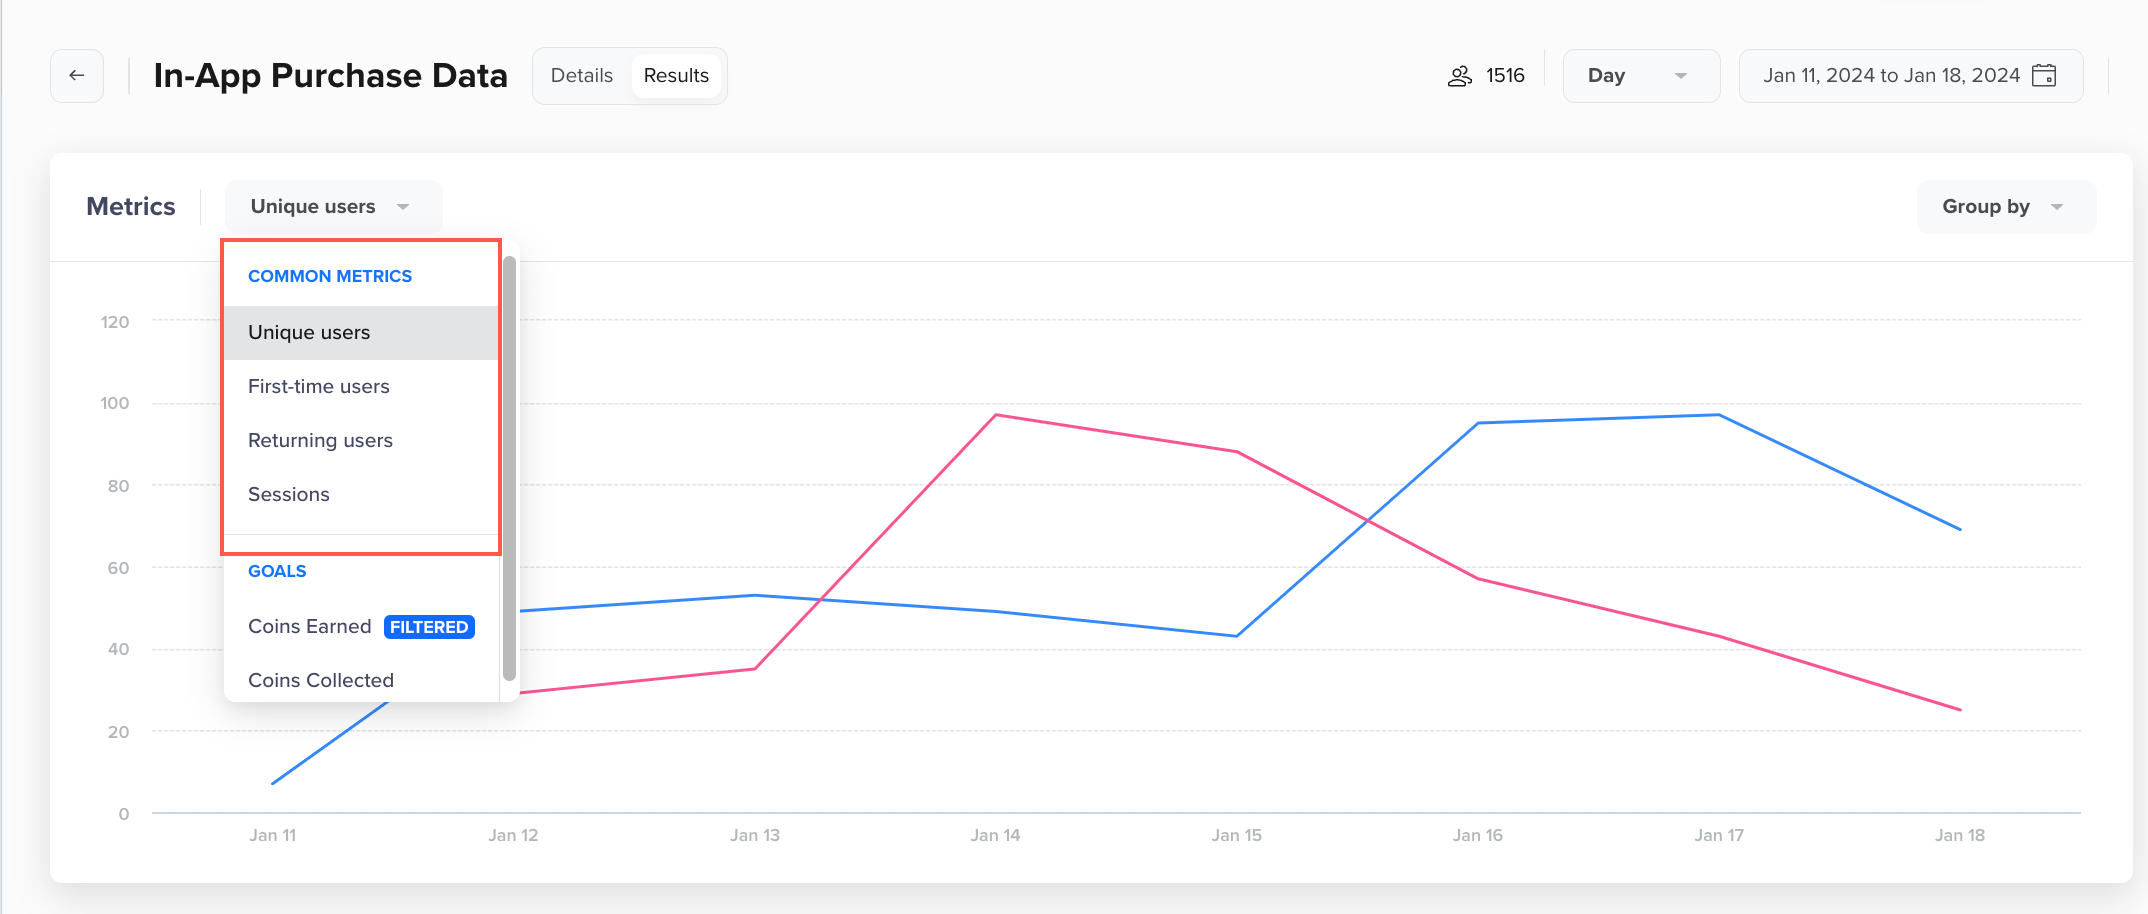
Common Metrics View
Listed below are some key session metrics, along with their formulas and definitions:
| Metric | Formula | Definition |
|---|---|---|
| Returning Users | 100 x [(Total Unique Users) - (Total First-time users)] / (Total Unique Users) | The percentage of users returning to your application or website. |
| Total Sessions | Total occurrences of "Session Concluded" event | The total number of user sessions. |
| Total Session Length | Sum of values for the event property length of the Session Concluded event | Calculated using the event property length of the Session Concluded event. The total length of all sessions. |
| Average Session Length | (Total Session Length) / (Total Sessions ) | The average length of a session. |
| Average Session Length per User | (Total Session Length) / (Total Unique Users ) | The average length of a user session in your application/website. |
| Average Sessions per User | (Total Session ) / (Total Unique Users ) | The average number of sessions for a user. |
Goal metrics
Goal metrics are specific to the event and properties selected in the A/B test Goals. You can find these from the Metrics dropdown on the left.
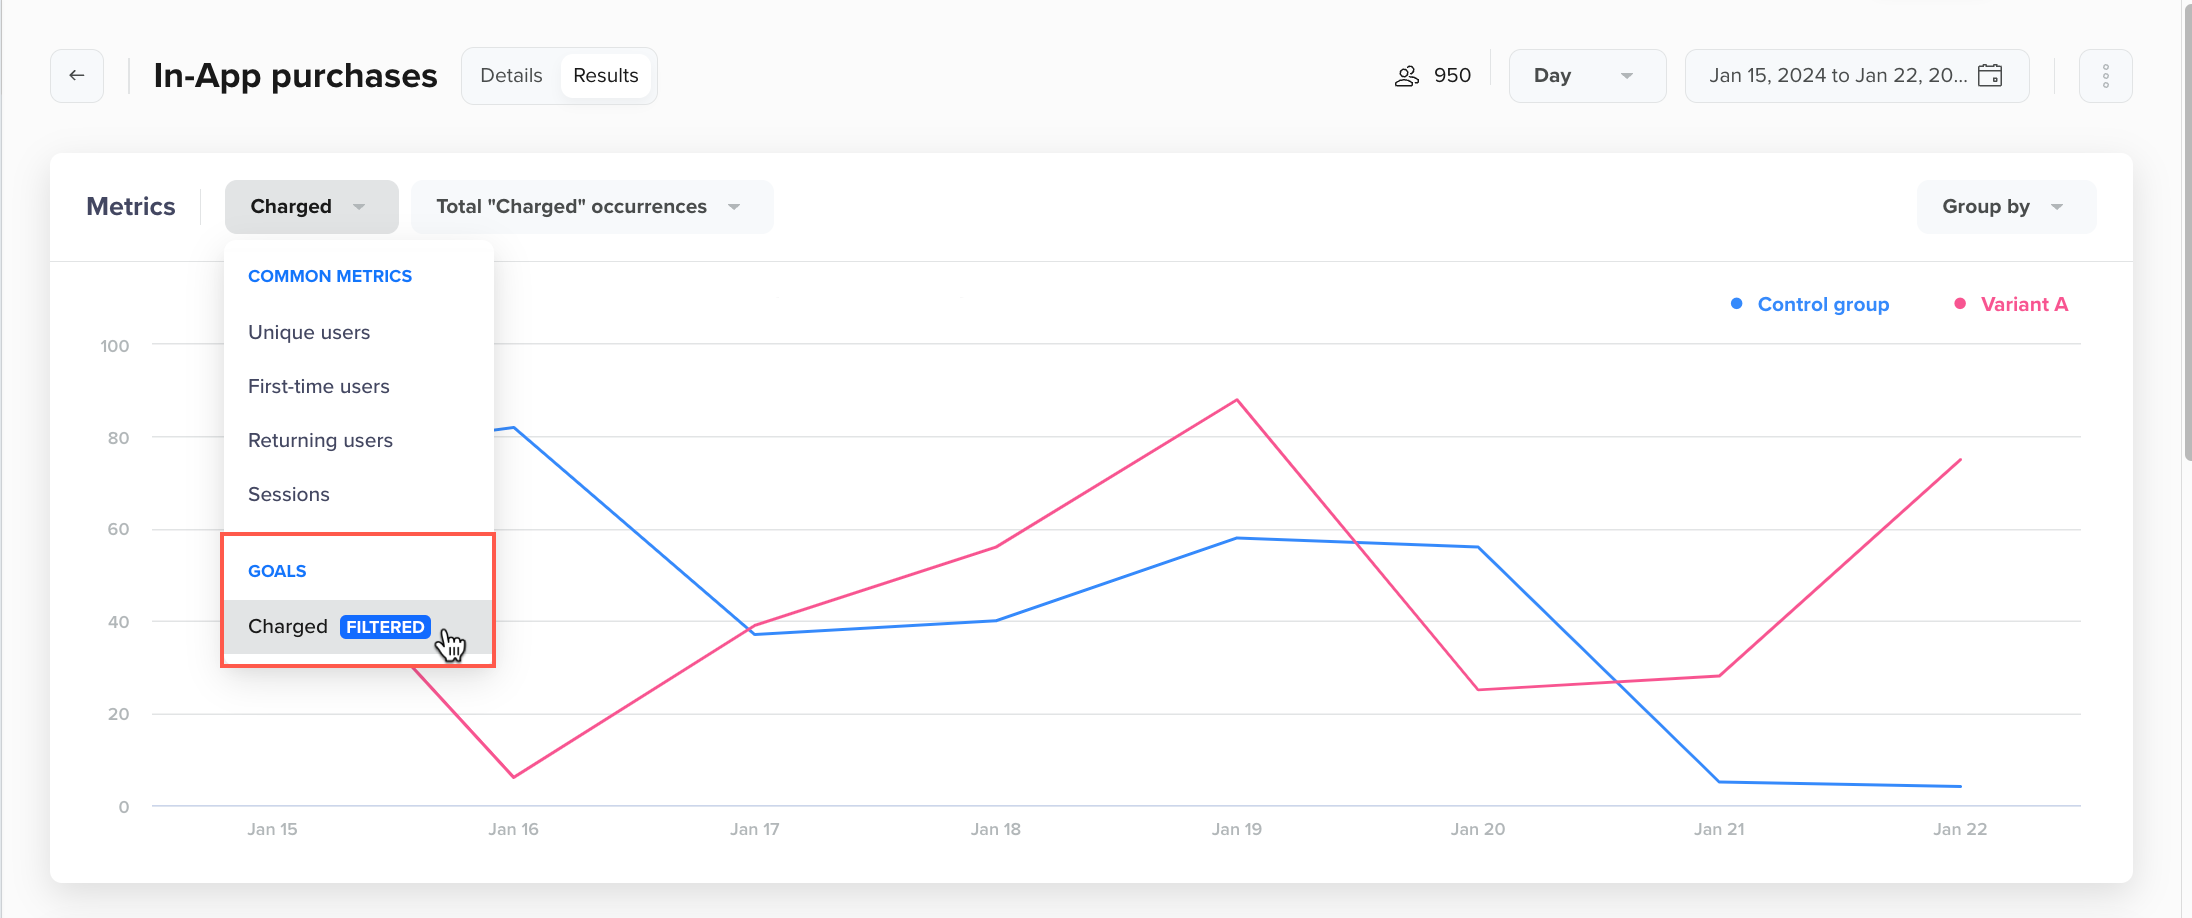
Goal Metrics
Listed below are some key goal metrics, along with their formulas and definitions:
| Metric | Formula | Definition |
|---|---|---|
| Total <Goal event> occurrences | Total occurrences of <Goal event> | The total number of times the goal event was triggered. |
| Unique profile who triggered <Goal event> | Number of Users who triggered <Goal event> | Total number of users who triggered the goal event. |
| Percent of Users who triggered <Goal Event> | Percent of users who triggered the <Goal Event> = 100 x [(Users Who Triggered X Event) / (Total Users)] | The percentage of users in your app that triggered the goal event. |
| Average occurrences of <Goal event> per Unique User | (Total occurrences of <GoalEvent> / Total Unique Users) | The average number of times a user triggers this event. |
| Average occurrences of <Goal event> per Session | (Total occurrences of <GoalEvent> / Total Sessions) | The average number of times the goal event is triggered in a session. |
| Total sum of <Event Property> values | (Total sum of <Event Property> values) | Total sum of all aggregate event property values associated with the goal event. |
| Average of <Event Property> values | (Total sum of <Event Property> values / Total Event occurrences) | The average value of each occurrence of this event. |
| Average of <Event Property> values per unique user | (Total sum of <Event Property> values / Unique Users) | The average of <Event Property> values of the goal event per user. |
After you select the event metric of your choice from the dropdown, you can view its data in graphical and tabular format. Let us consider a sample test where an e-commerce business wants to analyze the sales. In this case, you add an event Charged as a Goal with aggregate property value. The following image shows the set of available metrics for the Charged event:
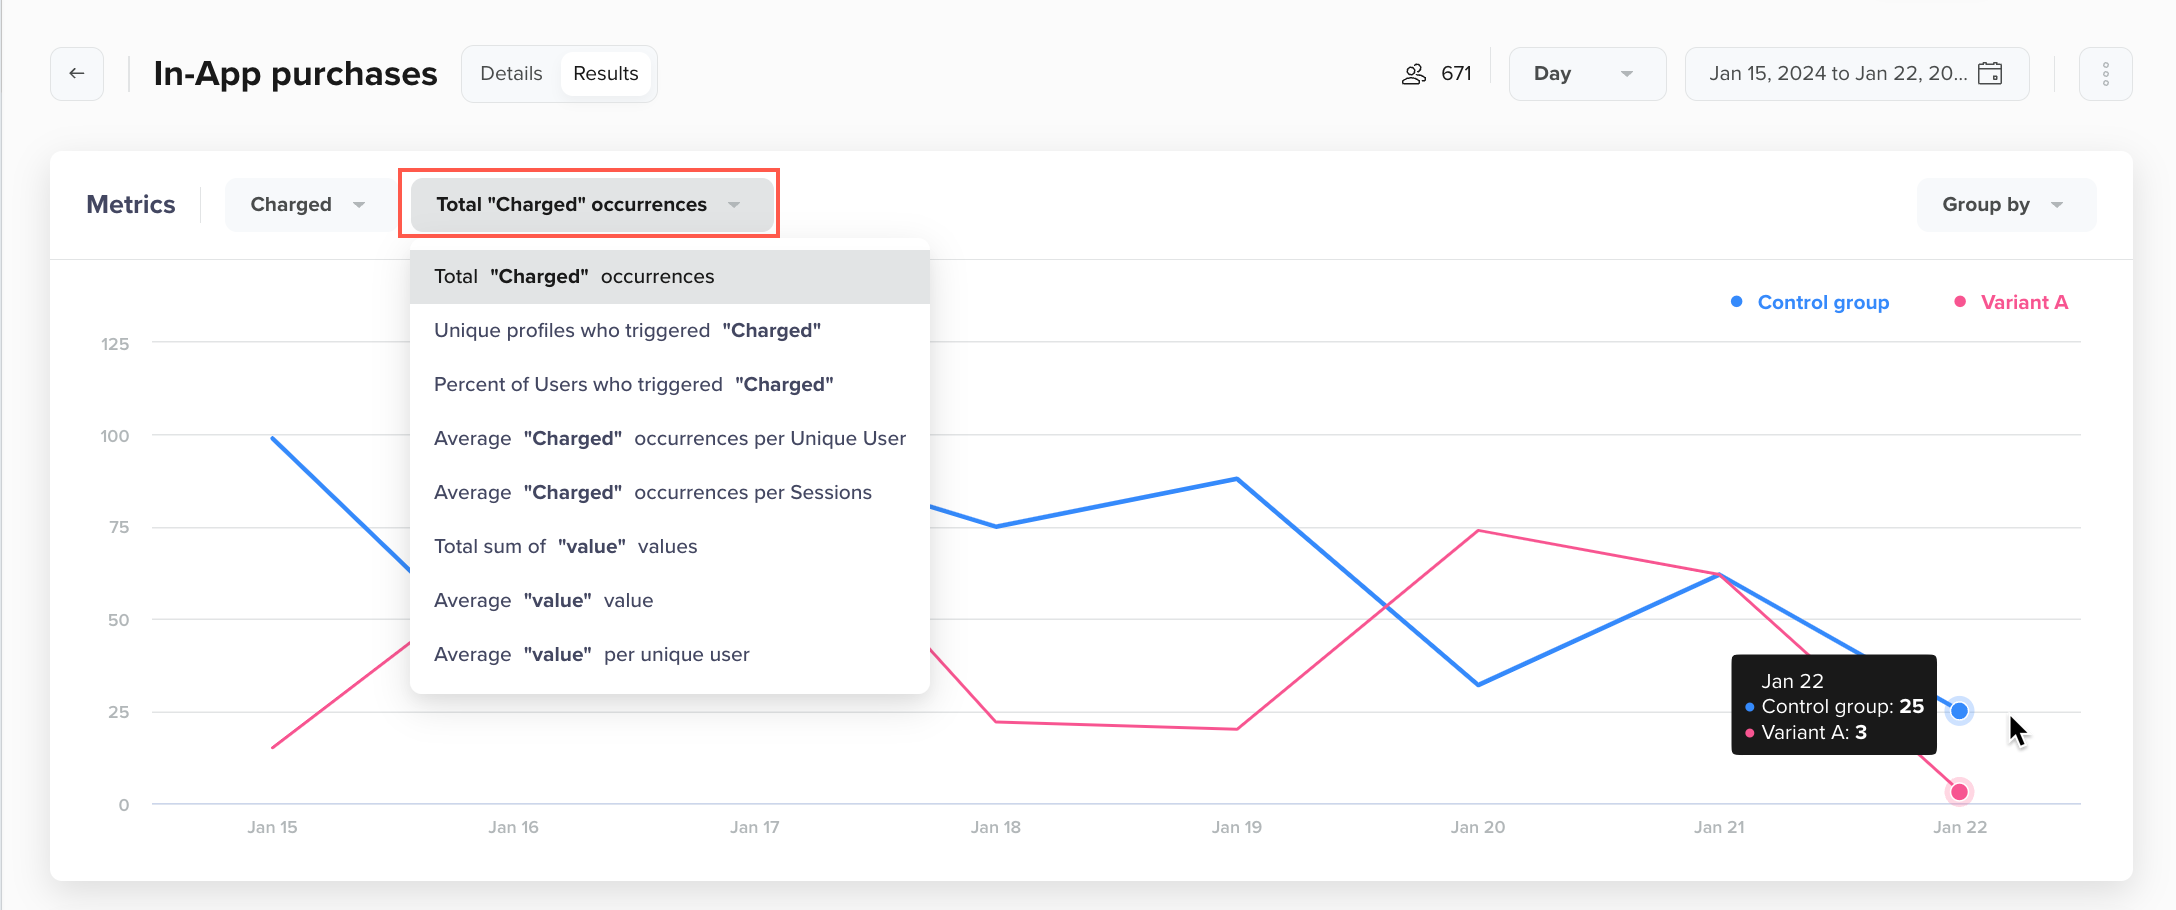
Graphical Data View of Charged Event
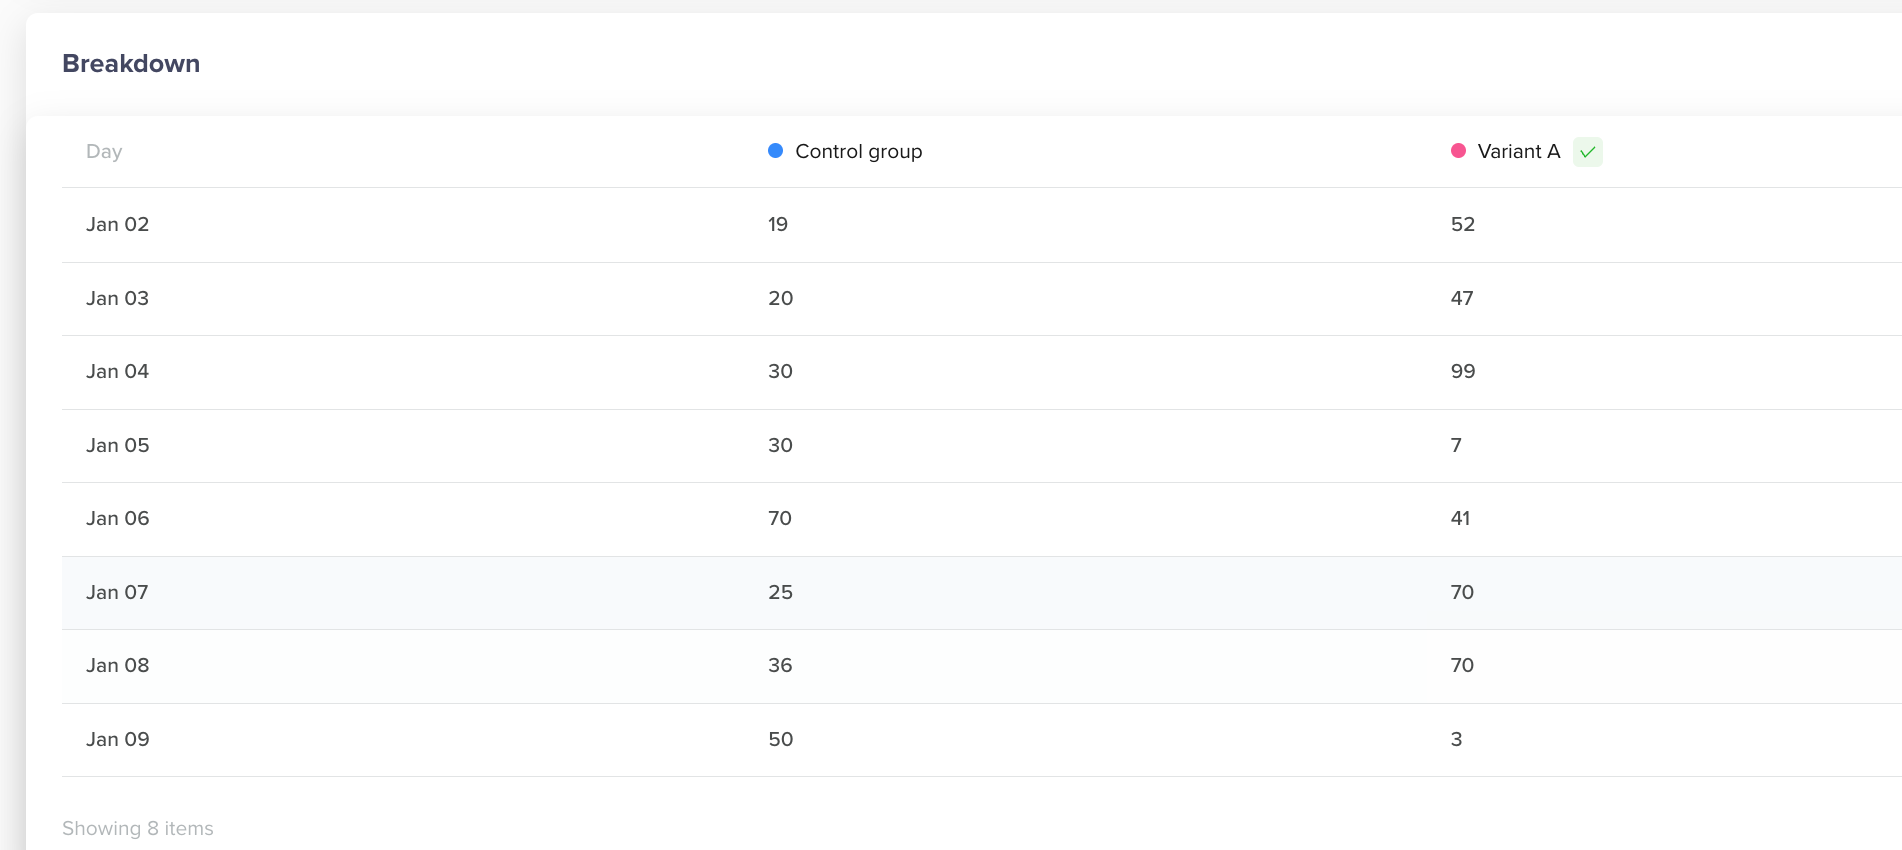
Tabular data view for the Charged Event
All Time Performance
For a limited set of metrics (Percent of users who triggered the <Event>), you can see the All Time Performance section.
This feature calculates data throughout the entire duration of the A/B Test, irrespective of the time frame selected at the top of the page. Based on all the data, each variant is analyzed to identify if it is statistically significant, and an indicator is displayed next to the variants that helps:
- Validate the reliability of the results.
- Assess whether any observed differences between the control and variant groups are not merely attributable to random chance.
- Provides you confidence in the decision-making process.
NoteCleverTap uses a two-tailed Welch's t-test with a default setting of 95% confidence interval to identify the statistically significant variant.
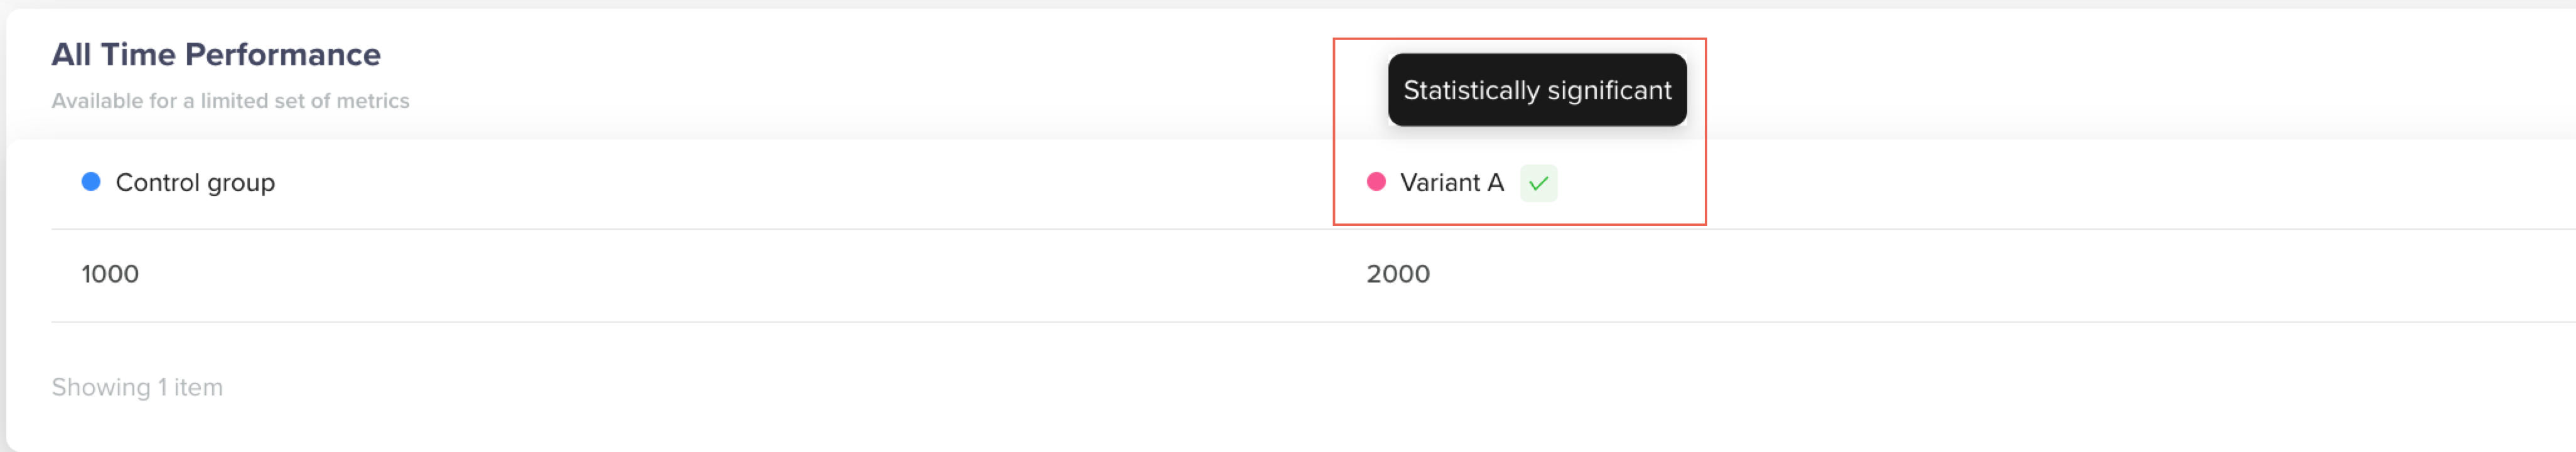
All Time Performance Section for a Limited Set of Metrics
Export A/B Test Results
You can export A/B test results from the CleverTap dashboard to your own tools, such as spreadsheets, BI dashboards, or data warehouses. This export can contain data for a single test or across multiple tests, and deliver them by email or to a cloud storage partner. You can export the results once or set up a recurring subscription.
There are two types of reports available:
- Overview: Contains experiment metadata, including variant definitions, traffic allocation, winner, start and end time, and status
- Stats: Contains per-goal, per-variant conversion counts aggregated by day. It shows the numbers that power the lift and the statistical significance.
A/B Test Export Results Details
Overview Report
The Overview report includes the following fields for each experiment:
| Field | Description |
|---|---|
| Experiment ID | Unique identifier for the experiment |
| Experiment Name | Name as set in the dashboard |
| Status | Current status: Draft, Running, Stopped, or Finished |
| Type | Experiment type: Visual Editor or Dynamic Variables |
| Start Time | When the experiment began collecting data |
| Created By / Updated By | Account user who created or last updated the experiment |
| Sample % | Percentage of eligible users included in the test |
| Variant Names | Name of each variant, including the Control |
| Variant Count | Total number of variants |
| Goal Names | Name of each tracked goal |
| Winner Name | Set when the experiment is marked as finished |
| OS Filter | Target operating system, if the experiment was OS-specific |
| Audience Segment | Targeting segment applied to the experiment |
Stats Report
The Stats report includes the following fields, aggregated daily per variant and goal:
| Field | Description |
|---|---|
| Date | The day the stats were recorded (YYYY-MM-DD) |
| Goal Name | The conversion goal being measured |
| Variant Name | The variant being measured |
| Total Users Exposed | Number of users who entered the experiment on that day |
| Conversions | Number of goal completions for that variant on that day |
| Revenue | Aggregated revenue across variants, included when the goal is Revenue per User |
NoteStats exports contain aggregated counts only. There are no individual user data or profile identifiers included.
Set Up Export
Select one or more tests using the checkboxes, then click the Export Reports button.
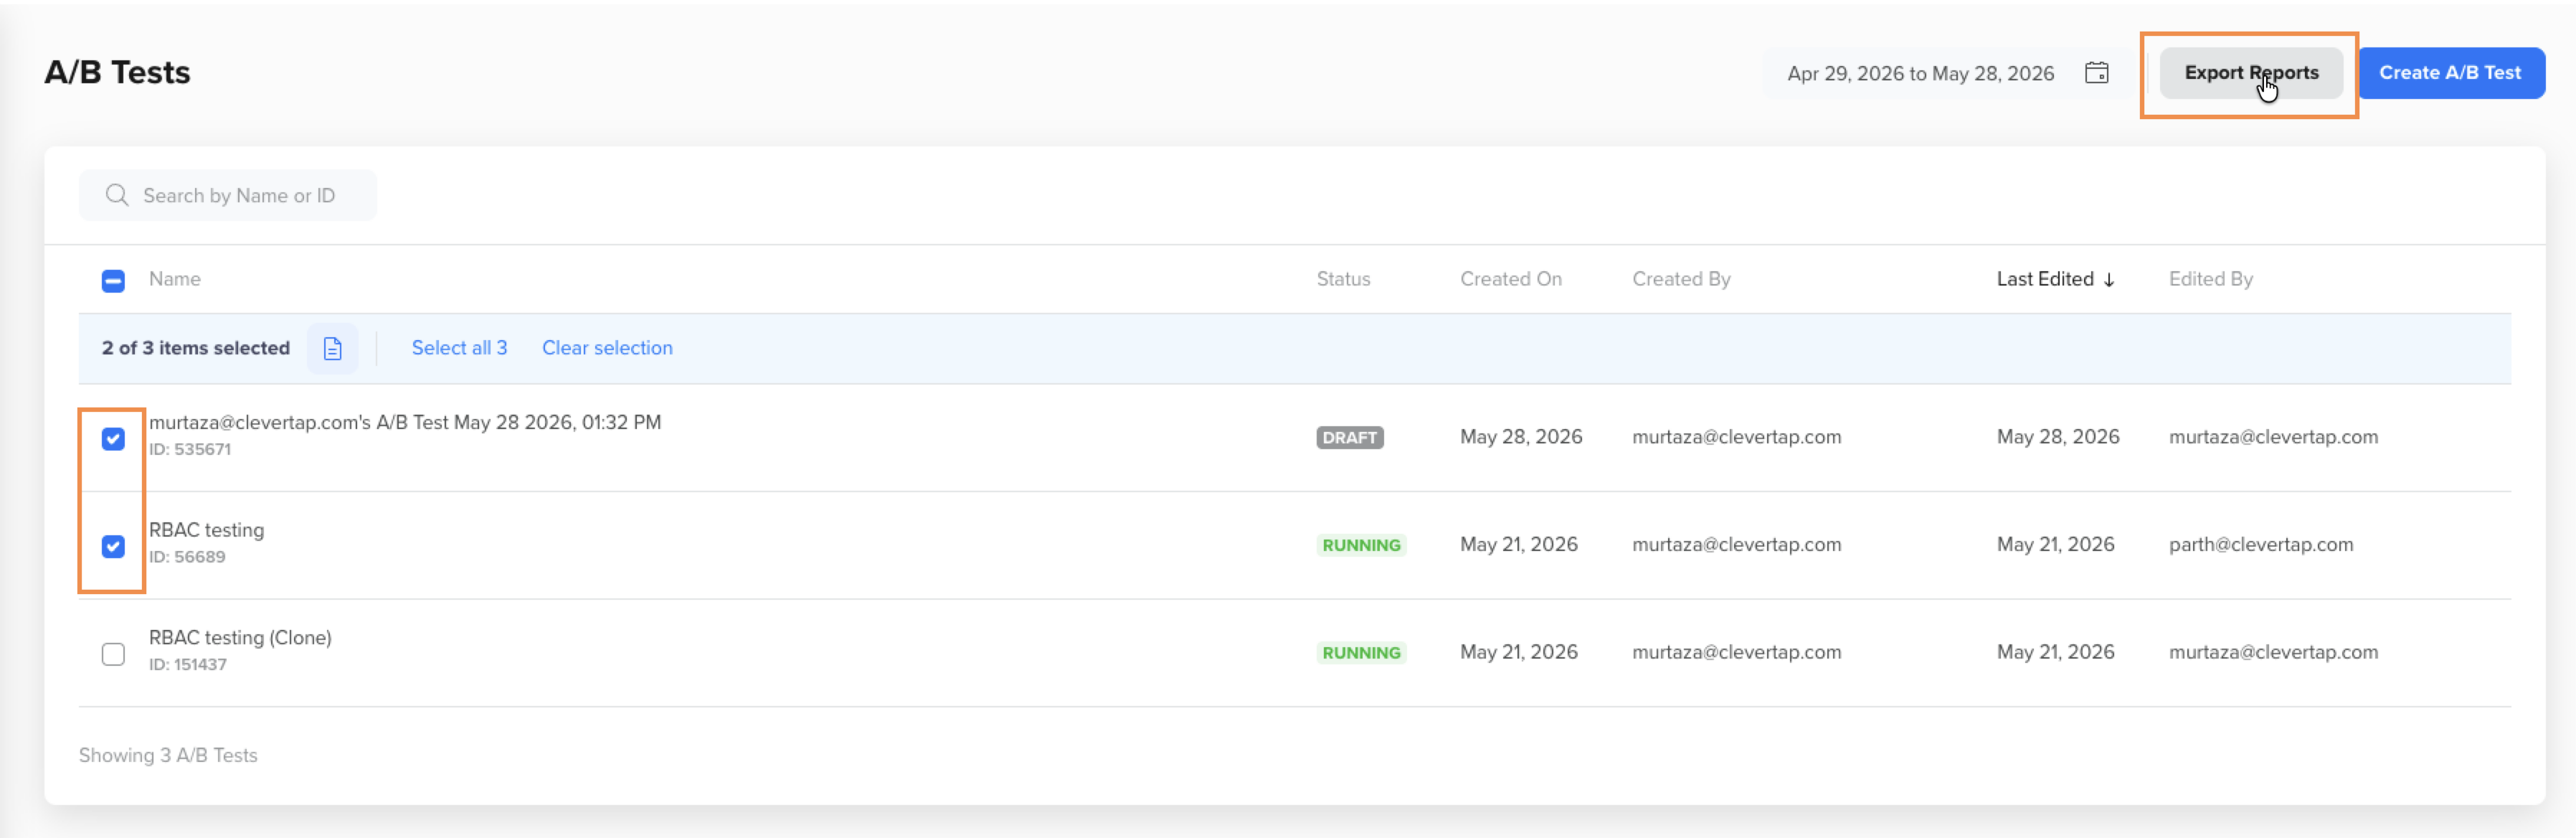
Accessing Exports from the A/B Tests Listing Page
It opens the A/B Test Reports panel, which has two tabs: Setup and Subscriptions.
Setup Tab
Use the Setup tab to configure a new export.
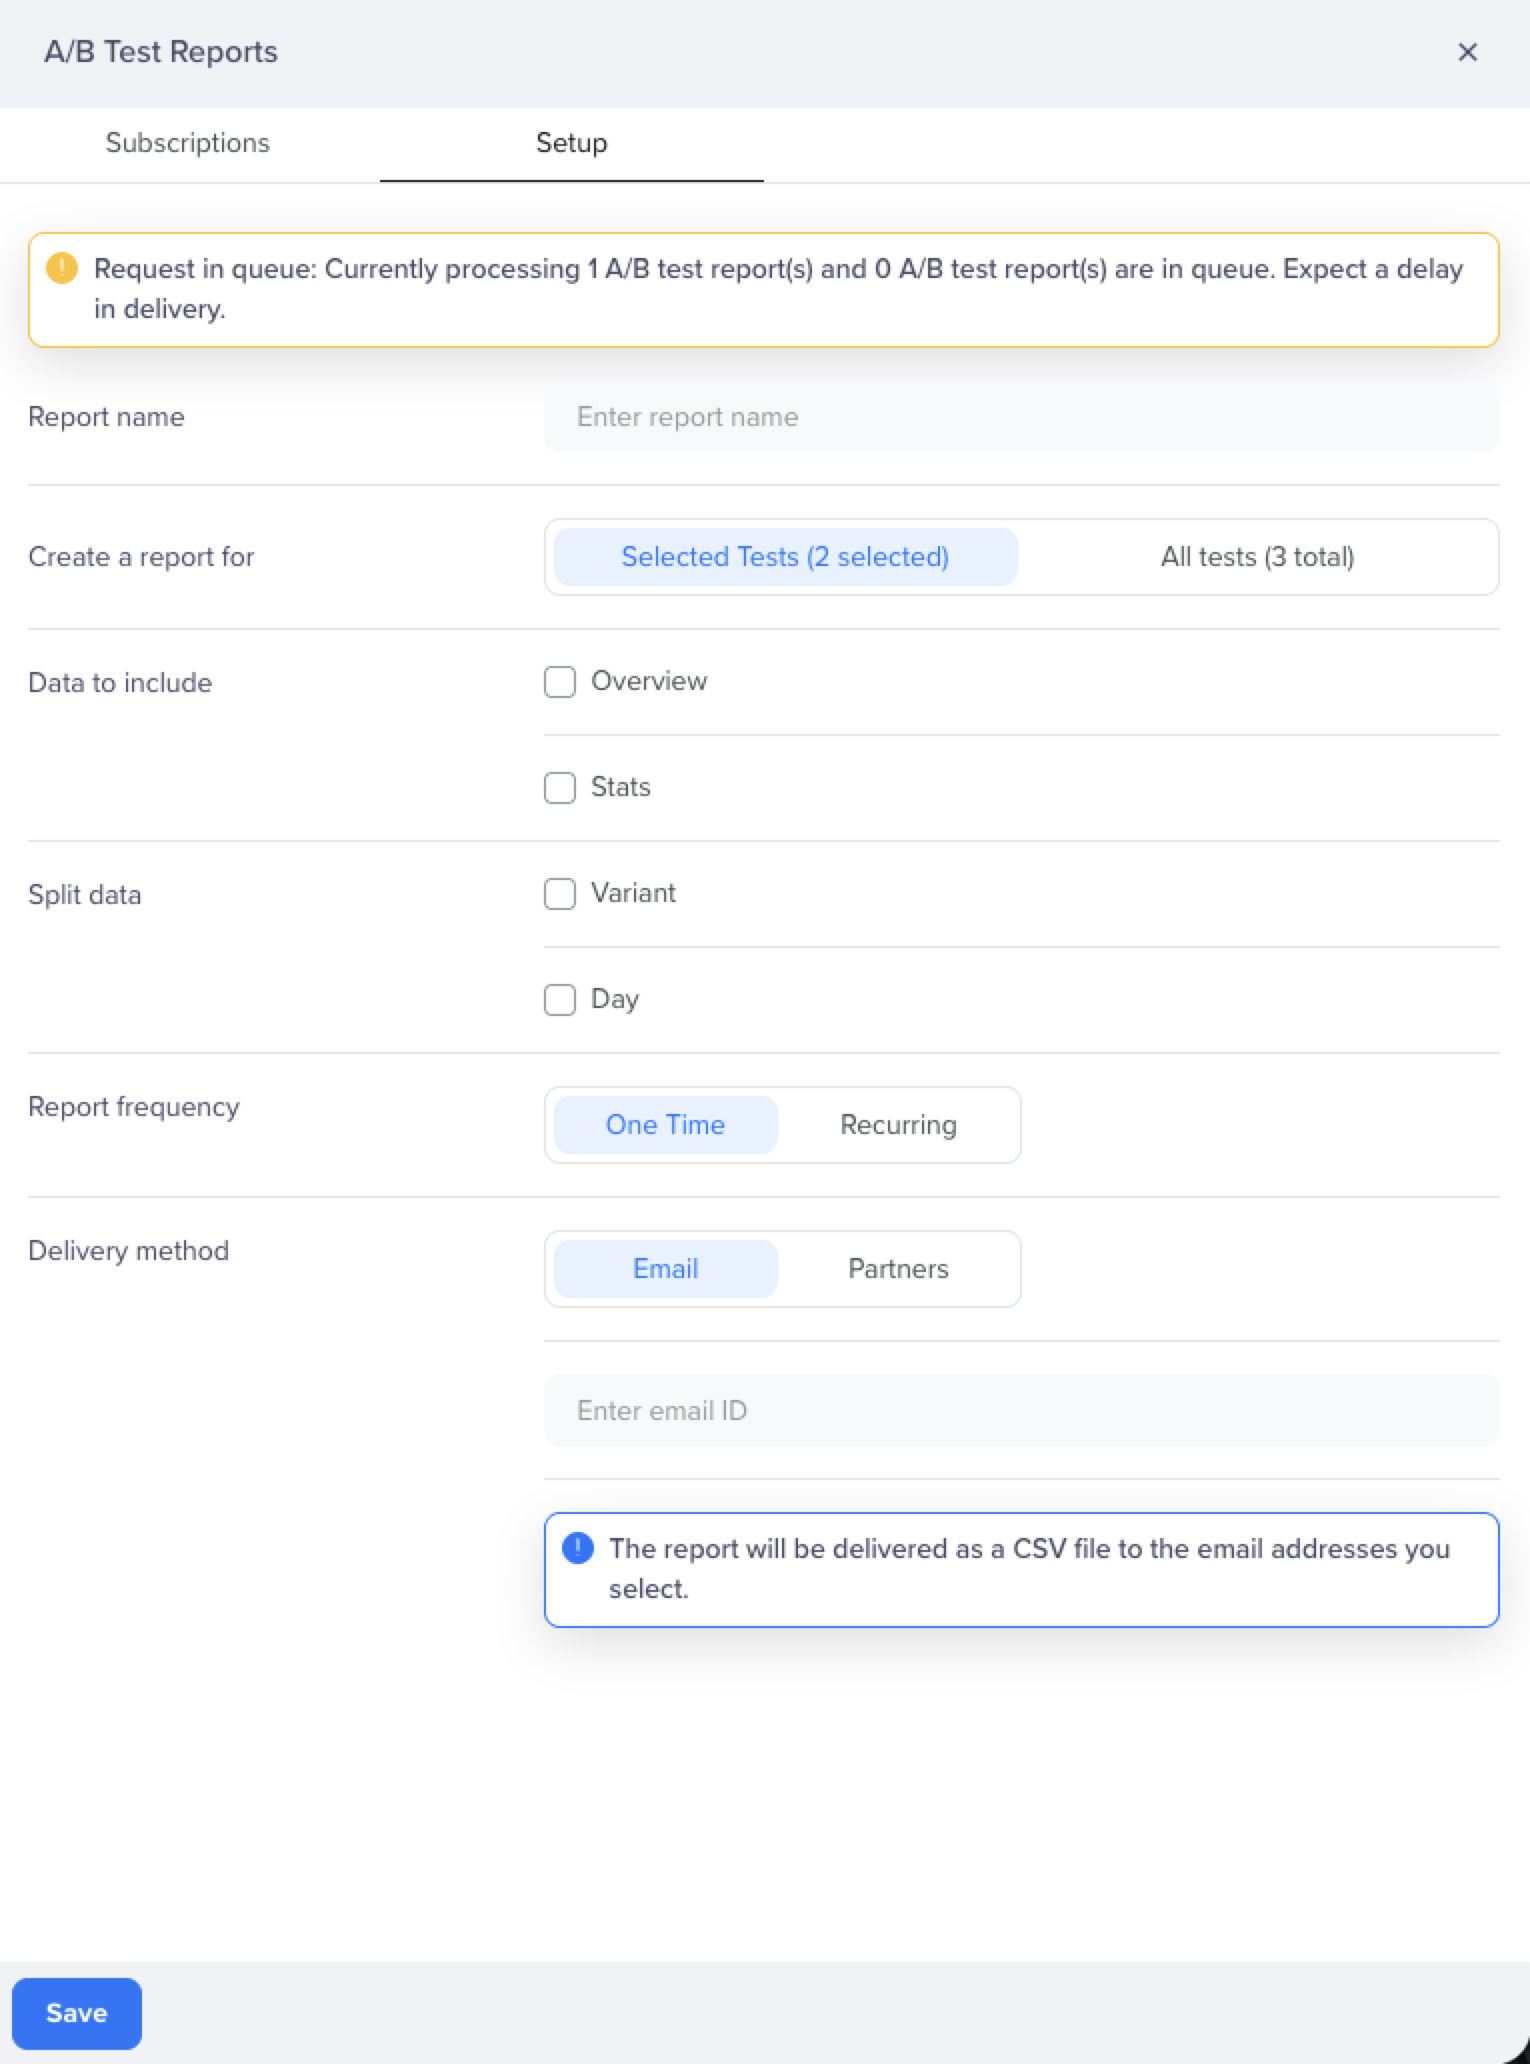
A/B Test Reports — Setup Tab
The setup tab has the following selections:
| Field | Options | Description |
|---|---|---|
| Report name | Free text | A label to identify this export in your Subscriptions list |
| Create a report for | Selected Tests or All tests with filters applied | Choose whether to export only the tests you selected or all tests currently visible in the listing |
| Data to include | Overview, Stats | Select one or both report types to include in the export |
| Split data by | Day, OS, Variant type | Determines how the Stats data is sliced. Day produces one row per day; OS segments by operating system; Variant type pivots data by variant |
| Report frequency | One Time or Recurring | One Time generates the export immediately. Recurring re-runs it automatically on a daily or weekly cadence. Recurring exports run once per day at a fixed time in your account's configured timezone. |
| Delivery method | Email or Partners | See Delivery Options below |
Click Save to create the subscription.
Delivery Method
You can either set the delivery method to Email or Partners.
Email
The generated report is sent to the email address associated with your CleverTap account login. Depending on file size, the file is either attached directly or included as a download link.
Partners (Cloud Storage)
You can deliver exports directly to a cloud storage destination. Configure your credentials first in Settings > Partners, then select the partner during export setup.
The following are the supported partners:
| Partner | Configuration required |
|---|---|
| AWS S3 | Bucket name, region, and IAM credentials or role ARN |
| Google Cloud Storage | Bucket name and service account key |
| Azure Blob Storage | Storage account name, container name, and connection string or SAS token |
| Snowflake | Account URL, database, schema, table, and credentials |
Subscriptions Tab
The Subscriptions tab lists all the recurring exports that you set up. Each entry shows the subscription name, data type, split-by setting, and delivery partner.
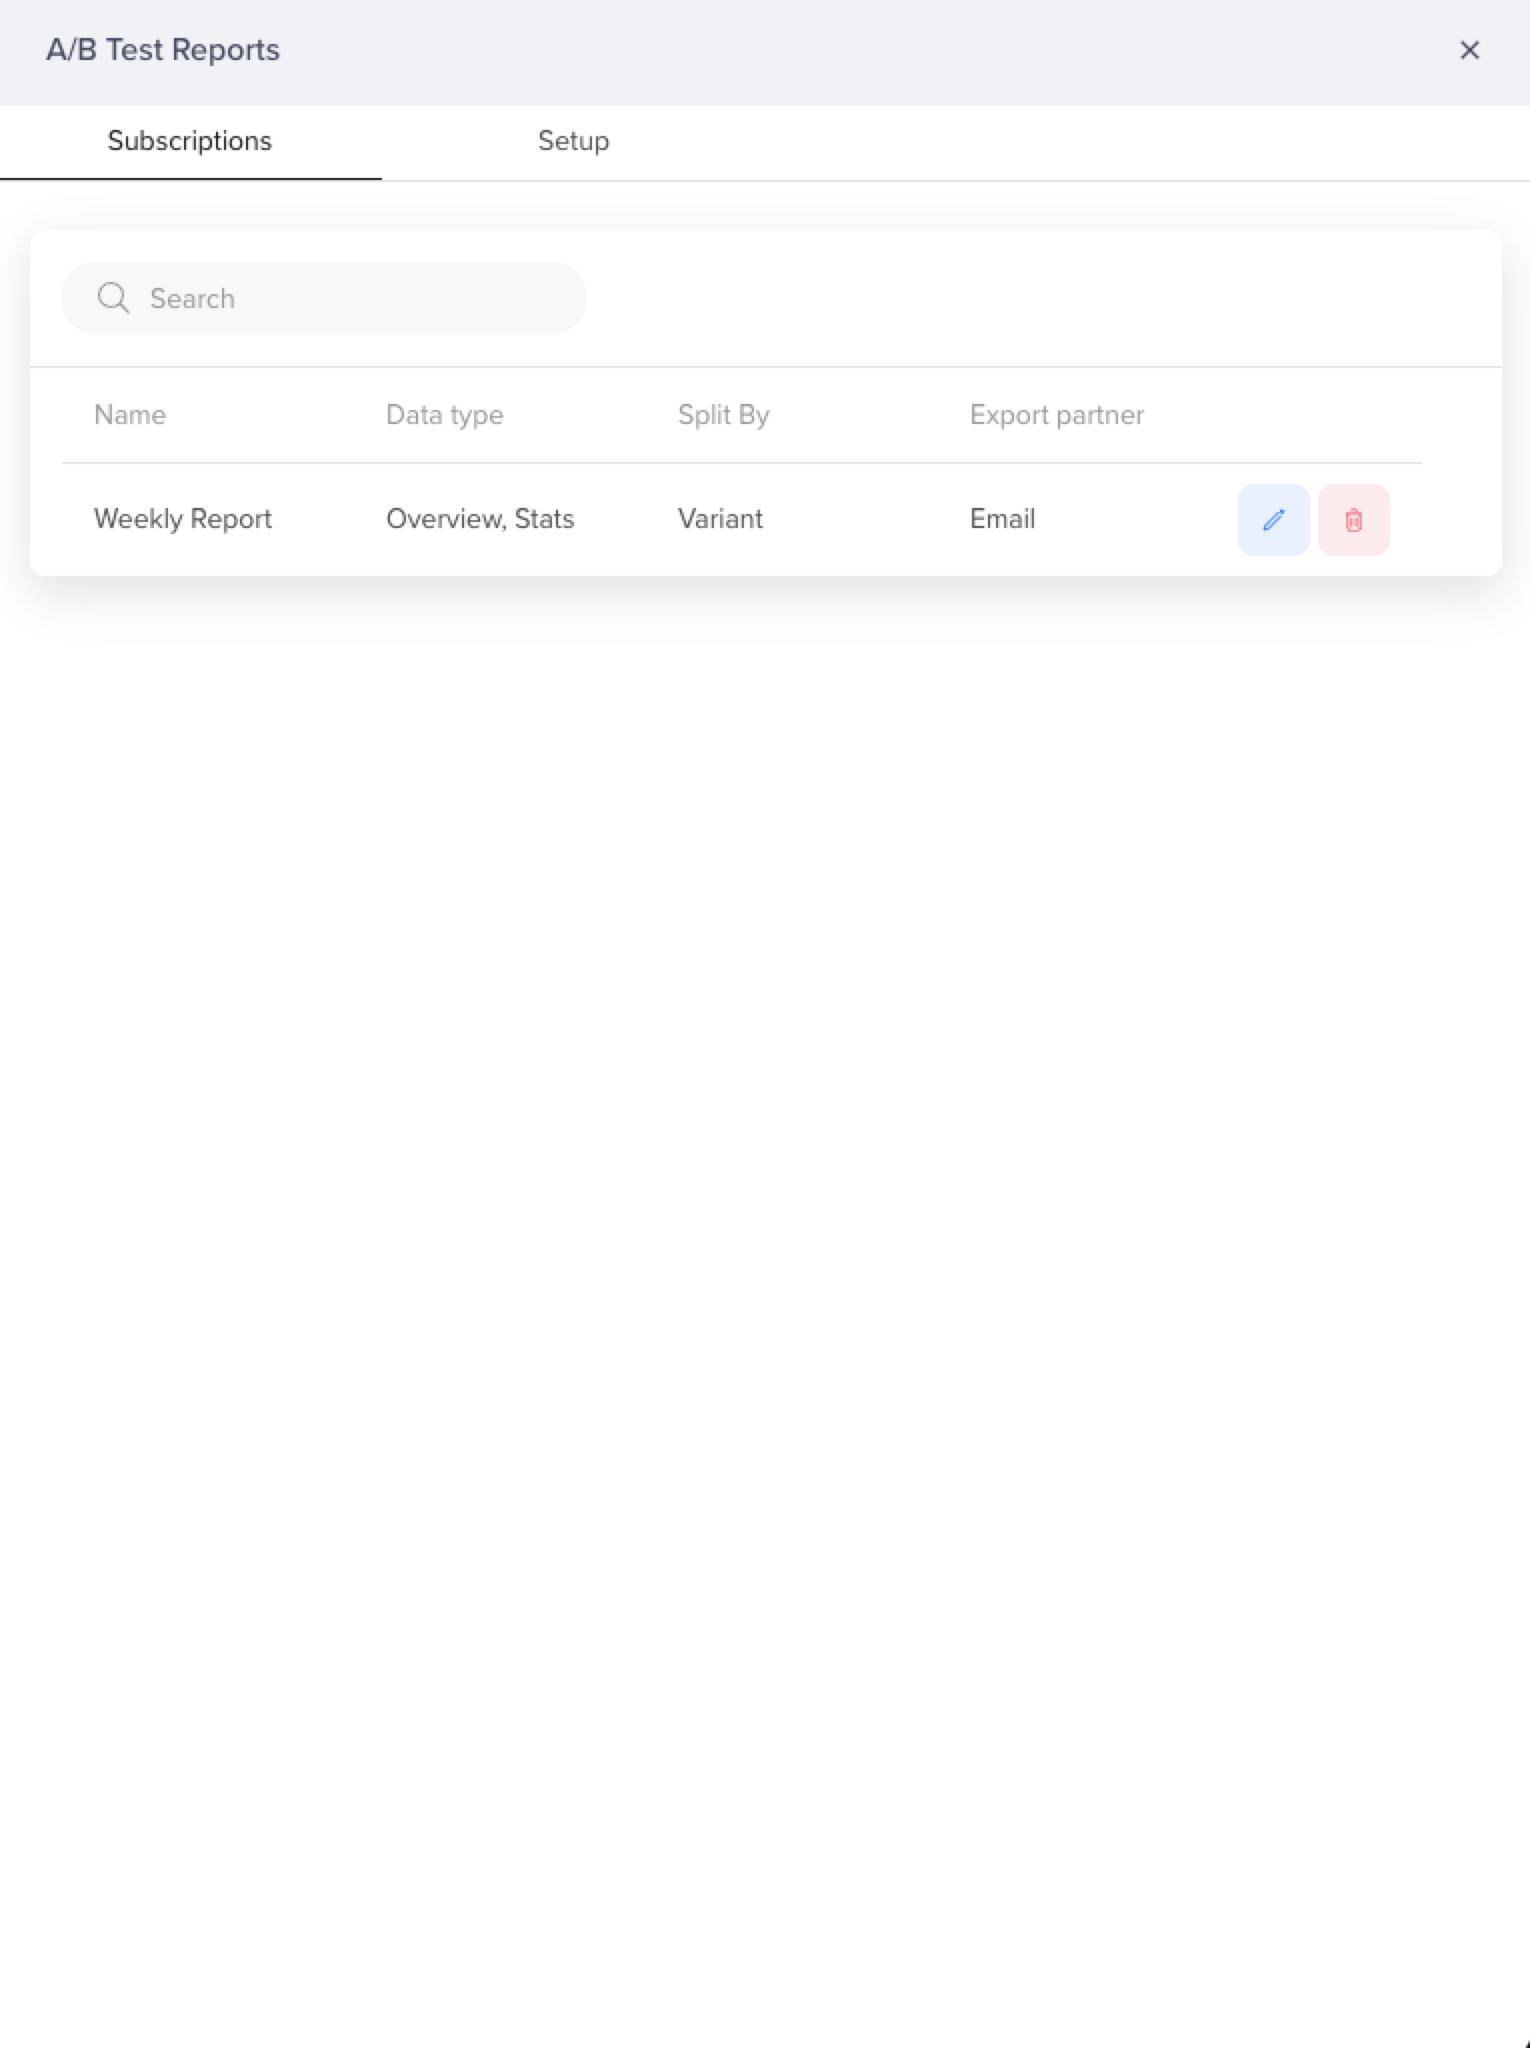
A/B Test Reports - Subscriptions Tab
From this tab, you can do the following:
- Search for a subscription by name using the search bar.
- Edit a subscription by clicking its row and updating any field.
- Delete a subscription to stop future runs. Files already delivered to your destination are not removed.
Known Limits and Behavior
| Limit / Behavior | Detail |
|---|---|
| Draft experiments | Exports for experiments in Draft status return empty stats, as the experiment has not yet started collecting data |
| No events recorded | If an experiment has no recorded exposure events yet, the export completes with empty stats rows |
| Revenue goal aggregation | Revenue goals are aggregated across the full experiment window. A month-by-month breakdown is not available in the export |
| Recurring exports after an experiment ends | Recurring subscriptions continue running after an experiment is stopped or finished, exporting the final state of stats. Delete the subscription manually when it is no longer needed |
FAQ
Q. How far back does the stats data go?
Stats are stored from the day the experiment was created (or the start time, whichever is later). All historical daily buckets are included in each full export.
Q. Why is my export showing 0 conversions for a variant?
Check the following
- The experiment is in
RUNNINGorDONEstatus - The goal event is being tracked in CleverTap, and
- The export ran after the experiment had collected sufficient data.
Q: Can I export multiple experiments in one file?
Yes. The "All A/B Tests" option in the subscription form creates a combined export. Each experiment appears as a separate block of rows, with the Experiment ID column identifying which rows belong to which experiment.
Q. Can I get real-time stats, not just daily?
The current export engine generates daily aggregates. Intra-day stats are not yet supported. However, the A/B test Results tab on the dashboard does reflect near-real-time data.
Q. What happens to recurring exports when an experiment is stopped?
The recurring subscription continues to run and exports the final state of the experiment stats. You can manually delete the subscription once you no longer need updates.
Updated 2 months ago