Analysing User Ratings in Analytics
Understand how you can analyze user ratings for accurate data analysis
Tracking Events
Whenever a user submits the feedback form, the Rating Submitted event is triggered. This event includes properties such as User Rating, Input Type, Comment.
Refer to the table below for a better understanding of the event properties.
| Event Name | Properties | Data Type | Sample Value | Comments |
|---|---|---|---|---|
| Rating Submitted | User Rating | Number | 3 | |
| Input Type | String | Rating/NPS | ||
| Comment | String | Awesome product | 512 characters limit | |
| Campaign Id | String | 17654 | ||
| Response | String | prices, quality, usability |
The event details can then be tracked from the Analytics dashboard.
Analysis of Data Captured using Ratings Template
- When a user submits a rating by clicking the Submit button on the Web popup, a Rating Submitted event is triggered.
- This event is available across the CleverTap platform. It helps in creating targeted segments for users to engage them on various channels based on their rating feedback.
- This event can also be used in Analytics for the analysis of data captured through the Ratings campaigns.
Listed below are the steps to perform analysis for some of the key metrics:
View Ratings Trend
To view the Trend for the number of ratings submitted and Frequency histogram:
i. Navigate to Analytics > Events.
ii. From the event dropdown, search for Rating Submitted event and click on View details.
iii. Under the Trends & Properties tab, one can view the trend for the number of ratings submitted on a Daily, Weekly, and Monthly basis.
iv. Select Event property as Ratings to get a histogram view of the rating scale.
Analyze Average Rating Trends
To analyze the Average Rating trends:
i. Navigate to Analytics > Trends
ii. Select the Rating Submitted event > +Summarize by “User Rating” property and click on View Trend
iii. Navigate to the Properties tab and select Average of property value from the View dropdown.
iv. You can also analyze the trend of Average Rating on a Daily, Weekly, and Monthly basis.
Pinning Reports to DashboardsOne can also pin the reports or specific trend charts to a custom dashboard using the pin icon available at the extreme right for monitoring the data at regular intervals.
Analyze Comments
To view and analyze the Comments received:
i. Navigate to Analytics > Events
ii. Select the Rating Submitted event
iii. To filter the data at a campaign level, add the Campaign id filter as show below:
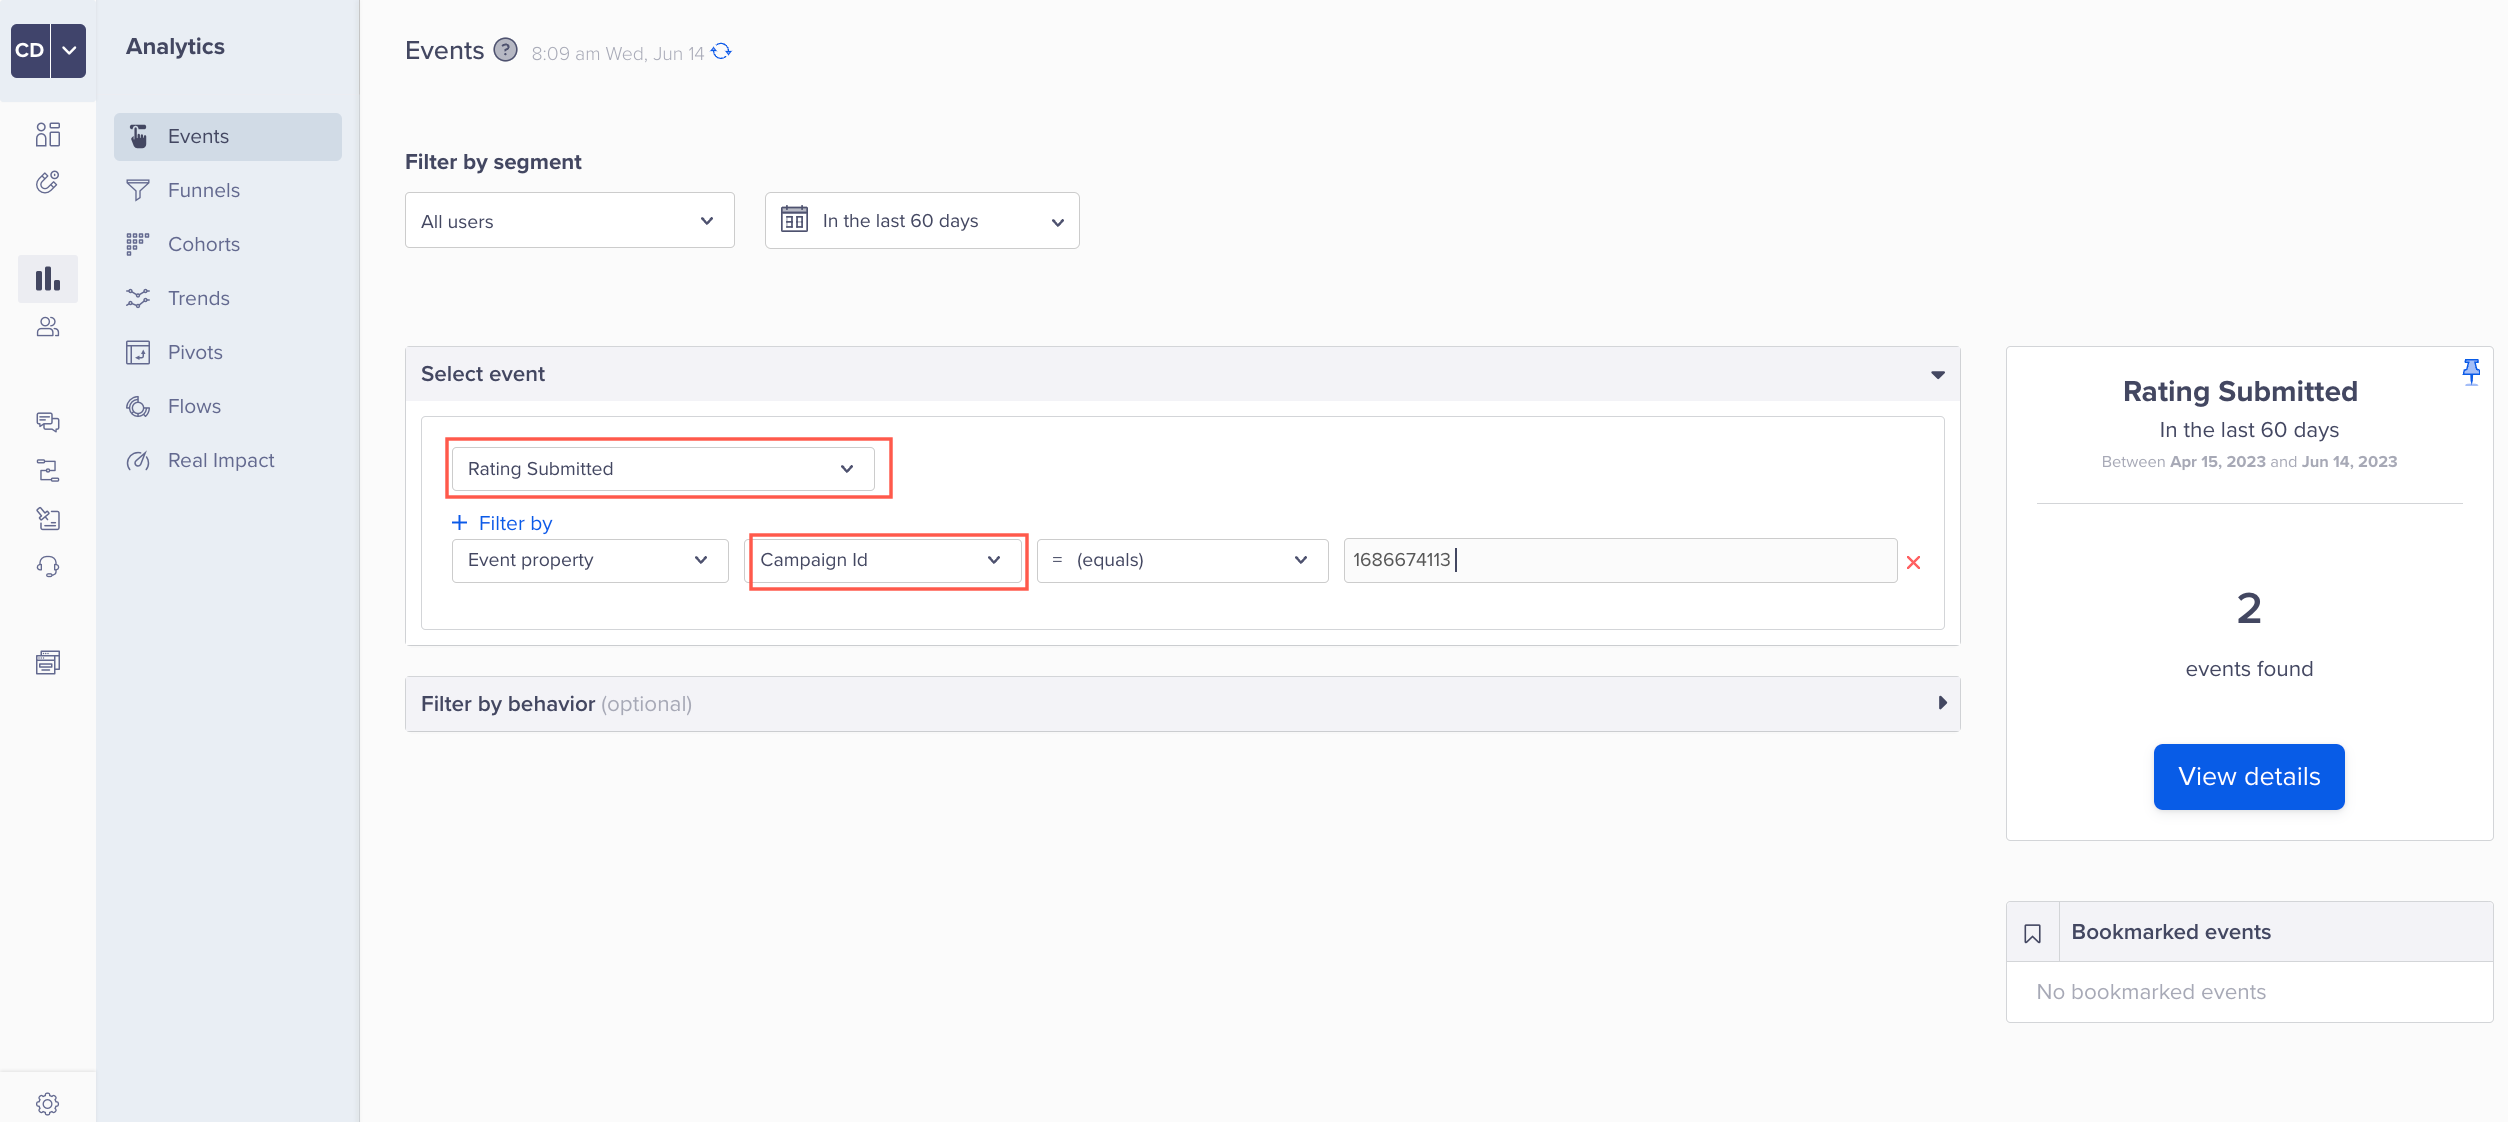
Rating Submitted Data
iv. Click View details.
v. Navigate to Trend & Properties
vi. From the Event property dropdown, select Comment
vii. Select the grid view to view all the comments received in tabular format.

View User Comments
viii. To download the comments, Click Export as CSV button available below the grid icon.
Updated 8 months ago