Web Push Stats
Understand all the statistical information available for your Web Push campaign
Viewing Web Push Campaign Stats
Once the campaign has been published, you can view the statistics from the dashboard. Click on Campaigns > select the specific campaign from the campaign list. A Stats page opens up where you can view the total Views, Clicks, Conversions, CTR, and Conversion Performance.

Web Push Campaign Stats
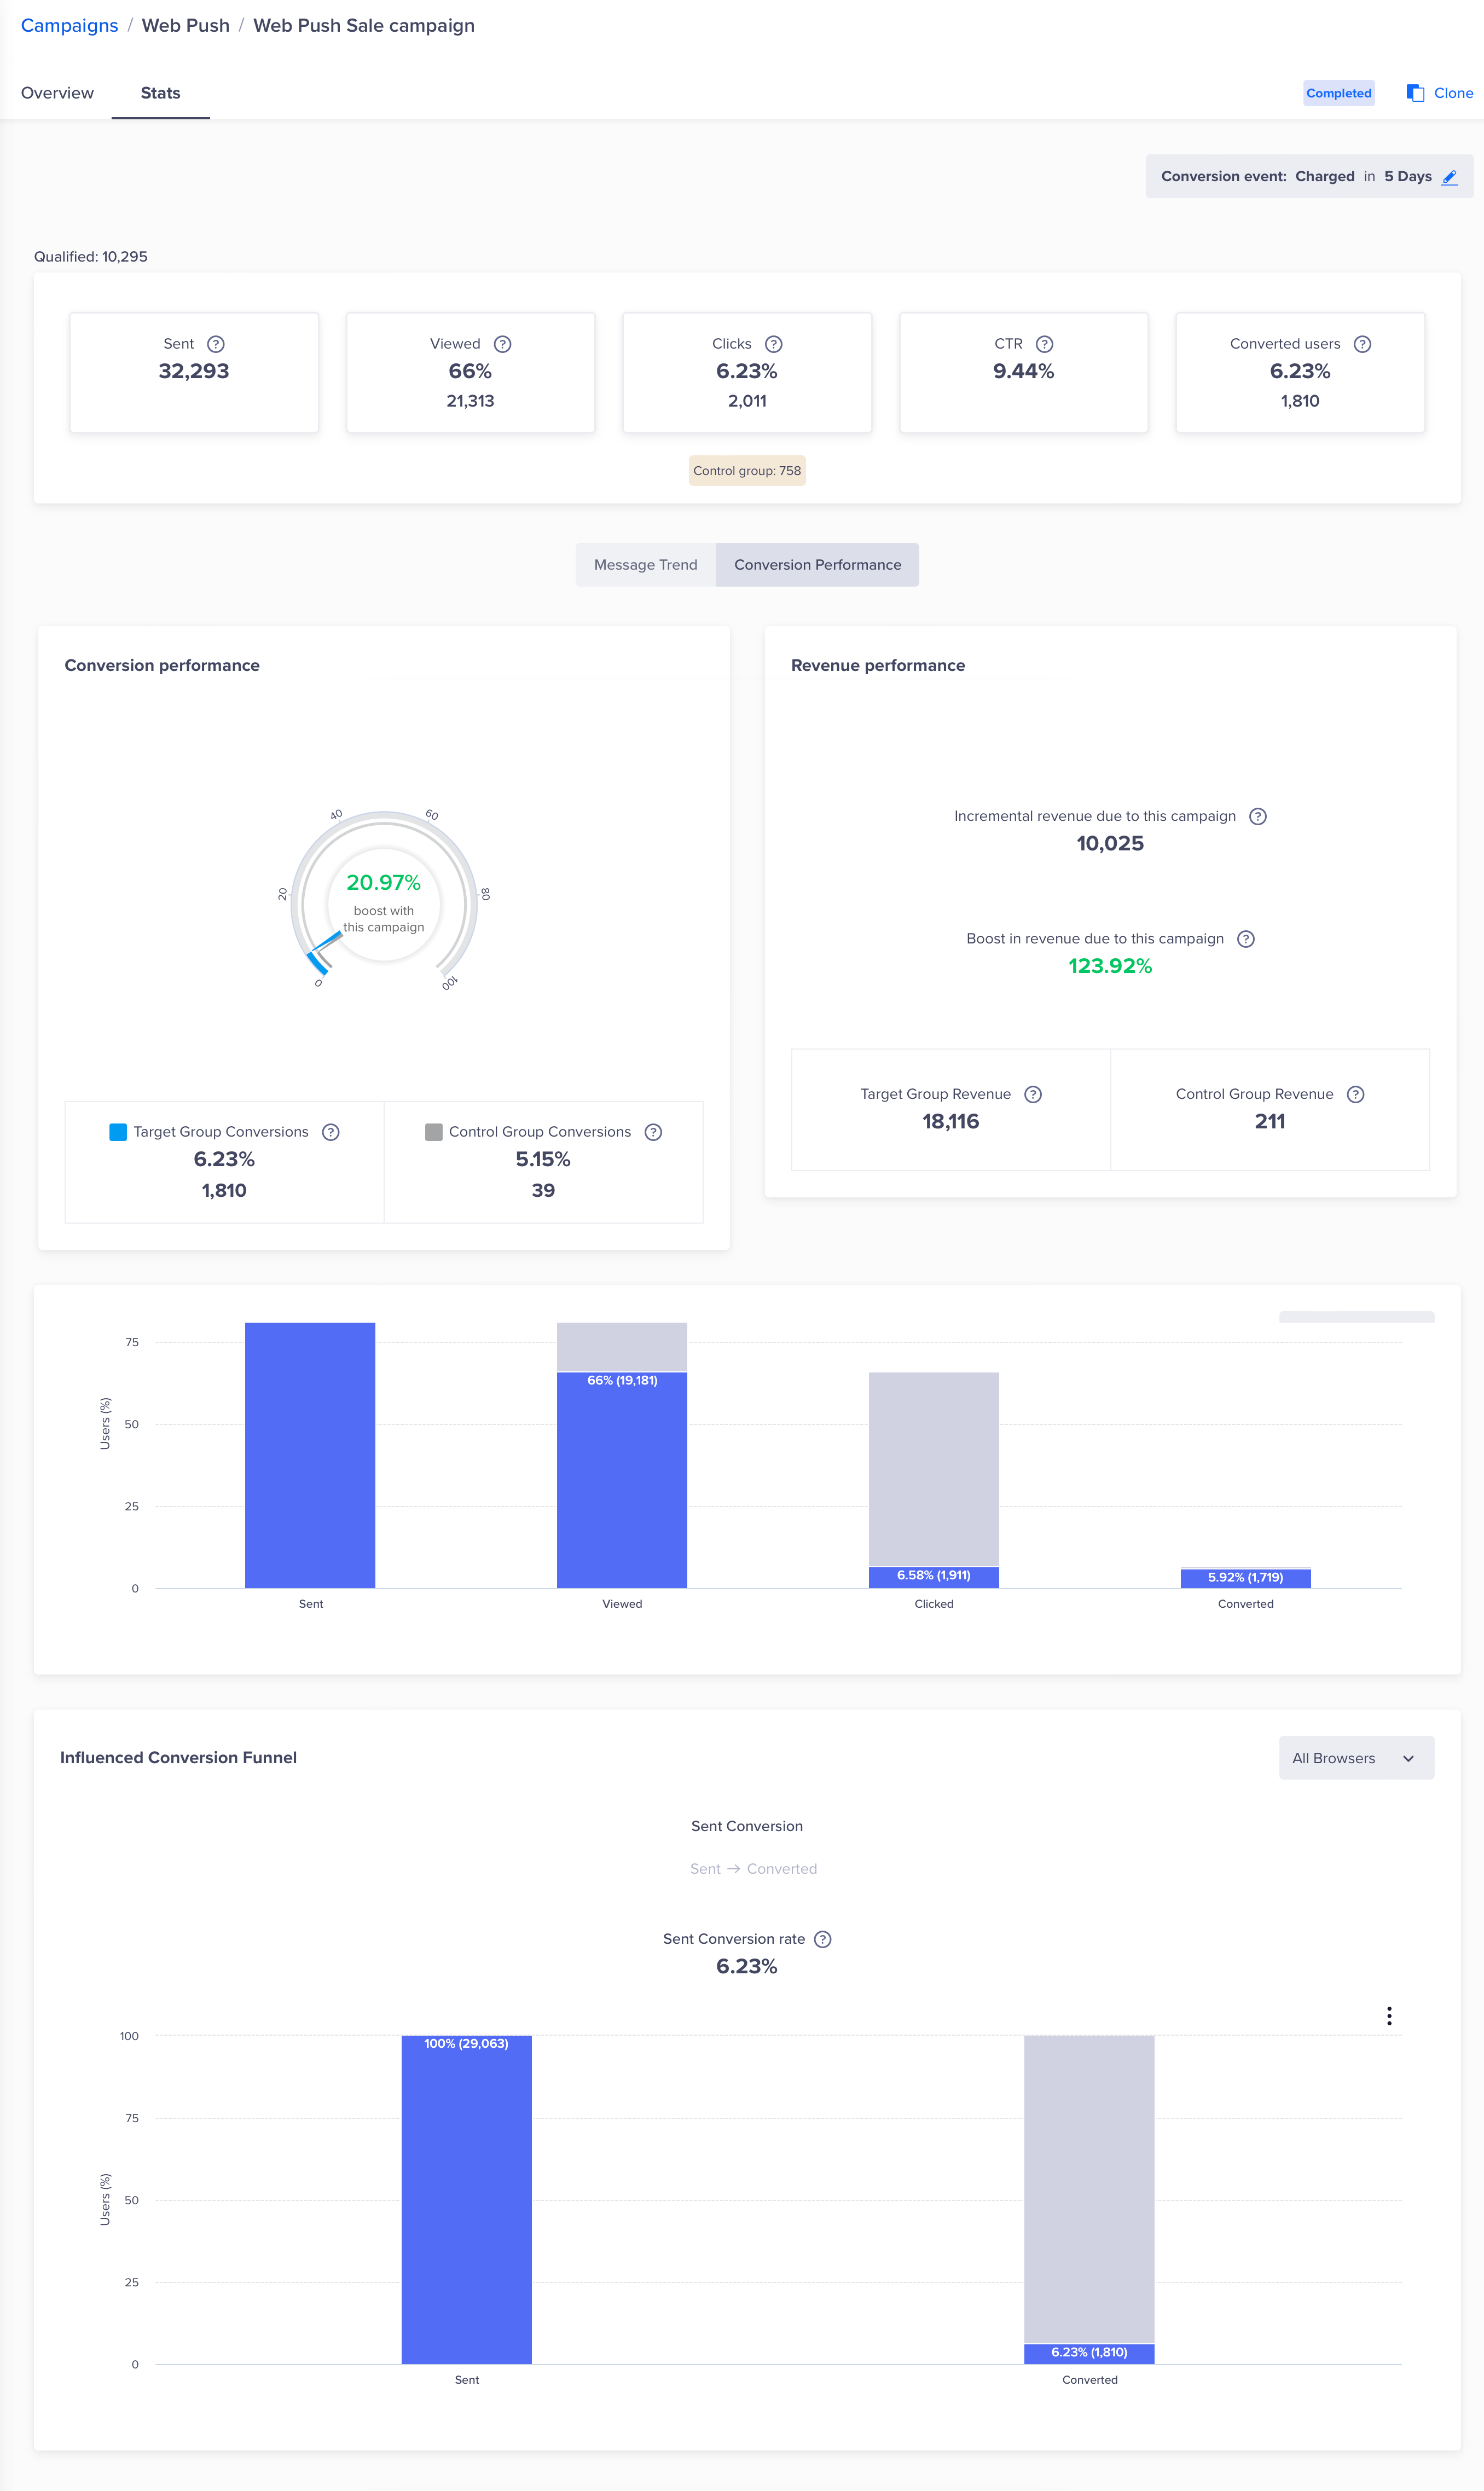
Web Push Conversion Performance Stats
- Sent: Represents the count of total Web Push notifications sent to the end-users.
- Views: Represents the number of times a Web Push notification is viewed.
- Clicks: Represents the number of times users have clicked on the Web Push notification.
- CTR: Represents the ratio of Clicks to Views. (CTR = Clicks/Views * 100).
- Trend charts: Represents trends of Sent, Viewed, and Clicked events for this campaign over a specific period of time (for example daily, weekly, monthly).
Learn more about analyzing key Customer Engagement Metrics to refine your web strategy to drive better conversions.
Errors
You can view Web Push campaign errors from the Stats > Errors tab.
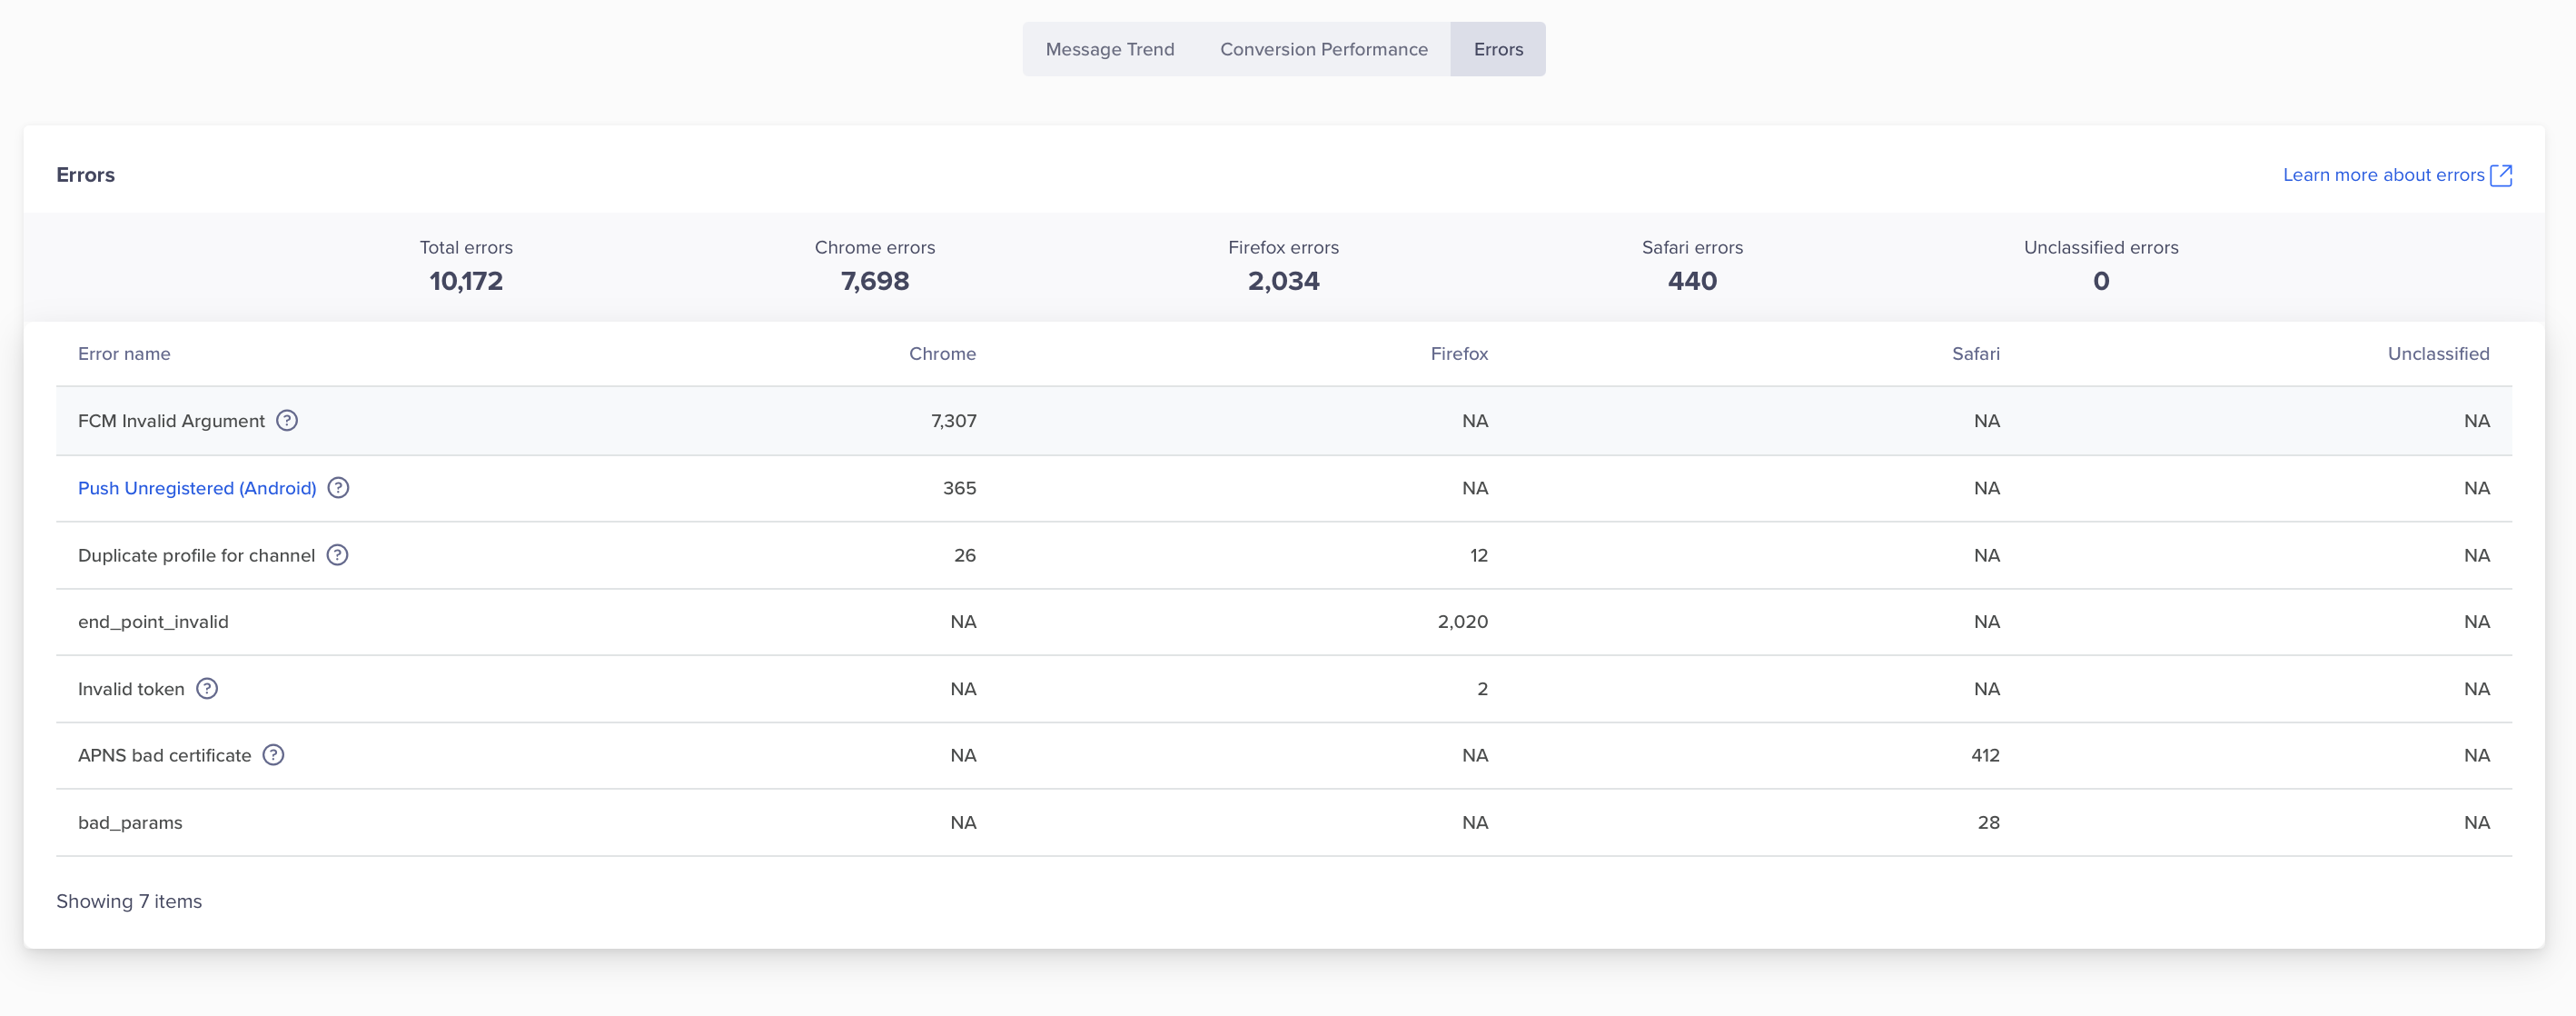
Error Stats
APNS Errors
Apple Push Notification Service (APNS) errors indicate issues with delivering push notifications to iOS devices. Refer to the following table for error codes.
| Error Code | Description |
|---|---|
| apns_auth_error | Invalid APNS certificate. |
| apns_toomany_same_token | Too many requests have been made for the same device token. |
| apns_unknown | General APNS error. |
| apns_token_format | APNS token format is invalid. |
| apns_temp_blacklist | APNS account temporarily blacklisted. |
| apns_empty_payload | APNS payload is empty. |
For more information, refer to Handling error responses from Apple Push Notification Service.
VAPID Errors
VAPID (Voluntary Application Server Identification) errors occur during the delivery of web push notifications. Refer to the following error codes, categorized by their associated platform.
Safari, Firefox, Kaios Web Push dispatch errors
| Error Code | Description |
|---|---|
| bad_params | One or more of the parameters specified is invalid. |
| bad_auth | The authorization header is either invalid or missing, resulting in invalid credentials. |
| end_point_invalid | The URL specified is invalid. |
| token_invalid | Invalid Token. |
| server_issue | An internal error has occurred within the Push Server. |
| browser_unsubscribed | The user has unsubscribed. |
| dispatch_failed | Dispatch error. |
| payload_too_large | The payload used is too large. |
Chrome VAPID
| Error Code | Description |
|---|---|
| gcm_ia | Invalid FCM key. |
| push_unreg | Push Unregistered (Android). |
| browser_unsubscribed | The user has unsubscribed. |
Chrome FCM
| Error Code | Description |
|---|---|
| gcm_others | Unknown Error for FCM. |
| fcm_invalid_argument | The FCM argument is invalid. |
| fcm_sending_rate_exceeded | The sending rate for FCM has exceeded. |
| fcm_oauth2_token_expired | FCM OAuth2 Token Expired. |
| gcm_msi | Wrong FCM API key. |
| push_unreg | Push Unregistered (Android). |
| fcm_internal_server_error | FCM internal server error. |
FAQs
What are the timeouts and retry limits for Web Push Notifications?
The following are the timeout and retry limits for web push notifications:
| Channel | Timeout (ConnectionRequest) | Retry Limits |
|---|---|---|
| Chrome | 10 Seconds | 6 |
| Firefox | 10 Seconds | 3 |
| KaiOS | 10 Seconds | 3 |
| Safari | 10 Seconds (Read and Connect), 30 Sec (Read) | 3 |
For more information, refer to the Channel-Specific Timeouts and Retries.
Updated 8 months ago