
Conversions
Learn how to configure, analyze, and interpret conversions for your campaigns from the CleverTap dashboard.
Overview
Conversions Board connects your campaign to real business outcomes, such as conversions, revenue, and custom KPIs from a single dashboard.
With Conversions Board, you can:
- Track up to five conversion events (purchases, subscriptions, bookings, and so on)
- Measure revenue impact alongside engagement metrics
- Filter and compare campaigns by channel, status, label, and more
- Build custom KPIs for business-specific analysis, including revenue metrics for e-commerce, watch time for media and OTT, and policy value for BFSI
- Export performance data for reporting
Public BetaConversions Board is available in Public Beta. To get access, contact your Customer Success Manager or the CleverTap Support.
Attribution Model
Conversions Board uses a Last Touch Attribution model for attributing conversions to campaigns and journeys. In this model, attribution is based on the most recent Notification Clicked or Notification Viewed event that occurs before a conversion. This means the conversion is credited to the last campaign or journey message the user clicked on before completing the configured conversion event. The Last Touch model attributes conversions based on the recency of the click, not the relevance of the campaign content to the conversion event.
For example, if a user clicks a push notification promoting shoes and then purchases a mobile phone within the set lookback window, the conversion is still attributed to the Shoes campaign. This is because the promotional push for Shoes was the last touchpoint before the conversion.
Data RecencyConversions Board data is refreshed periodically and may take up to 6 hours to reflect recent campaign activity, conversions, or custom metric updates. Custom metrics may also take additional processing time before appearing in the Engagement Performance Table because attribution models update conversion metrics only after processing both the interaction event (click or view) and the conversion event.
Attribution Criteria
Attribution criteria define the type of user interaction that qualifies as a touchpoint. It controls how conversions are credited to campaigns and journeys.
Conversions Board supports two attribution criteria:
- Click through: Gives credit to an engagement when a user clicks a notification and then converts within the lookback window. Attribution is based on the Notification Clicked event.
- View through: Gives credit to an engagement when a user only views a notification, without clicking, and then converts within the lookback window. Attribution is based on the Notification Viewed event or a Push Impression.
NoteWhen a user views and also clicks a notification before converting, click-through takes precedence over view-through. The lookback window defines the time after a click or view during which a subsequent conversion is attributed to that touchpoint.
Prerequisites
Before using Conversions Board, you must configure at least one global conversion event, such as Charged, in the Schema. You can configure up to five conversion events to track different business goals simultaneously. These conversion events apply across all campaigns and journeys and serve as the basis for attribution and conversion calculations. Each event supports its own filters to narrow qualifying conversions, and its own lookback window to define how long after a click or view a conversion counts.
Configure Conversions Events
Before analyzing the Conversions Board, you must define what constitutes a conversion for your business. A conversion event represents a meaningful user action, such as a purchase, subscription, booking, or app upgrade. You can configure up to five conversion events.
To add a conversion event from the CleverTap dashboard:
- Go to Conversion Conversions Board in the CleverTap dashboard, then click Add conversion event.
- Select the required event that represents a meaningful user action, such as Charged for purchases or Subscription Started for subscriptions. You can optionally add a display nickname to identify the event clearly in the Conversions Board dashboard.
- (Optional) Apply filters to narrow qualifying conversions. For example, filter a Purchase event by product category or transaction value.
- Enter the Lookback window to define the time period during which a user action is attributed to a campaign.
- Click Save.
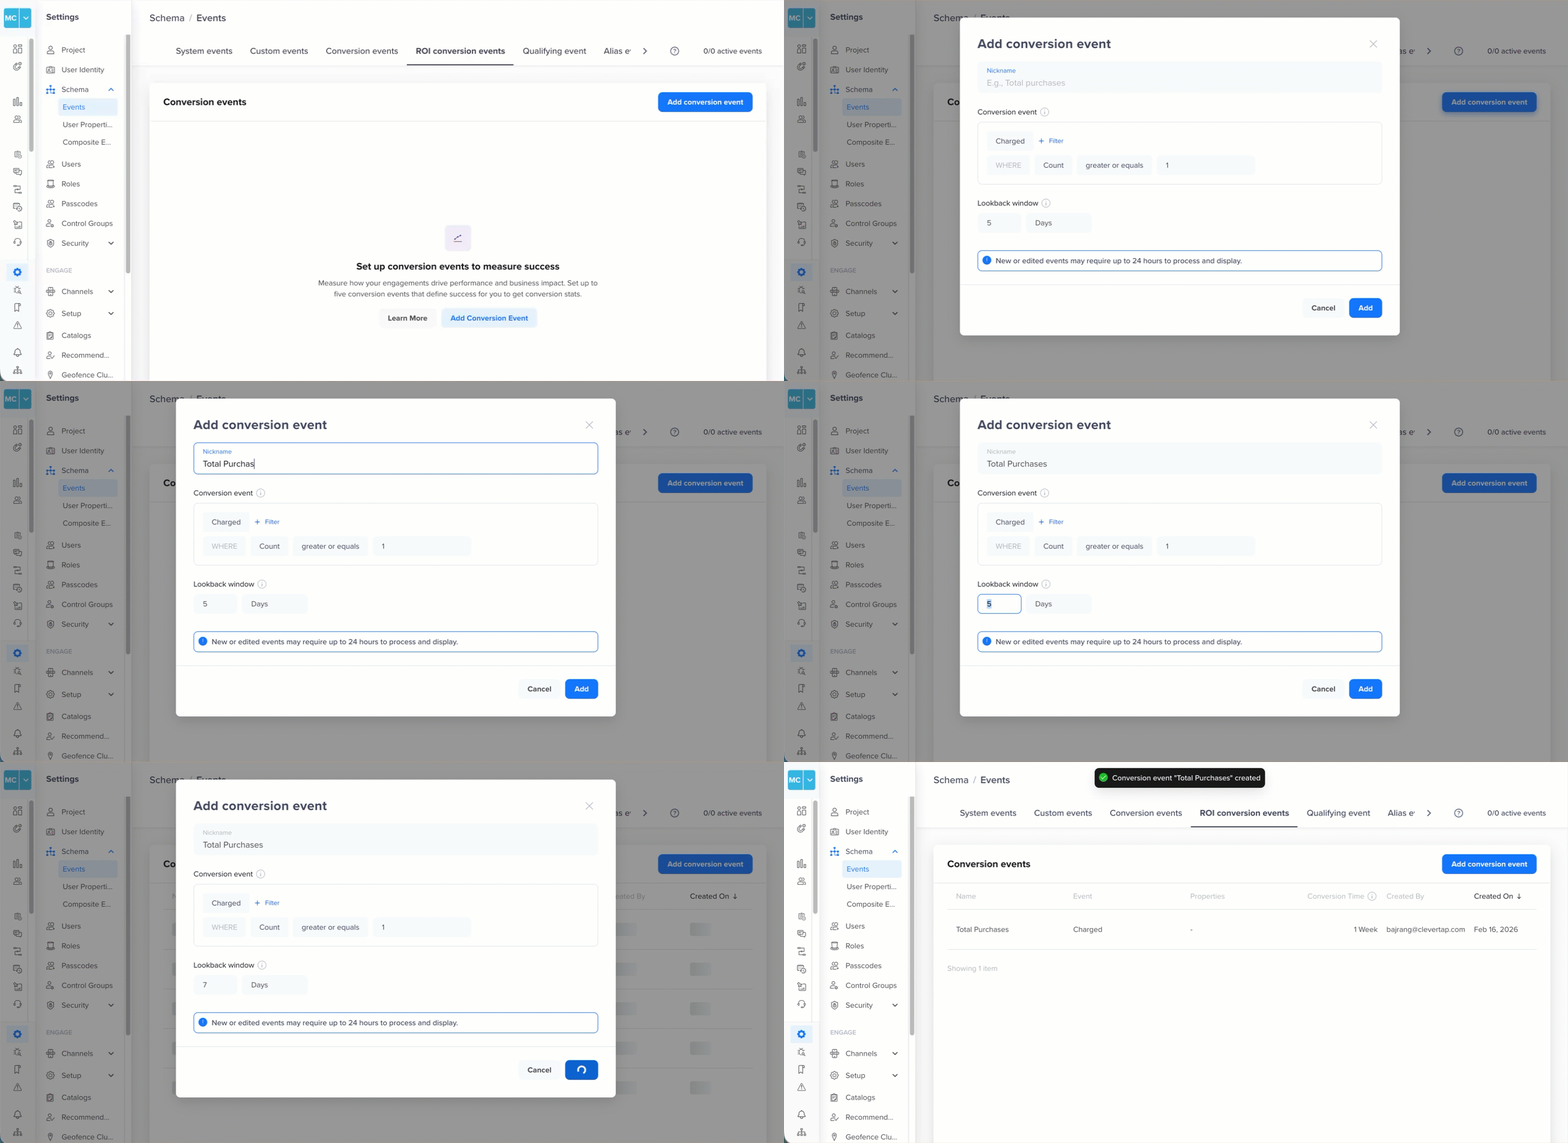
Add Conversion Event
Changing a Conversion EventChanges such as updating filters, renaming, or modifying the lookback window for a conversion event may take time to reflect on the dashboard. If you delete a conversion event, associated metrics will no longer be visible in Conversions Board.
Apply Filters
Filters help you narrow down the Conversions analysis to specific campaigns by name, channel, time period, owner, and more. When you apply filters on the Conversions Board, both the Metric tiles and the Engagement performance table update dynamically to reflect only the data that matches your selected criteria.
Use filters to focus on relevant business questions, such as:
- Which campaigns drove the most revenue this quarter?
- How did email campaigns perform compared to push notifications?
- Which campaigns generated the highest conversion rate?
- How are running campaigns performing compared to completed ones?
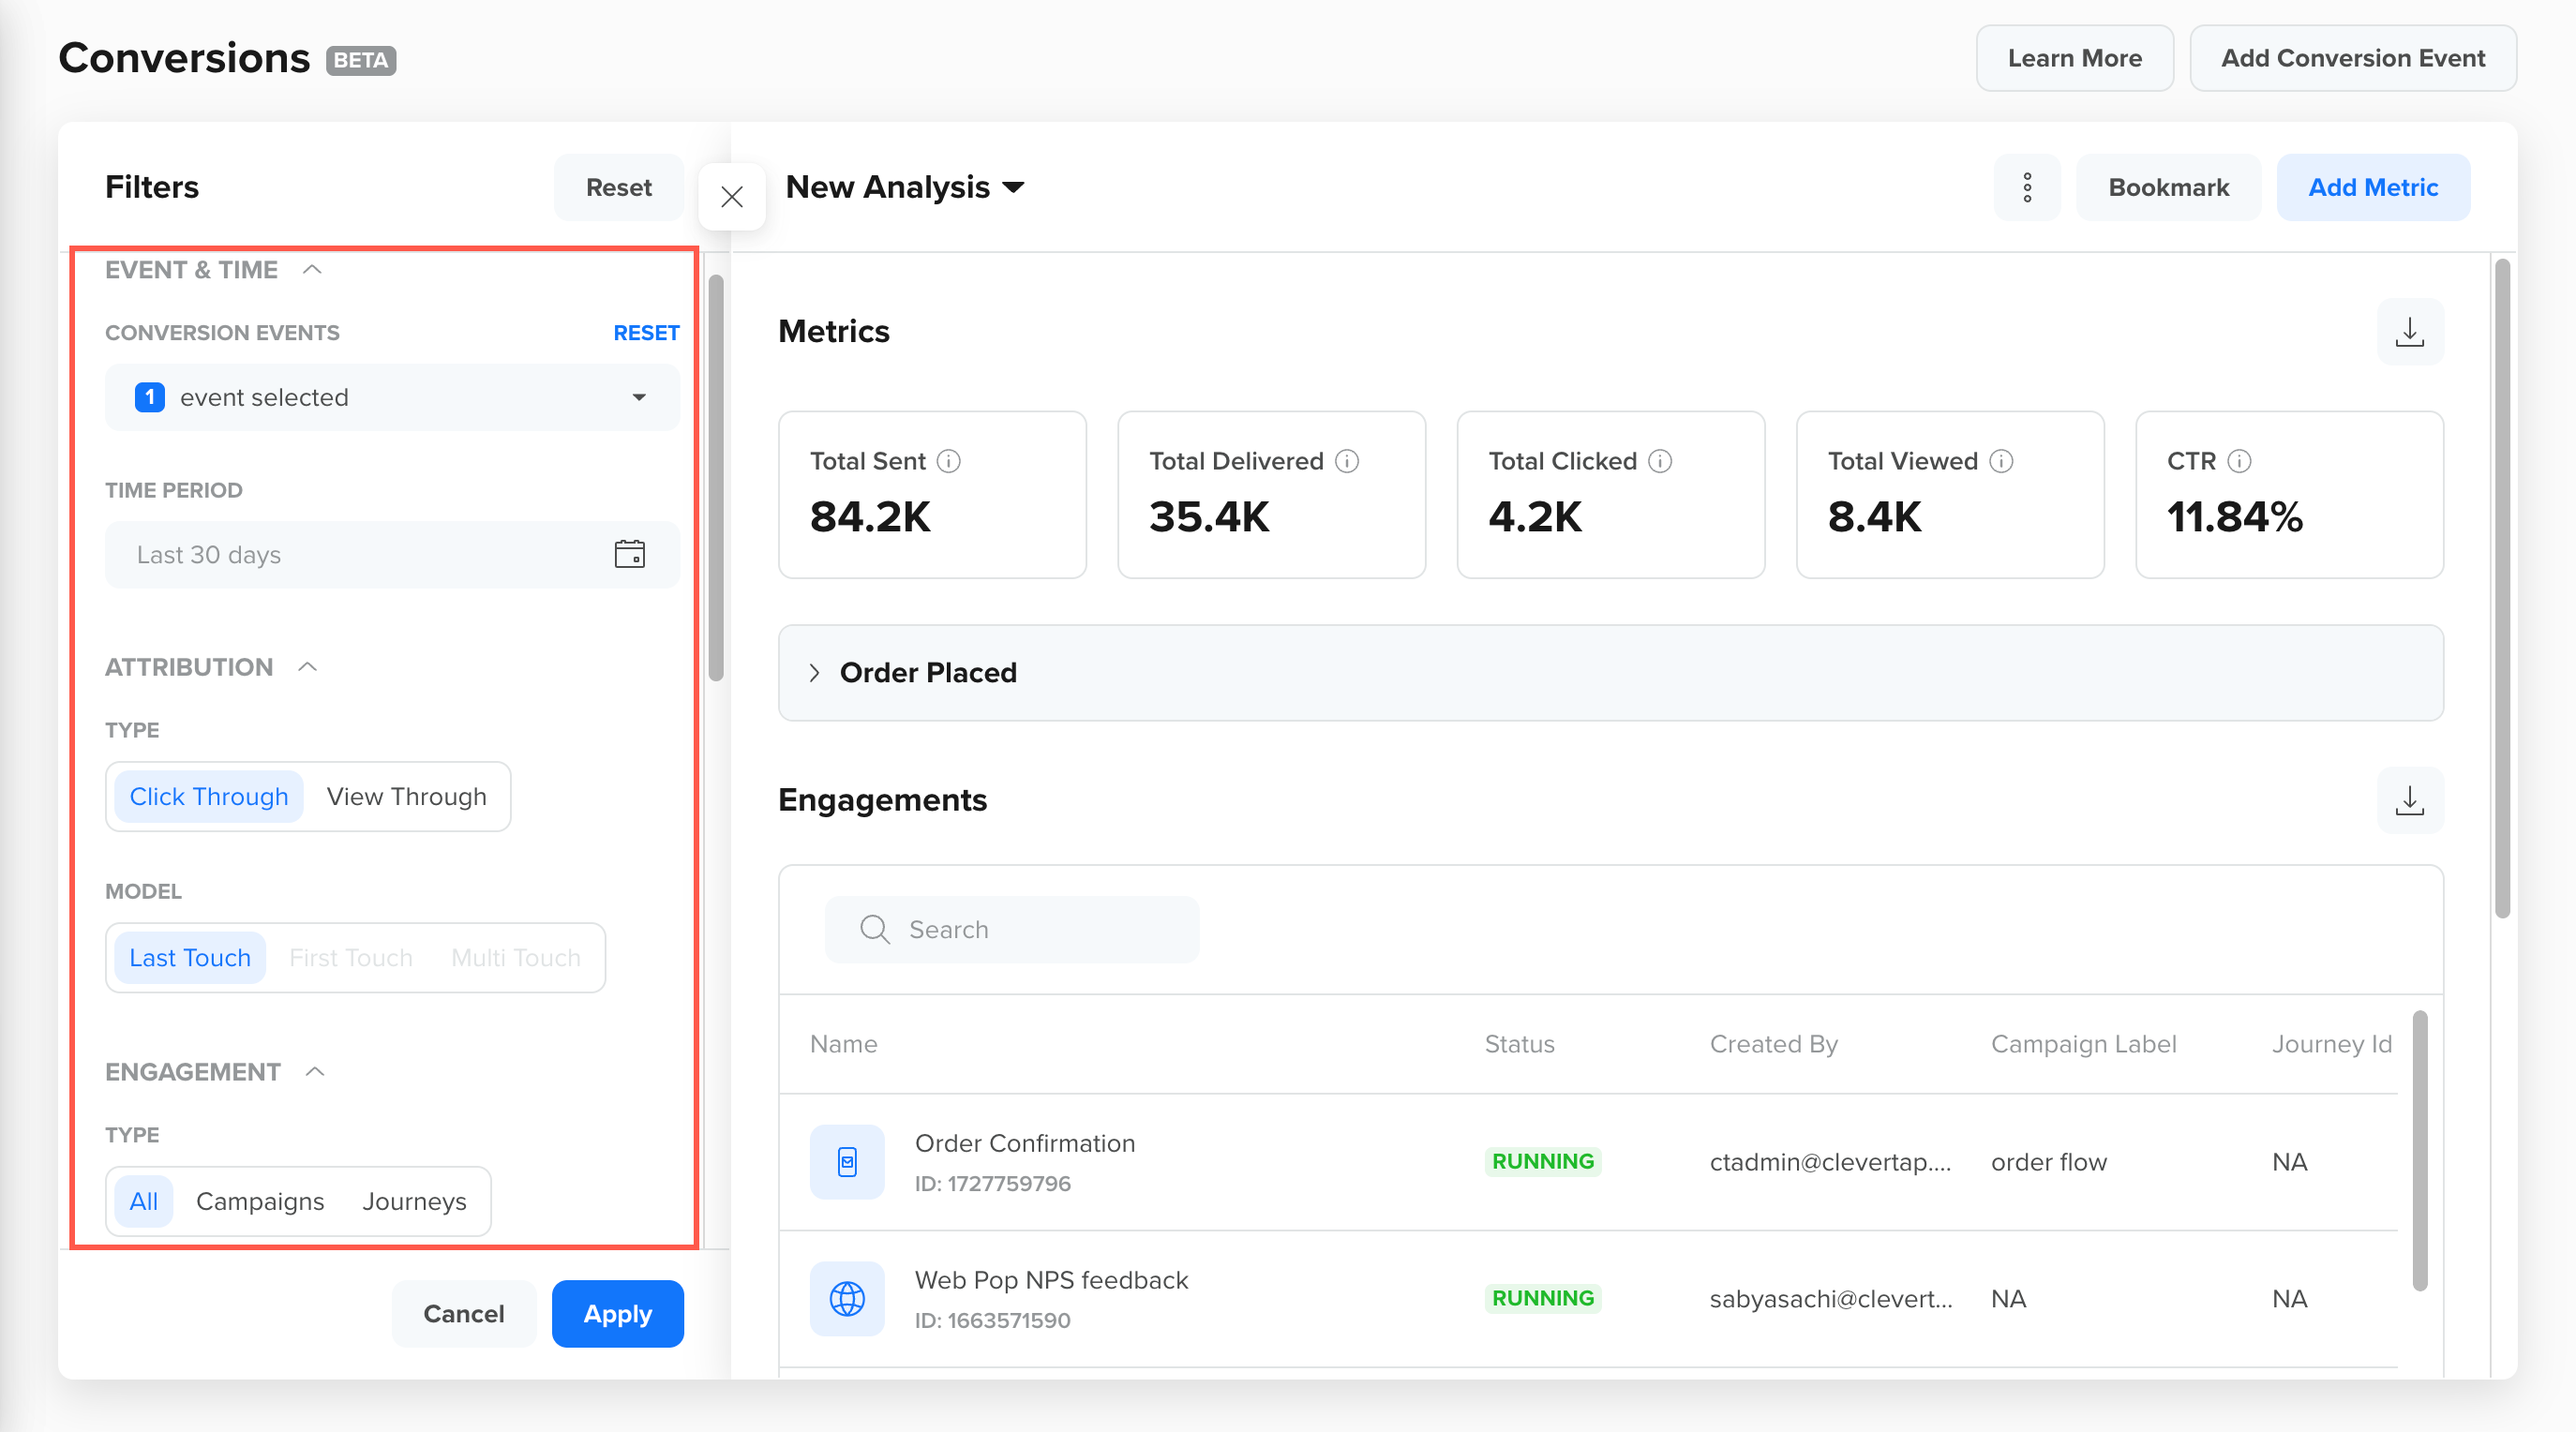
Apply Filters for Conversions Data
The filter fields are organized into the following groups:
Event & Time
| Field Name | Description |
|---|---|
| Conversion Events | Select the conversion events to analyze. Conversions, unique conversions, and conversion rate updates based on the selected event. For example, compare Total Purchases vs Subscription Started. |
| Time Period | Set the date range for analysis. Metrics are filtered by the conversion timestamp, that is, the date and time the conversion event occurred, rather than when the campaign was sent or clicked. This ensures the time period reflects actual conversion activity within the selected window. |
Attribution
| Field Name | Description |
|---|---|
| Type | Select the attribution criteria, such as Click through or View through. |
| Model | Select the attribution model, such as Last touch, First touch, or Multi touch. |
Engagement
| Field Name | Description |
|---|---|
| Type | Toggle between All, Campaigns, or Journeys to scope the analysis to the relevant engagement type. |
| Name or ID | Filter by engagement name or ID. Enter an exact name or ID, or use a keyword to find matching campaigns or journeys. |
Additional Filters
| Field Name | Description |
|---|---|
| Labels | Filter engagements by assigned labels. Group and analyze by themes, for example, Promotional or Onboarding. |
| Channels | Filter by delivery channel, for example, Email, Push, In-App, or SMS. Compare Conversions performance across channels. |
| Created By | Filter by creator. Analyze performance by user or team ownership. |
| Status | Filter by status such as Awaiting Next Run, Running, Paused, Completed, or Stopped. Compare active and historical engagement performance. |
| Delivery Type | Filter by delivery type, such as On Publish, Recurring, or Specific dates. Compare always-on and time-bound engagements. |
After selecting your required filters, click Apply to update the dashboard. To reset all filters to their defaults, click Reset.
Bookmark Conversions Board
Saved Views (also called Bookmarks) let you save a configured filter state so you can return to the same analysis without re-applying filters each time.
Bookmark a View
To save the current filter configuration as a view:
- Apply the filters you want to save.
- Click Bookmark.
- Enter a name for the view. For example, enter
Email Campaigns in Last 30 Days for Total Purchasesto identify the channel, time period, and conversion event at a glance. - Click Save.
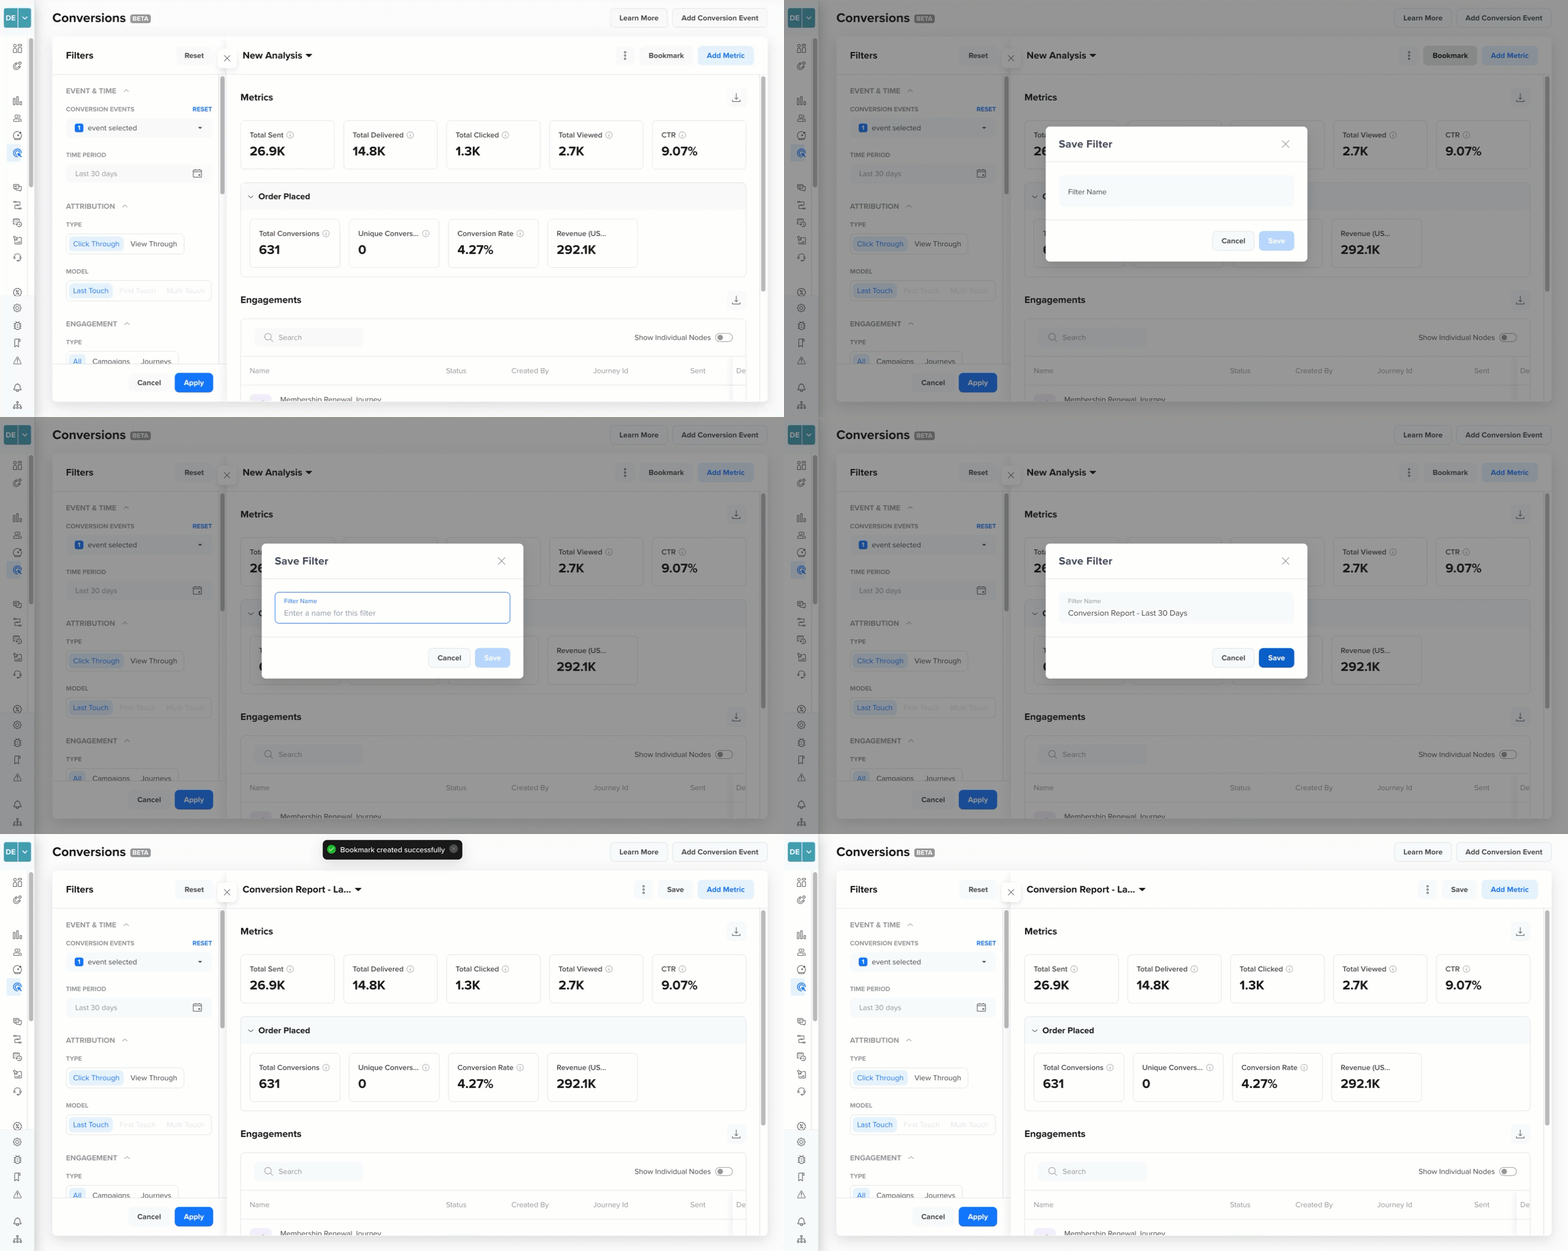
Bookmark a Conversions View
Saved views are public by default, meaning all users with access to Conversions Board in your account can view and use them.
Delete a BookmarkDeleting a saved bookmark removes it for all users. This action cannot be undone. You can rename, duplicate, or delete any bookmark from the options next to the view name.
Understand the Conversions Board
After conversion events are configured, the Conversions Board display campaign performance in two primary sections:
Metric Tiles
The Metrics section provides a summary view of the key performance indicators (KPIs) based on selected conversion events and filters. Use metric tiles to quickly assess overall campaign effectiveness before diving into detailed analysis. This information updates dynamically based on applied filters, selected conversion events, and selected time range.
For example, in the following dashboard, the conversion rate appears healthy, but Total Conversions (35.2K) and Unique Conversions (31.5K) are very close, suggesting that most users converted only once. This could indicate an opportunity to drive repeat conversions.
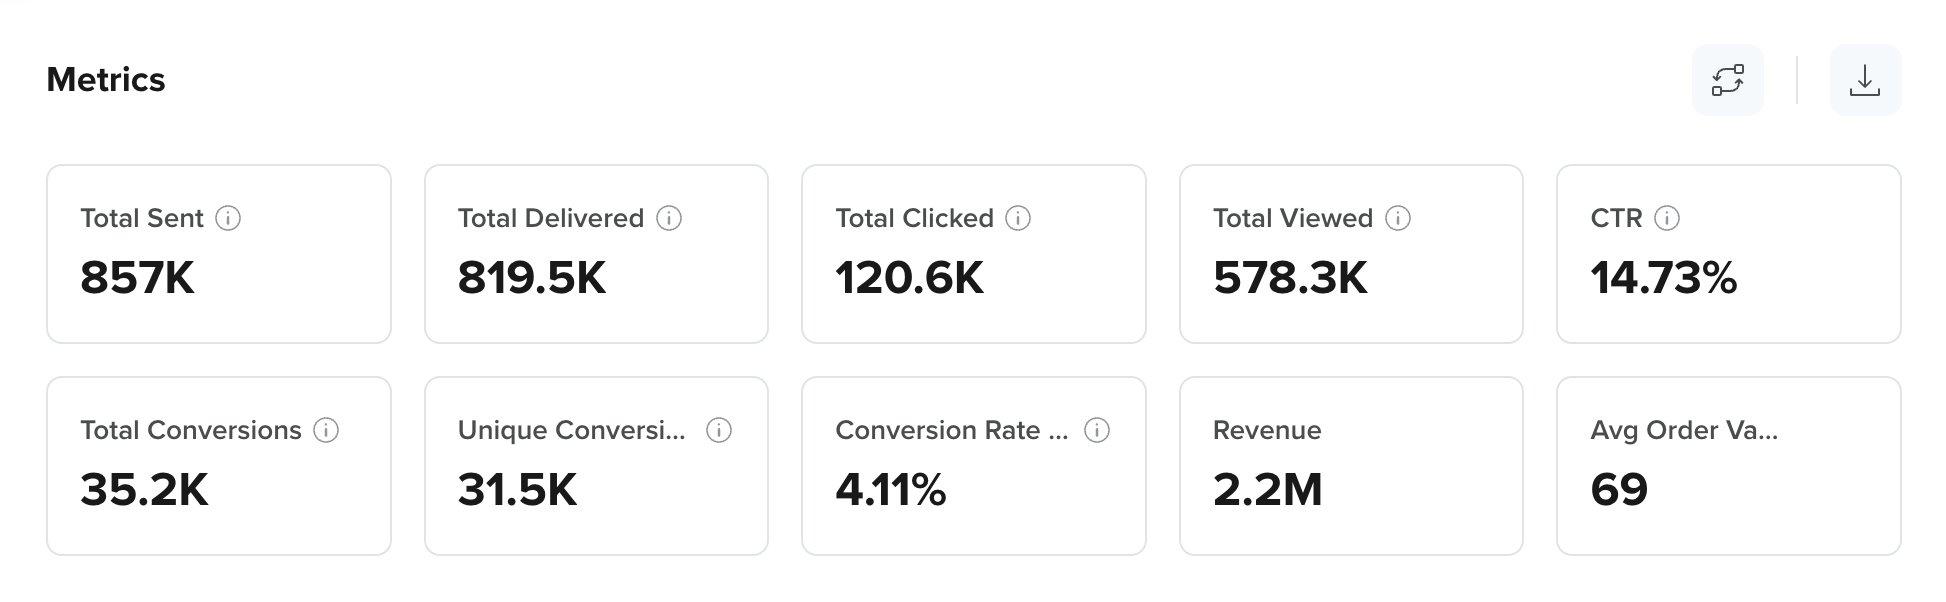
View Conversion Metric Tiles
The Metrics section includes the following default metrics:
| Tile Name | Description |
|---|---|
| Total Sent | Messages sent across selected campaigns. |
| Total Delivered | Messages successfully delivered to users. It also includes push impressions for Push Notifications. |
| Total Clicked | Clicks on campaign messages. |
| Total Viewed | Message views (for supported channels like In-App and Push). |
| CTR | Percentage of delivered messages that received at least one click. |
| Total Conversions | Conversion events attributed to selected campaigns within the lookback window. |
| Unique Conversions | Unique users who completed the conversion event. |
| Conversion Rate Percent | Percentage of delivered (or eligible) messages that led to at least one conversion. |
Engagement Performance Table
The engagement table displays campaign-level performance metrics. This table allows you to identify top-performing and underperforming campaigns at a glance. For example, the top campaigns by conversion count are email campaigns, while push notifications show a higher CTR but a lower conversion rate, which is useful for deciding where to invest future budget.
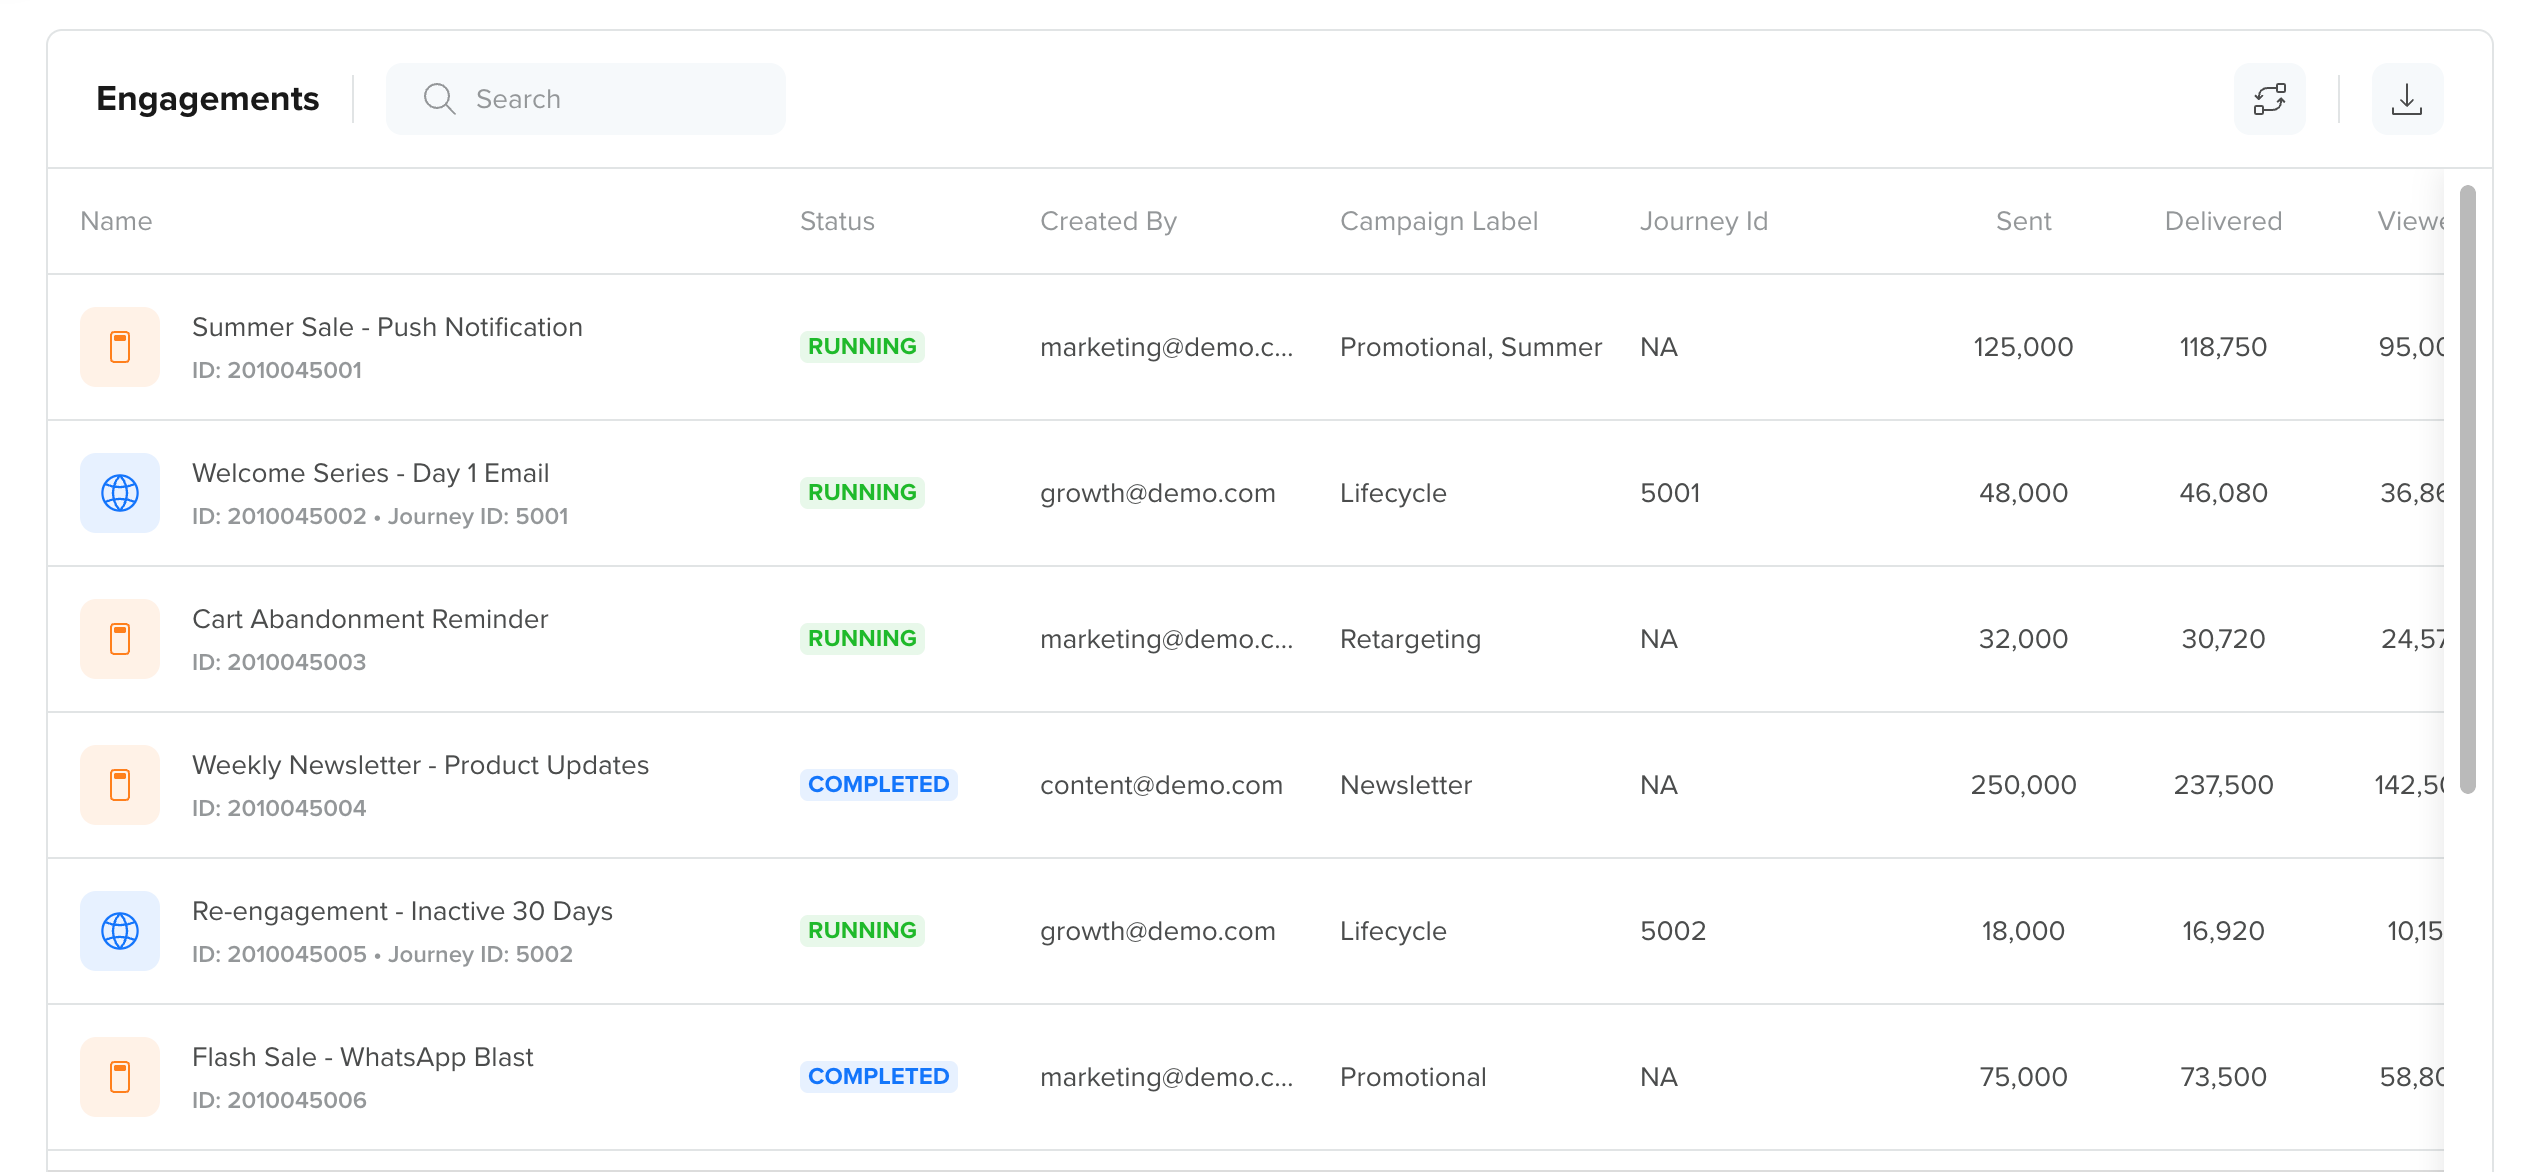
Engagement Performance Table
The following table describes each column in the Engagement Performance Table:
| Field Name | Description |
|---|---|
| Name | The campaign name. (for example, Welcome Email with Offer) |
| Status | The current campaign status (for example, Running or Completed). |
| Created by | The user who created the campaign. |
| Campaign Label | The campaign label for grouping or categorization. |
| Journey Id | The associated journey ID, if available. |
| Sent | Messages sent for the campaign. |
| Delivered | Messages successfully delivered for the campaign. |
| Viewed | Total message views for the campaign. |
| Clicked | Total clicks for the campaign. |
| CTR | The percentage of delivered messages that received clicks. |
| Conversions | Conversion events attributed to the campaign. |
| Unique Conversions | Unique users who completed the conversion event. |
| Conversion Rate | The percentage of delivered (or eligible) messages that led to a conversion. |
| Custom KPIs (if configured) | Custom metrics defined to track business-specific goals (for example, revenue or average order value). |
NoteIn the Engagement Performance Table:
- You can click on any campaign in the table row to open its campaign stats page. This gives you quick access to detailed performance data without leaving the Conversions Board.
- By default, the table is sorted by Conversion Count in descending order, so the highest-converting engagements appear at the top.
- The engagement performance table also includes archived campaigns so that your historical Conversion data remains accessible even after campaigns are archived.
Journey-Level View and Node-Wise Data
When you filter by Journeys under Engagement Type, the Engagements table updates to show journey-level performance. Each row represents a journey, identified by its name and Journey ID.
To view journey performance broken down by individual nodes, enable the Show Individual Nodes toggle. When enabled, each journey expands to show a separate row for every node, so you can compare conversion performance at each step of the journey.
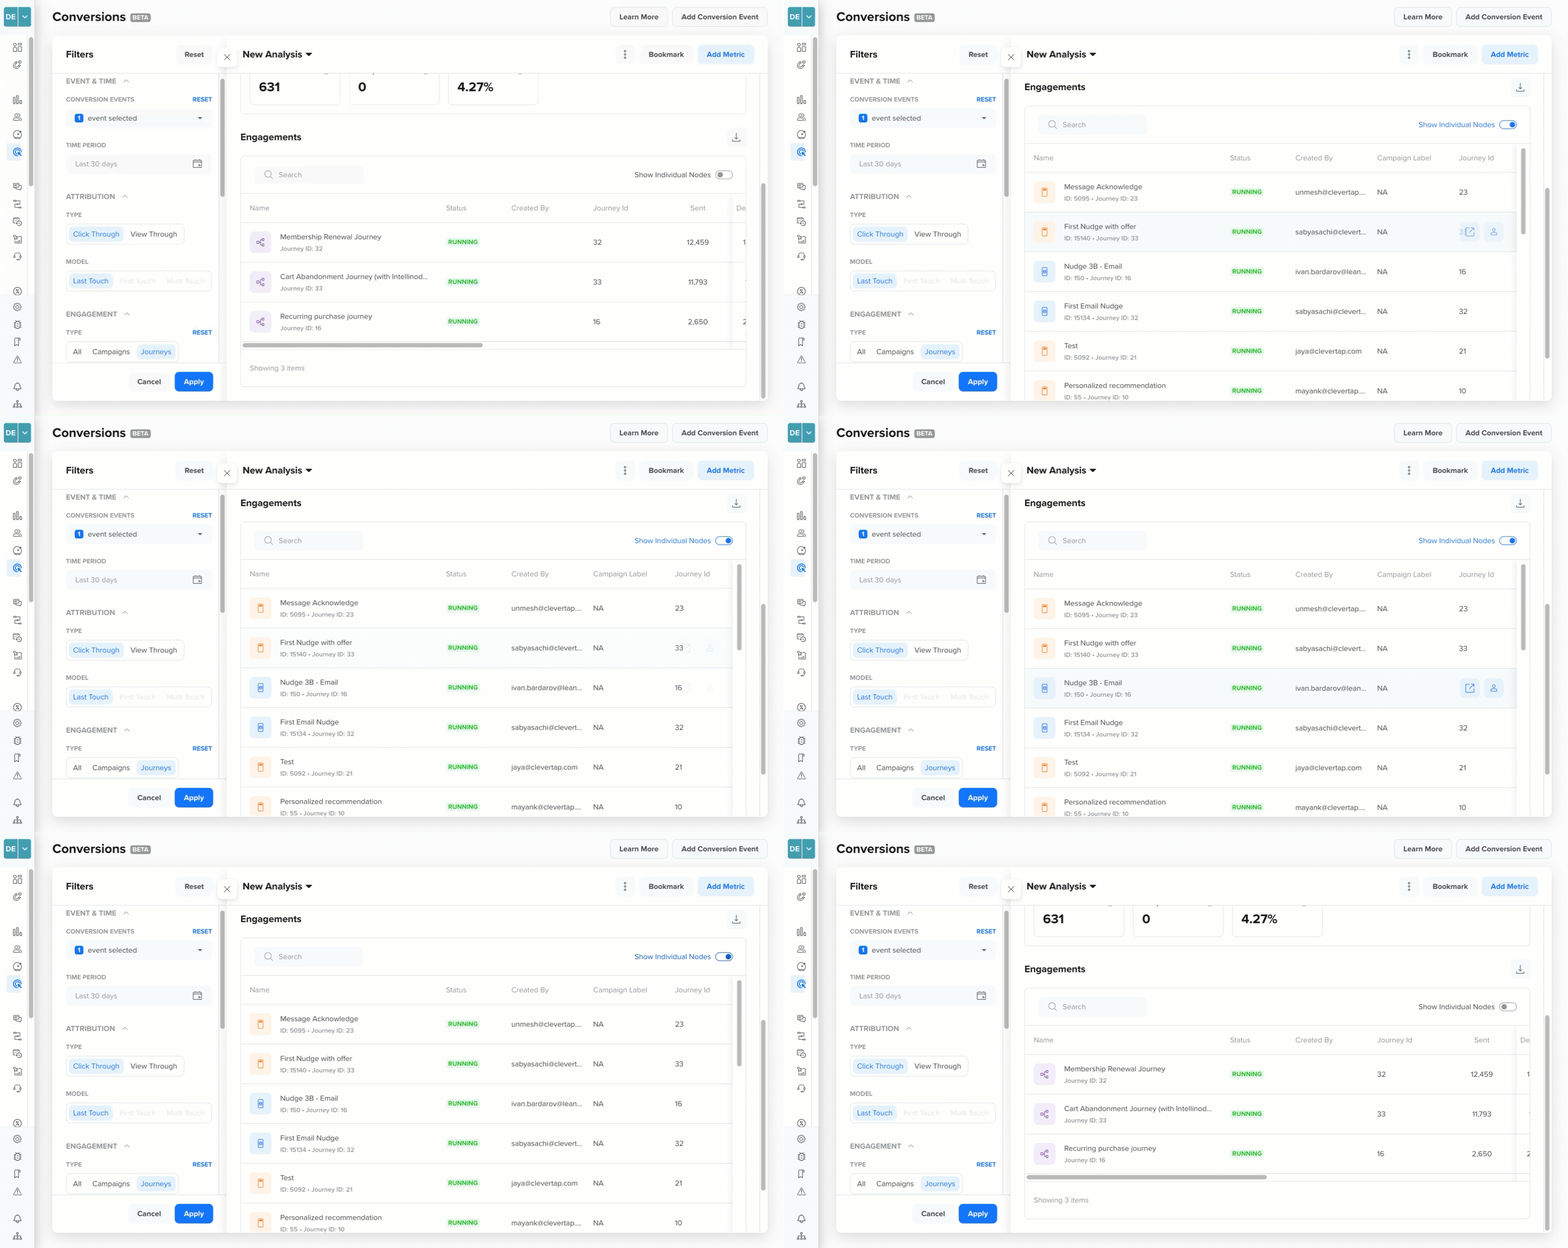
View Journey Node-Wise Data
Custom Metrics
Custom Metrics let you create derived metrics from the engagement and conversion data available in the Conversions Board. These metrics help you track business-specific performance indicators that are not available as default tiles or table columns.
Once created, custom metrics appear as additional columns in the Engagement Performance Table and can be used alongside standard metrics. For example, a Revenue metric calculated using PROPSUM(Purchase.amount)
Create Custom Metrics
To create a custom metric:
-
Click Add Metric in the top-right corner of the Conversions Board.
-
Enter a clear and descriptive name for the KPI. For example, name the KPI as Revenue if you are measuring total purchase value.
-
In the formula builder, select a metric from the list. For example, select
PROPSUMfrom the function list and select the amount property of your Charged event. -
Click Save.
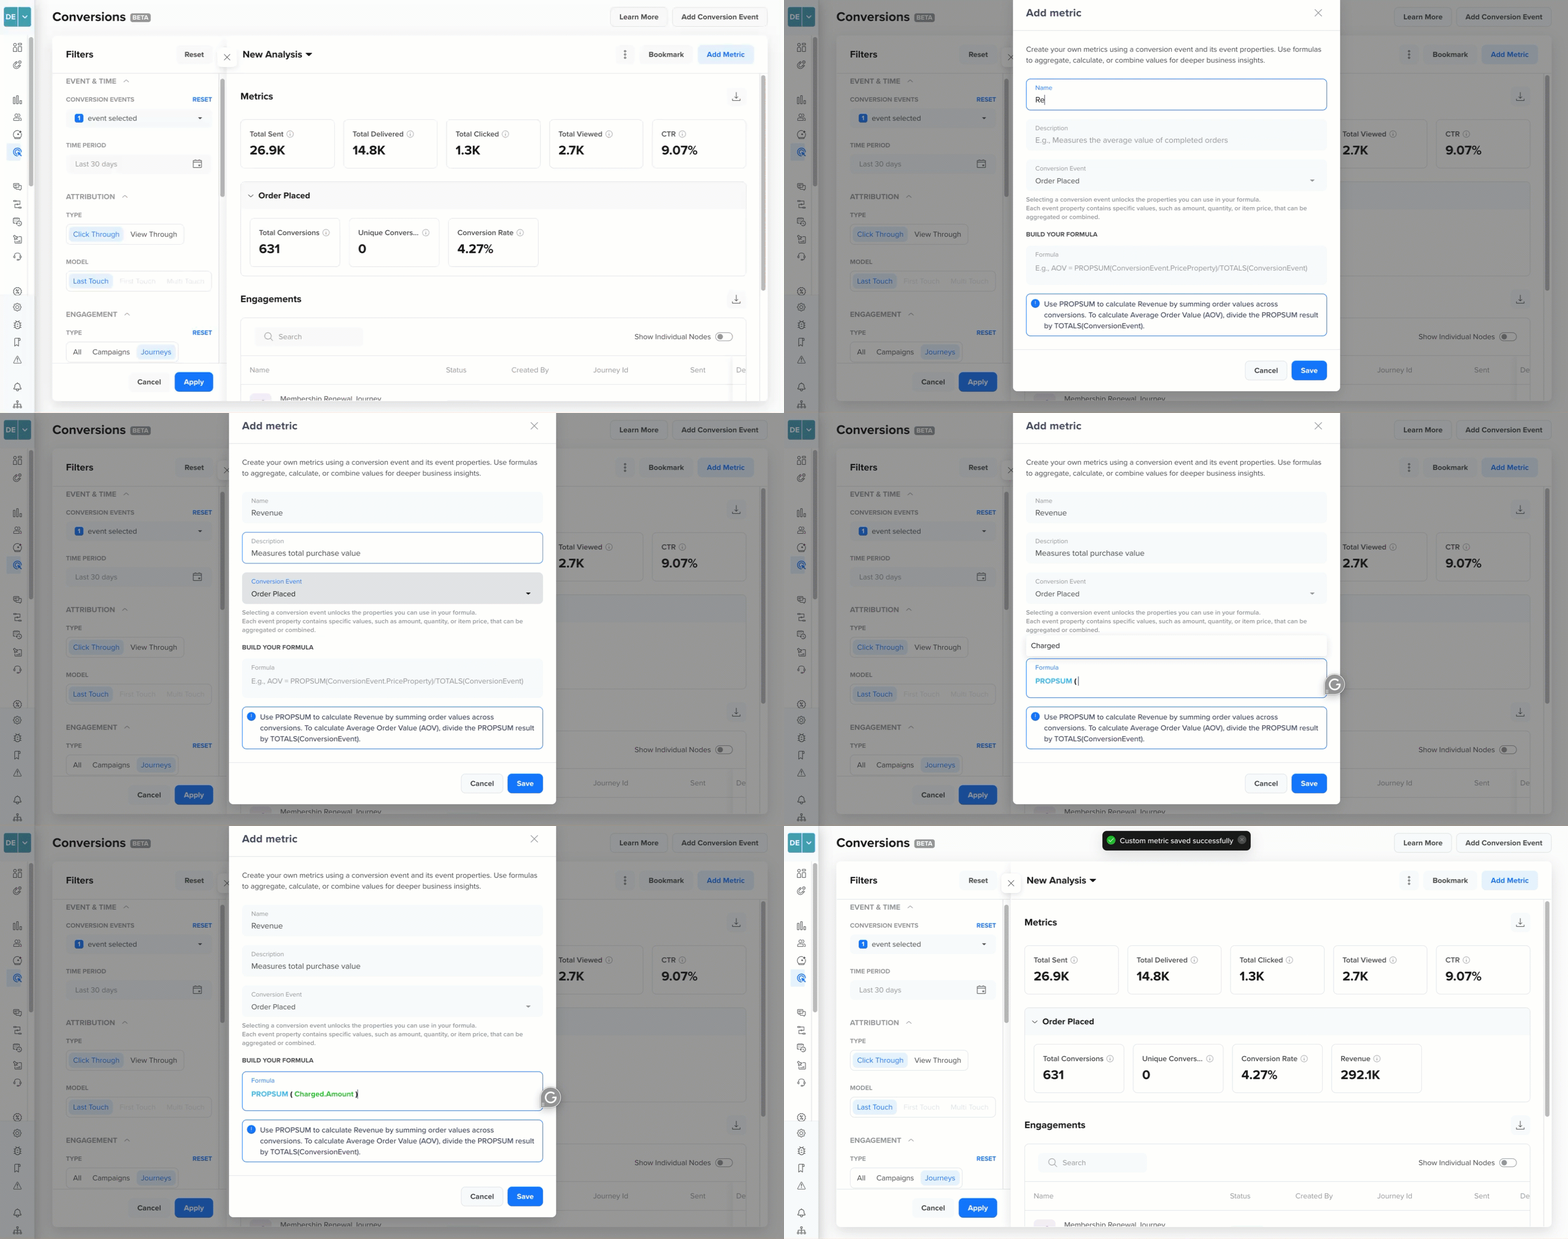
Create a Custom Metric
Public Beta Scope for Custom Metric FormulasDuring public beta, custom metric formulas are built within a single conversion event. Cross-event metrics (for example, revenue per delivered message) and currency or SKU unit labels are planned for a future release.
How Custom Metrics Work?
Custom Metrics are built using formulas based on your configured conversion events and their properties. Using the formula builder, you can apply event-level and property-level functions to conversion event data to compute totals, ratios, averages, or derived values. Custom KPIs are calculated dynamically and update automatically when the filters, selected conversion event, or time range are changed.
The following examples illustrate how Custom Metrics can be built from conversion event data to measure business-specific outcomes:
| KPI Name | Formula | What does it help you measure? | Example |
|---|---|---|---|
| Revenue | PROPSUM(Purchase.amount) | The total revenue generated from all Purchase conversion events in the selected period. It sums up the value of the amount property across every Purchase event occurrence. | If 500 users made purchases of amounts such as $20, $50, and $100, Revenue returns the total purchases. For example, $35,000 for the selected time period. |
| Average Order Value (AOV) | PROPAVG(Purchase.amount) | The average transaction value per Purchase event. It divides the total value of the amount property by the number of Purchase event occurrences, helping you understand what a typical order is worth. | If the total revenue from 500 purchases is $35,000, AOV returns $70, meaning customers spend $70 on average per order. |
| Average Revenue Per User (ARPU) | PROPSUM(Purchase.amount) / UNIQUES(Purchase) | The average revenue generated per unique user who completed a Purchase event. Unlike AOV, which is per transaction, ARPU accounts for users who may have purchased multiple times, giving you a per-user revenue view. | If 300 unique users generated $35,000 in total revenue, ARPU returns approximately $116.67, meaning each converting user contributed $116.67 on average. |
| Profit | PROPSUM(Purchase.amount) - PROPSUM(Purchase.cost) | The net profit from all Purchase events in the selected period, calculated by subtracting the total cost from the total revenue. This helps you evaluate whether your campaigns are driving financially sustainable conversions. | If total revenue (PROPSUM of amount) is $35,000 and the total cost (PROPSUM of cost) is $22,000, Profit returns $13,000. |
| Watch Time | PROPSUM(VideoPlay.duration) | The total content consumption time across all Video Play conversion events in the selected period. Useful for media and OTT platforms measuring engagement depth alongside conversion rate. | If users collectively streamed 50,000 minutes of content, Watch Time returns 50,000. |
| Policy Premium | PROPSUM(PolicyIssued.premium) | The total premium value generated from all Policy Issued conversion events. Useful for BFSI and insurance platforms measuring the revenue impact of engagement campaigns. | If 200 users issued policies with an average premium of $12,000, Policy Premium returns $24,00,000 for the selected period. |
Custom Metric Aggregation at the Journey LevelCustom metrics are calculated at the journey-node level during public beta. Aggregated custom metric values at the overall journey level are not yet available and will be added in a future release. If you view Conversions Board with the journey toggle enabled, custom metric columns display node-level data only.
Formula Functions
When creating a Custom Metric, you can use predefined event-level and property-level functions to build meaningful business metrics. These functions must always be written in uppercase.
Event-Level Functions
These functions operate on the selected event and measure the event's frequency or user participation:
- TOTALS: Counts every occurrence of the selected event during the chosen time period. For example, if an event such as
Video Playedoccurred 12,000 times, TOTALS returns 12,000 even if the same user triggered the event multiple times. - UNIQUES: Counts the number of distinct users who performed the selected event. For example, if 2,000 unique users triggered the event, UNIQUES returns 2,000 and each of the users is counted only once, regardless of how many times they performed the event.
- AVERAGE: Shows the average number of times each unique user performed the selected event. For example, if 3,000 users triggered the event 15,000 times in total, AVERAGE returns 5 events per user. This can also be derived using TOTALS / UNIQUES.
Property-Level Functions
Property-level functions operate on numeric event properties such as revenue amount, duration, quantity, or price. These functions are available only when a numeric event property is selected.
- PROPSUM: Adds up the total value of the selected numeric event property across all event occurrences. For example, if you select the
amountproperty for a purchase event, PROPSUM returns the total revenue generated in the selected period. - PROPAVG: Calculates the average value of the selected numeric event property per event occurrence. For example, if you select the
durationproperty for a video event, PROPAVG returns the average watch time per video play. This can also be derived using PROPSUM / TOTALS.
Formula Guidelines
When creating a custom metric, keep the following in mind:
- You can combine available metrics using operators such as +, -, *, /, and parentheses ().
- The formula must be mathematically valid.
- KPI names should clearly describe the metric being calculated.
- Custom Metrics are calculated per campaign row in the table.
Operations
You can edit or delete any existing metric directly from the Conversions Board.
Export
Conversions Board lets you export both the Metrics summary and the Engagements table as CSV files for offline reporting and analysis. Each section has its own export option.
Export Metrics Tiles Data
To export the Metrics tile data:
- Click the export icon in the top-right corner of the Metrics section.
- Enter a file name. For example, Conversions Report - Last 30 Days.
- Under Columns to export, select the specific metrics you want to export.
- Review the selected columns, and click Apply.
- Click Download.
- Click Save to confirm the download. The export CSV file downloads directly to your device.
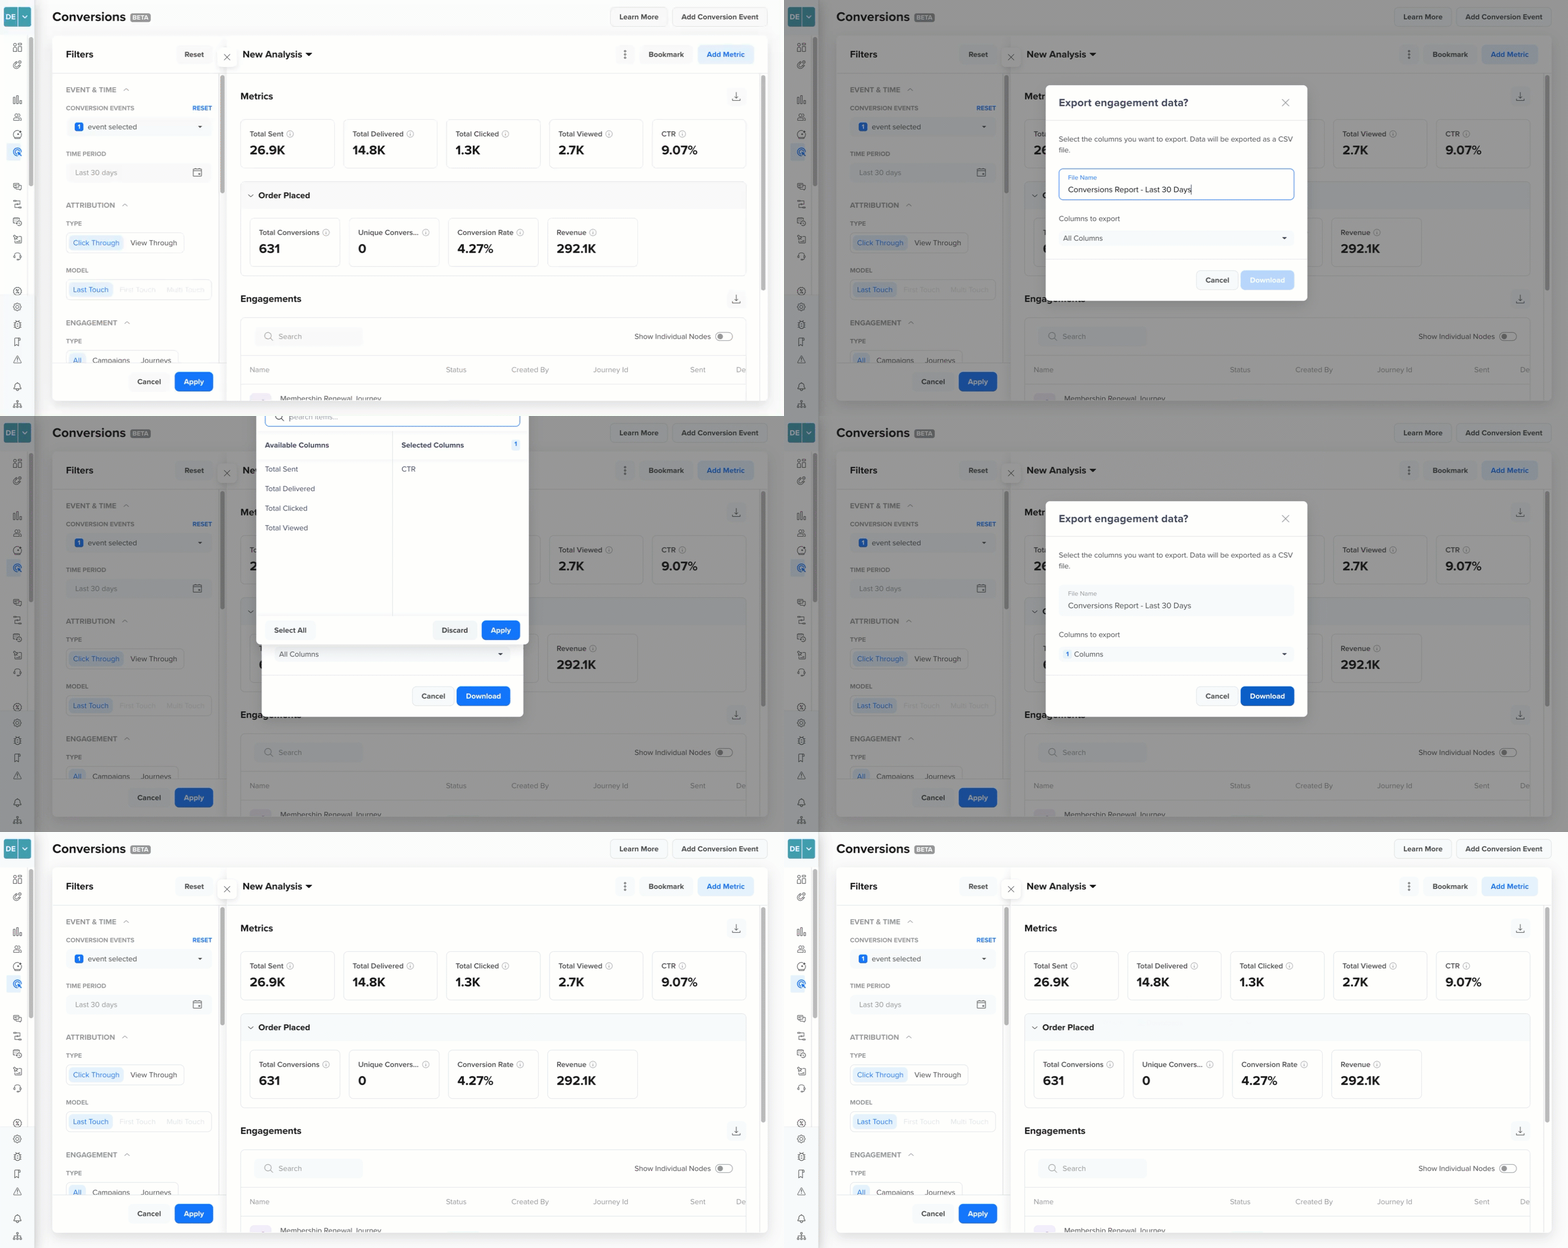
Export Engagement Metric Data
Export Engagement Performance Data
To export the Engagements table data:
- Click the export icon from the Engagements section.
- Click Export to confirm. The exported CSV is sent to your registered email address.
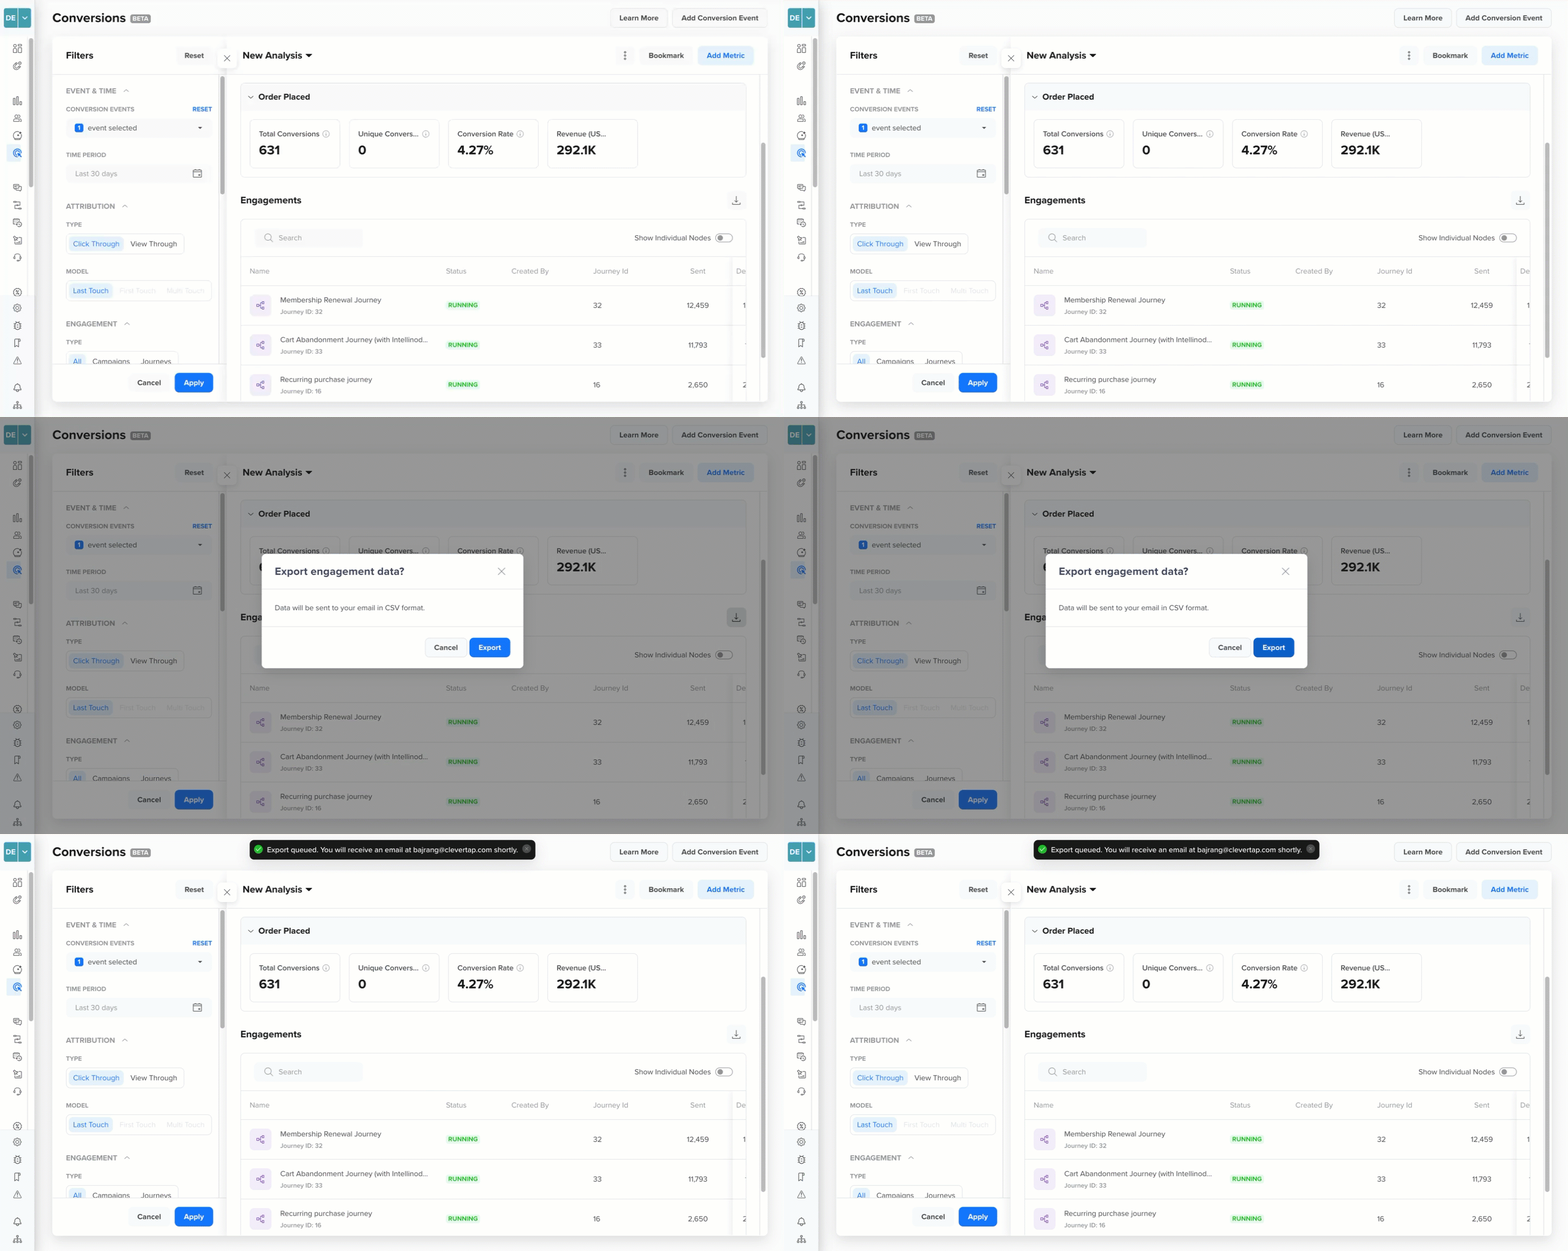
Export Engagement Table Data
NoteBoth exports reflect the current filter state and selected conversion event. Only data visible under your active filters is included in the export.
Edit
To edit a custom metric:
- Click the
 icon next to the metric name you want to edit.
 - Update the Name, Description, or Formula as needed.
- Click Save.
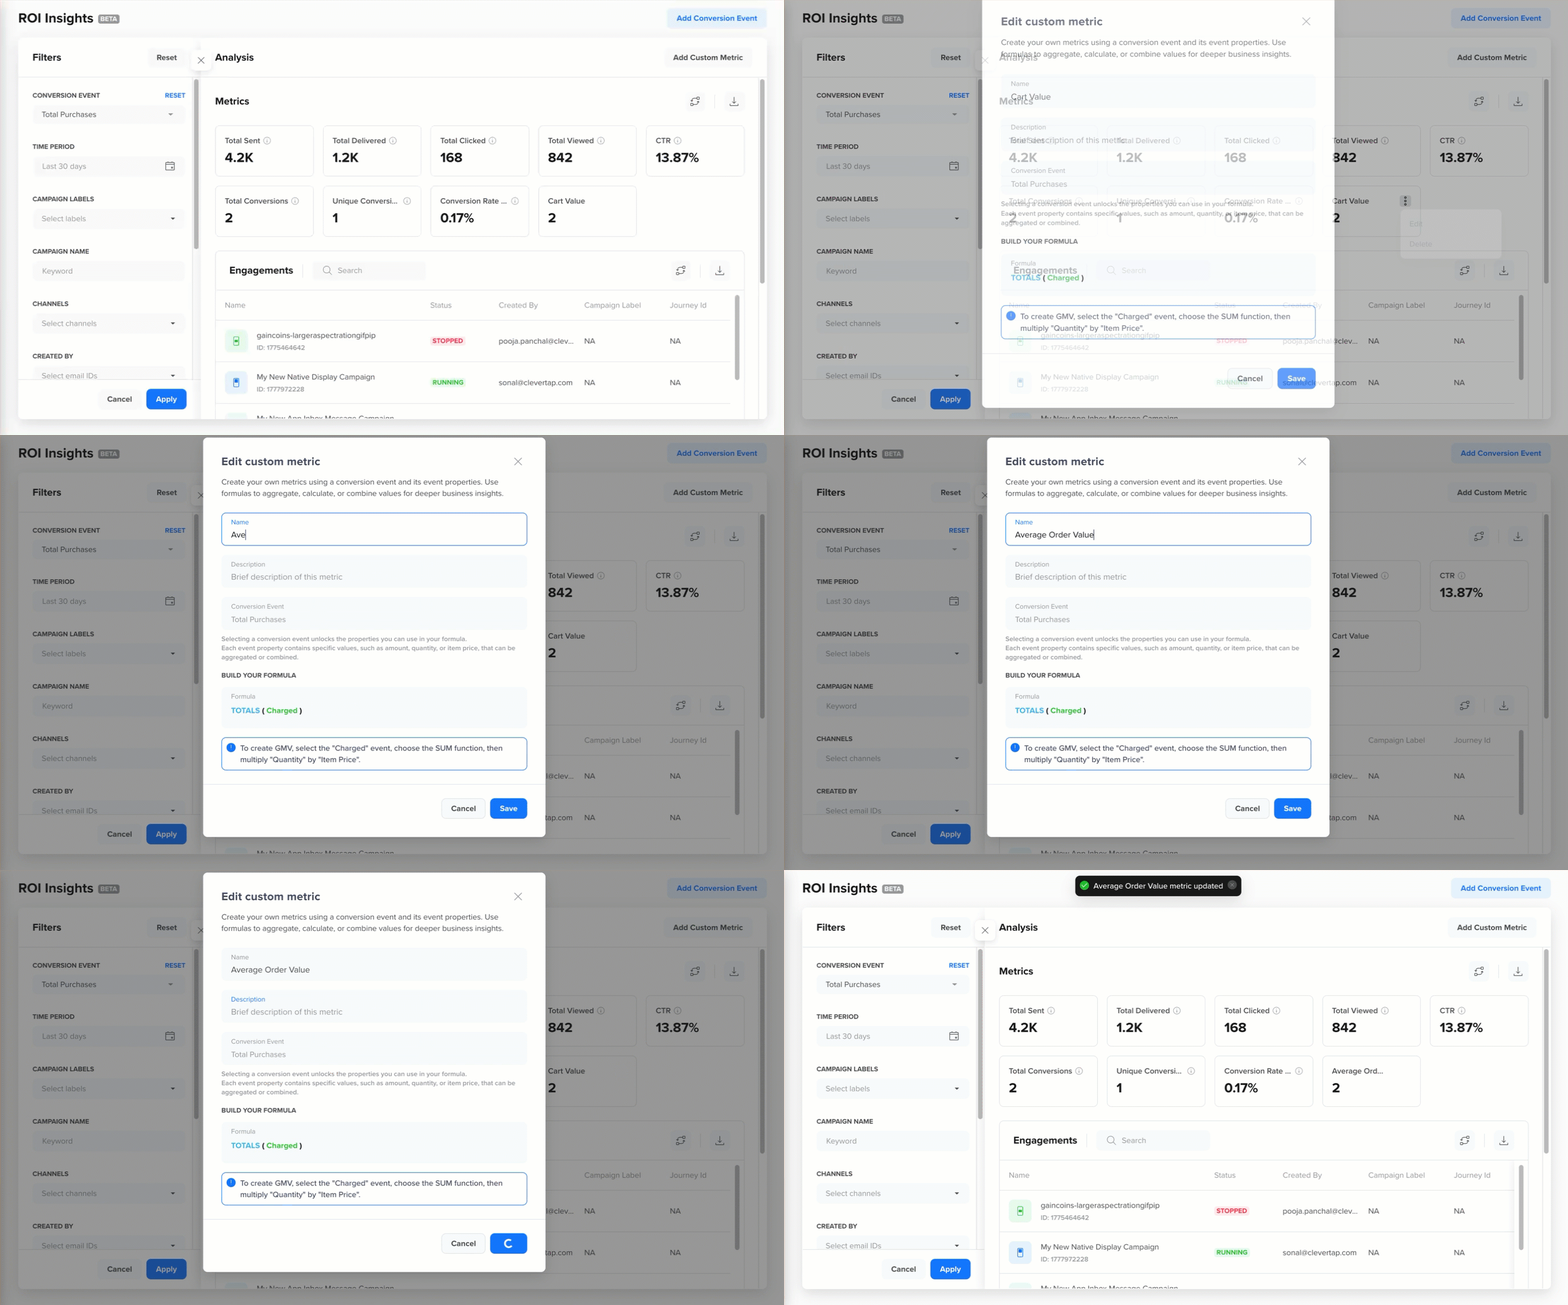
Edit a Custom Metric
Delete
To delete a custom metric:
- Click the icon next to the metric name you want to delete.
- Click Delete.
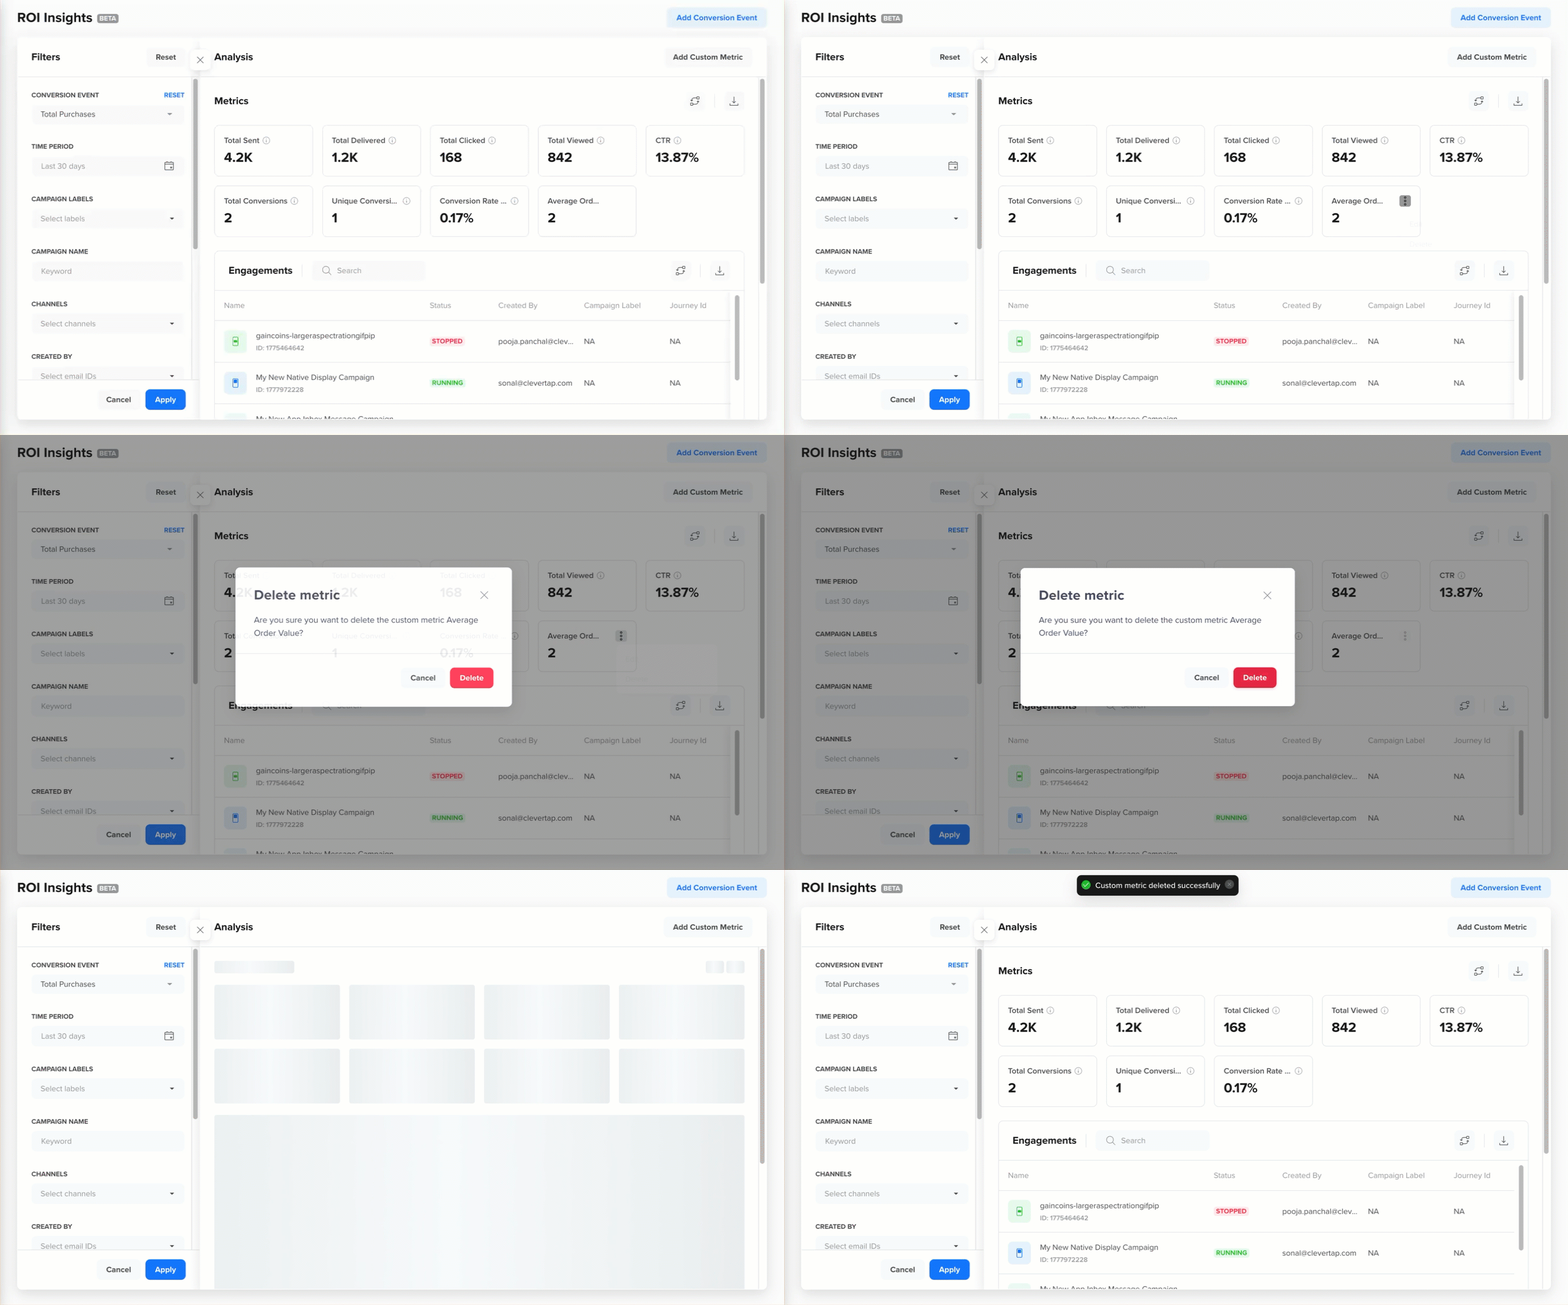
Delete a Custom Metric
Best Practices
Follow these best practices to ensure that your Conversions analysis remains accurate, actionable, and aligned with your business objectives
- Define conversion events aligned with business goals.
- Use revenue events when analyzing financial impact.
- Apply filters before drawing conclusions.
- Limit custom metrics to meaningful business metrics.
- Regularly review and refine lookback windows.
FAQs
Find answers to the following common questions about using Conversions Board:
How many conversion events can I configure?
You can configure up to five conversion events.
Can I track revenue without defining a revenue property?
No. Revenue metrics require a numeric property associated with the conversion event.
Do filters affect exports?
Yes. Exports reflect the current filter state and selected conversion event. For more information, refer to Export Engagement Data.
Can I compare multiple conversion events at once?
Yes. You can select multiple conversion events simultaneously. Each selected event appears as its own set of columns in the Engagement Performance Table, so you can compare performance across events side by side.
What attribution model does Conversions Board use?
Conversions Board uses a Last Touch Attribution model based on the most recent Notification Clicked or Notification Viewed event prior to conversion. For more information, refer to Attribution Model.
Can I use a different attribution model?
Currently, Conversions Board supports the Last Touch attribution model, and the other attribution models, such as First Touch and Multi Touch attribution (including Linear/Equal, Time Decay, and Custom Values splits), are coming soon.
Are conversion goals campaign-specific?
No. Conversions Board uses account-level conversion events configured. These apply across all campaigns and journeys in your CleverTap account.
Why is my Campaign Stats conversion count higher than the Conversions Board?
Campaign Stats counts influenced conversions. This means a single conversion event can be credited to multiple campaigns if the user interacted with more than one. Conversions Board uses true attribution, in which each conversion is credited to exactly one campaign or journey, based on the selected attribution model (for example, last touch). This means the total conversion count in the Conversions Board will be lower than the sum shown in individual Campaign Stats pages.
Updated about 2 months ago