Flows
Overview
Flows provide the capability to understand the ways a user navigates through an app giving a broad view of the common paths users take as well as where they get stuck.
Flows offer two types of analysis:
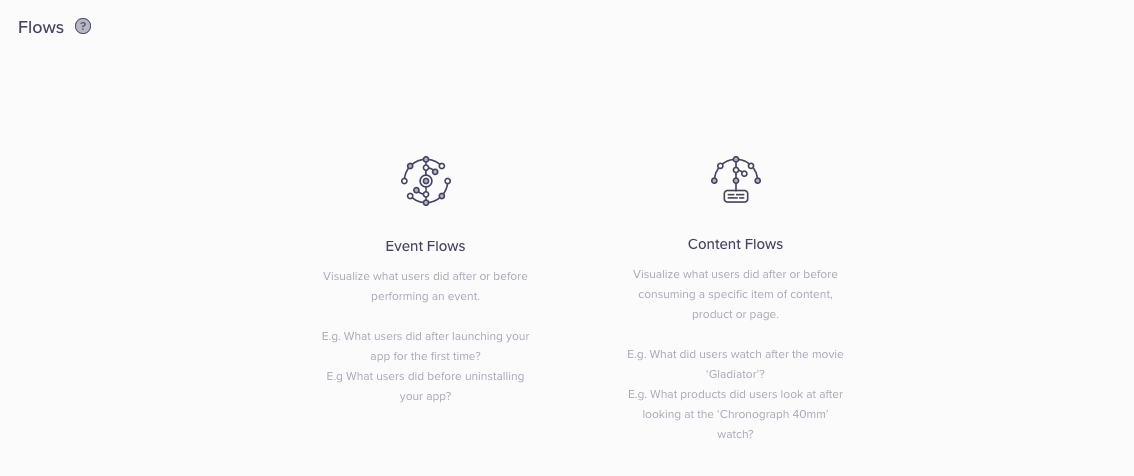
- Event flows: What users did before or after performing an event.
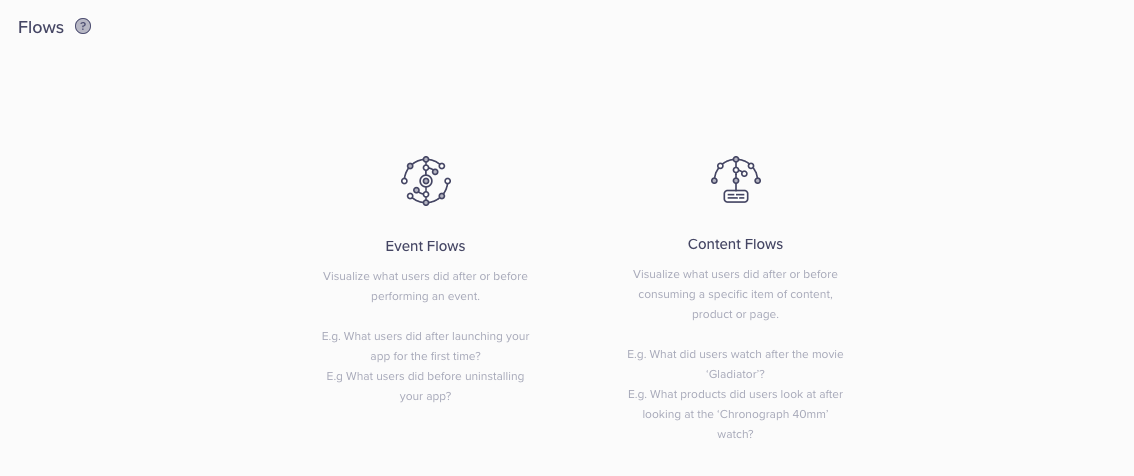
- Content flows: What users did before or after consuming a specific content, product, or page.
Flows let you isolate almost any user journey beginning, ending, or including specific events completed within a defined conversion timeframe, as well as filter flows by any specific segment of users.
Flows Video Tutorial
Discover the video tutorial for the Flows overview and a sample use case.
Event Flow Setup
To get started with events flows:
- Navigate to the Analytics tab in the CleverTap dashboard.
- Select Flows > Event Flows.
Event Flow Setup
Analyze Users Actions Before or After an Event
The most common type of analysis is to look at all the different paths users take after they launch your application; however, you can select any event as the starting point of a user flow.
Marketing Effectiveness Analysis ExampleIf you want insight into what your users do in your app after receiving one of your marketing push campaigns, you can select the CleverTap system event Notification Clicked which gets recorded each time a user clicks on a campaign. From there, you can see all the events a user performs after clicking on a push notification giving you direct insights as to the effectiveness of your marketing activities.
Uninstalls Analysis ExampleYou can analyze the types of events users perform before they uninstall your app giving you insights such as spam campaigns or a specific page view that leads to uninstall.
Building the Event Flow
Pick Start of Flow
When picking the start of a flow, you can:
- Select up to three events as the start of the flow.
- Analyze what users did after or before the events you picked.
Pick Events to Analyze
When picking events to analyze, you can:
- Select up to 16 events to be a part of the flow.
- Select all events you want to analyze as a part of the flow you are building.
- Choose to split an event by its property.
- For an event split by property, view up to 50 properties of the event in the flow.
Conversion Flow Analysis ExampleIf you are analyzing a conversion flow where the product viewed is split by property category, you can analyze which category of product your users are viewing before converting vs. which category your users view after dropping off.
Optional End of Flow
With the optional end of the flow, you can:
- Select up to three events to end the flow with.
- End the flow when the event (or events) occurs.
Look Ahead Window
With the look ahead window, some things to consider include:
- You can select the time window you want your flows analyzed.
- The analysis will contain only users who completed the set of events within that window.
- Shorter conversion times reduce the number of users who will be included in the output.

Look Ahead Window
Reading Flow Chart
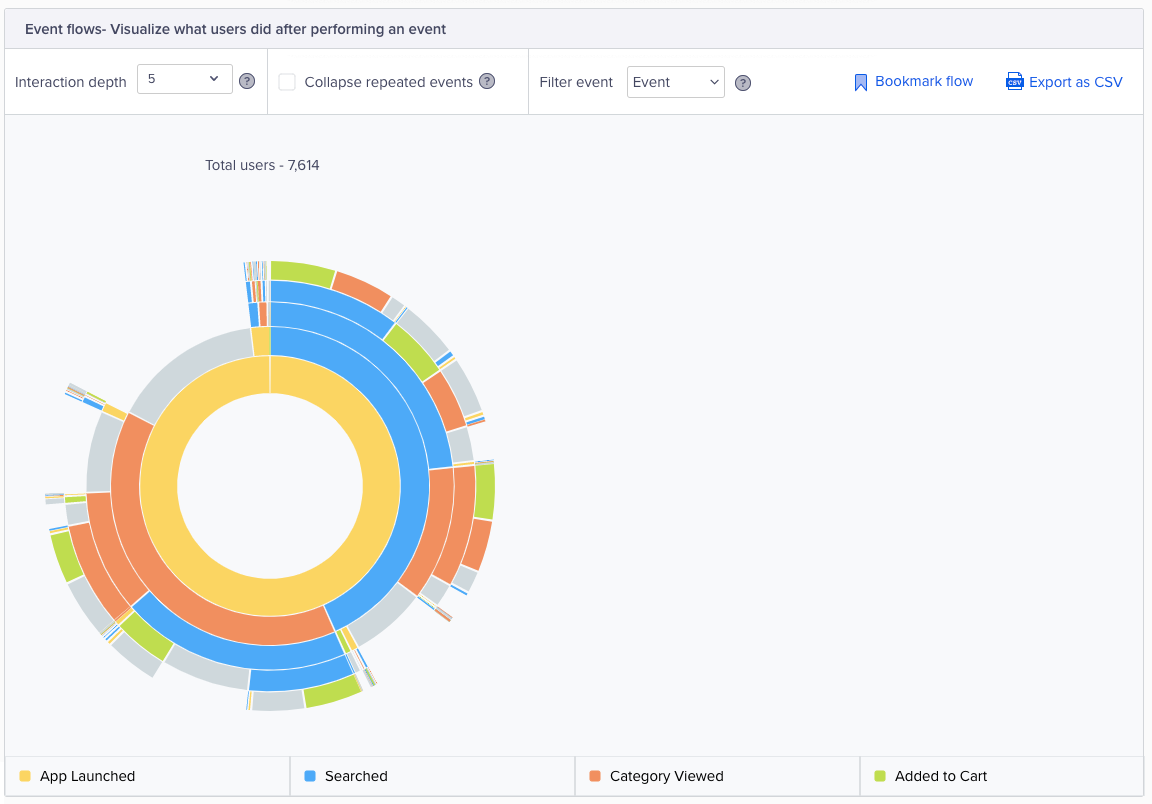
The output of the flow analysis takes the form of a sunburst chart.
Each concentric circle in the chart represents successive steps in the user’s journey. At the center of the chart is the total number of users included in the analysis, such as the example below that shows 1.2 million users.
Each outward ray in the sunburst represents a different flow that users took. Hovering over the concentric circles highlights and isolates a different ray or path through the app as well as tells you how many users this flow represents.
Read Flow Chart
Filters
The filters include:
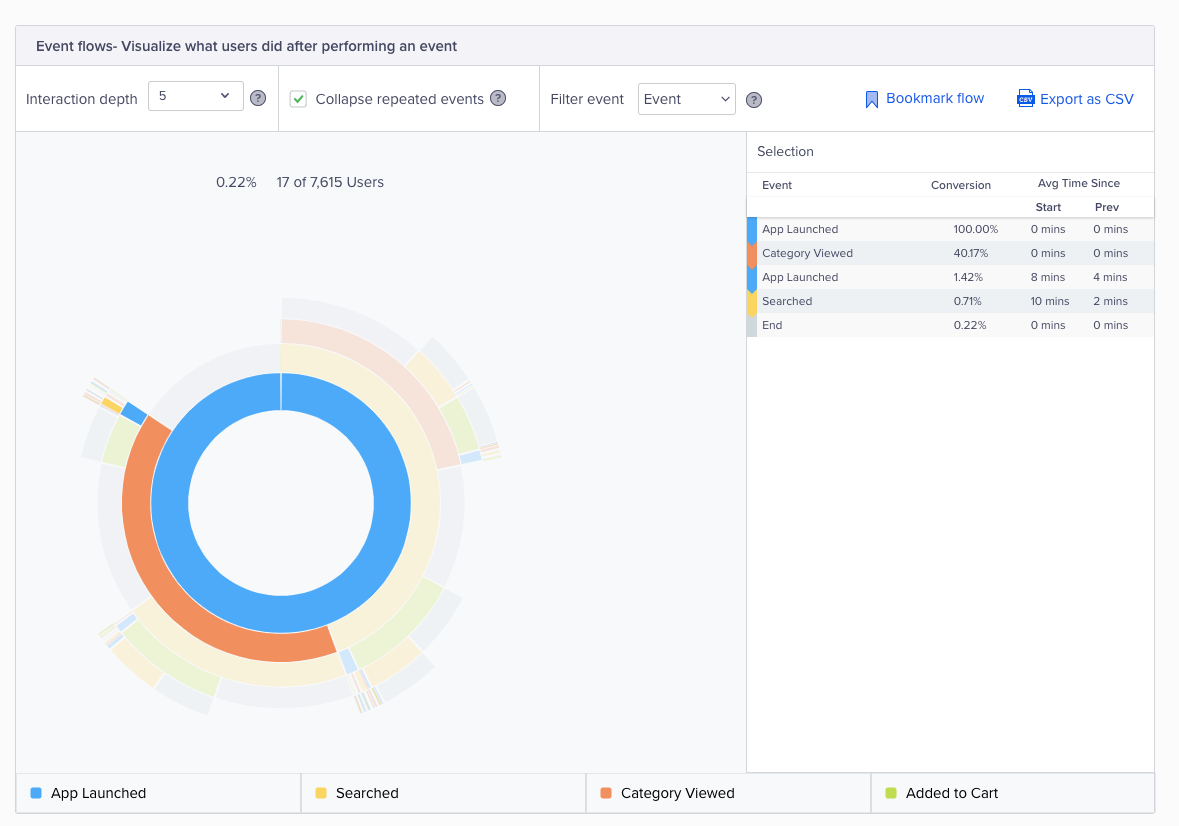
- Interaction depth defines the complexity of flows by picking the number of steps up to a maximum of 20 steps.
- Collapse repeated events simplifies the visualization of flows by collapsing any event that happens multiple times in succession into a single element of the chart. For example, if a user were to perform the same event in rapid succession with no other activity in between (App Launch > App Launch > App Launch) rather than rendering this as three successive App Launch events, this option collapses these (visually) into a single instance.
- Filter event removes events that you do not want to analyze in the flow. You can add them back by using the same filter.
- Hover on step provides you the ability to see the percentage of users progressing from one step to the next and the total elapsed time it takes which is displayed in a table next to the chart.
Filter Event Flows
Set Up a Content Flow
To get started with content flows:
- Navigate to the Analytics tab in the CleverTap dashboard.
- Select Flows > Content Flows.
Set Up Content Flow
Analyze Users Actions Before or After Consuming a Content, Product, or Page
The most common type of after analysis is to look at all the different videos the users watch after they watch a specific video.
The most common type of before analysis is to look at all the different products the users add to their cart before they add a specific product to their cart.
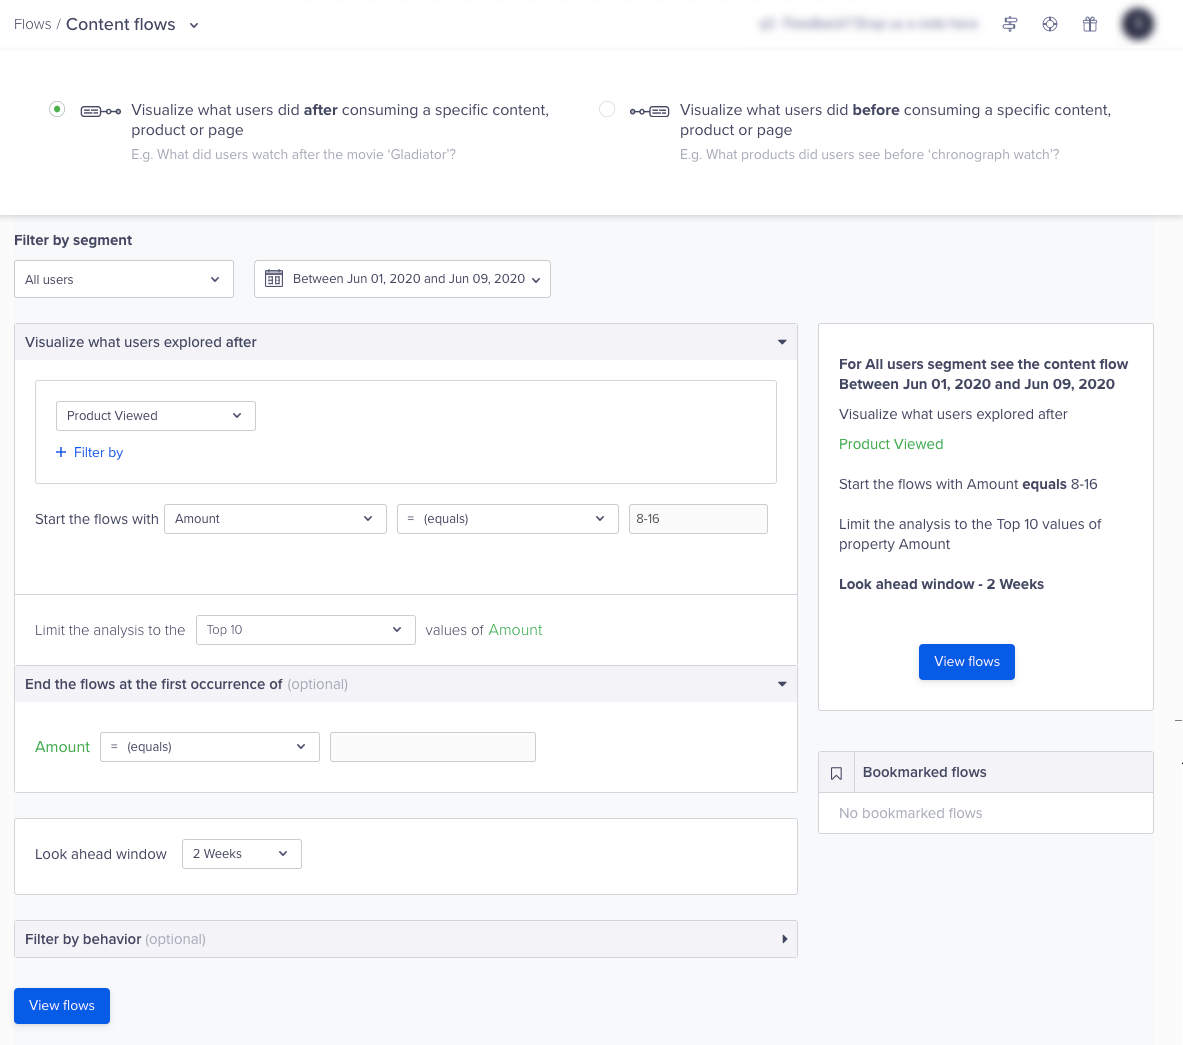
Analyze Before or After Actions of Users
Content Flow Setup
Pick Start of Flow
When picking the start of a flow, you can:
- Select the event and the property value you want to start the flow with.
- Analyze what users did after or before the event property value you picked.
ExamplesSome examples include: Event Video Watched, Property video name, or Value Star Trek episode 1.
Optional End of Flow
With the optional end of the flow, you can:
- Select the property value you want to end the flow with.
- End the flow when the said value occurs in the flow.
ExampleAn example is to end the flow on the first occurrence of Doctor Who episode 10.
Look Ahead Window
With the look ahead window, some things to consider include:
- You can pick the time window you want your flows analyzed.
- The analysis only contains users who completed the set of property values within that window.
- Shorter conversion times reduce the number of users who will be included in the output.
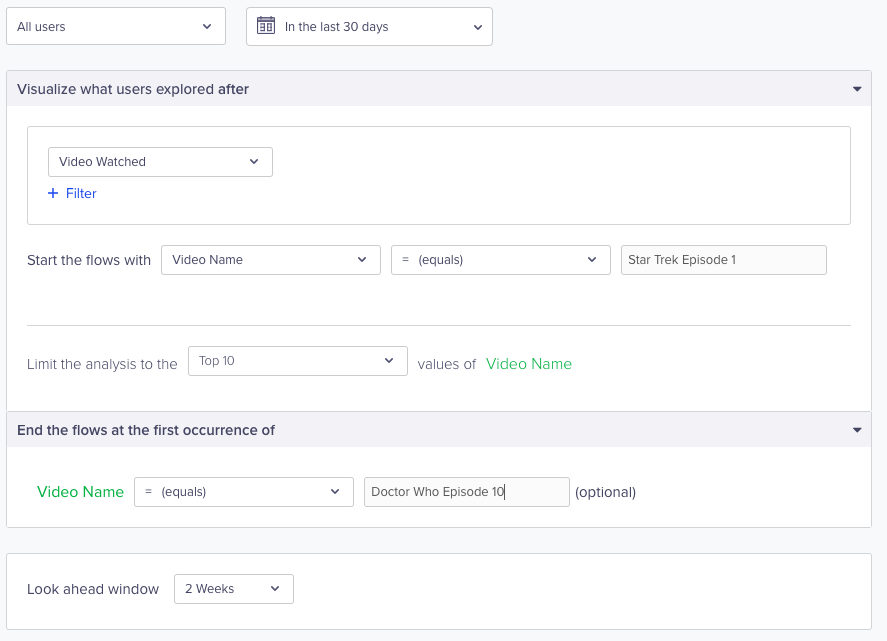
Look Ahead Window
Reading Before FlowsWhen analyzing what a user did before an event (i.e., show me the event that happened before App Uninstall), the flow chart is inverted. In this case, the innermost concentric circle is the last step in the user journey.
This inverted visualization better highlights the steps that happened immediately before the last event (App Uninstall in this example). By looking at the inner concentric circles, you can understand the events that are in closest proximity to the ending event.
NoteCurrently, in Flows, we sample your data to ensure that results load faster, so you might see a minor difference in counts when you compare these numbers to numbers in the rest of your dashboard.
This sampling has been optimized for accuracy and your numbers will be directionally correct. Sampling kicks in if the query contains more than 50,000 events, and the sample size is 10%.
Updated about 1 month ago
