
NPS Stats
Learn how to understand the stats on NPS board.
The NPS board in CleverTap provides a comprehensive overview of customer feedback collected through Net Promoter Score surveys. It combines key quantitative metrics with trend visualizations to help you measure and track user sentiment over time.
To view NPS stats:
- Go to Dashboard _Dashboard > Boards > NPS. NPS_. Select the Stats tab.
- Apply view filters if required.
The NPS board in CleverTap displays the following data points:
- Overall NPS Score: Calculated using customer responses.
- Total Responses Received: Number of users who submitted feedback.
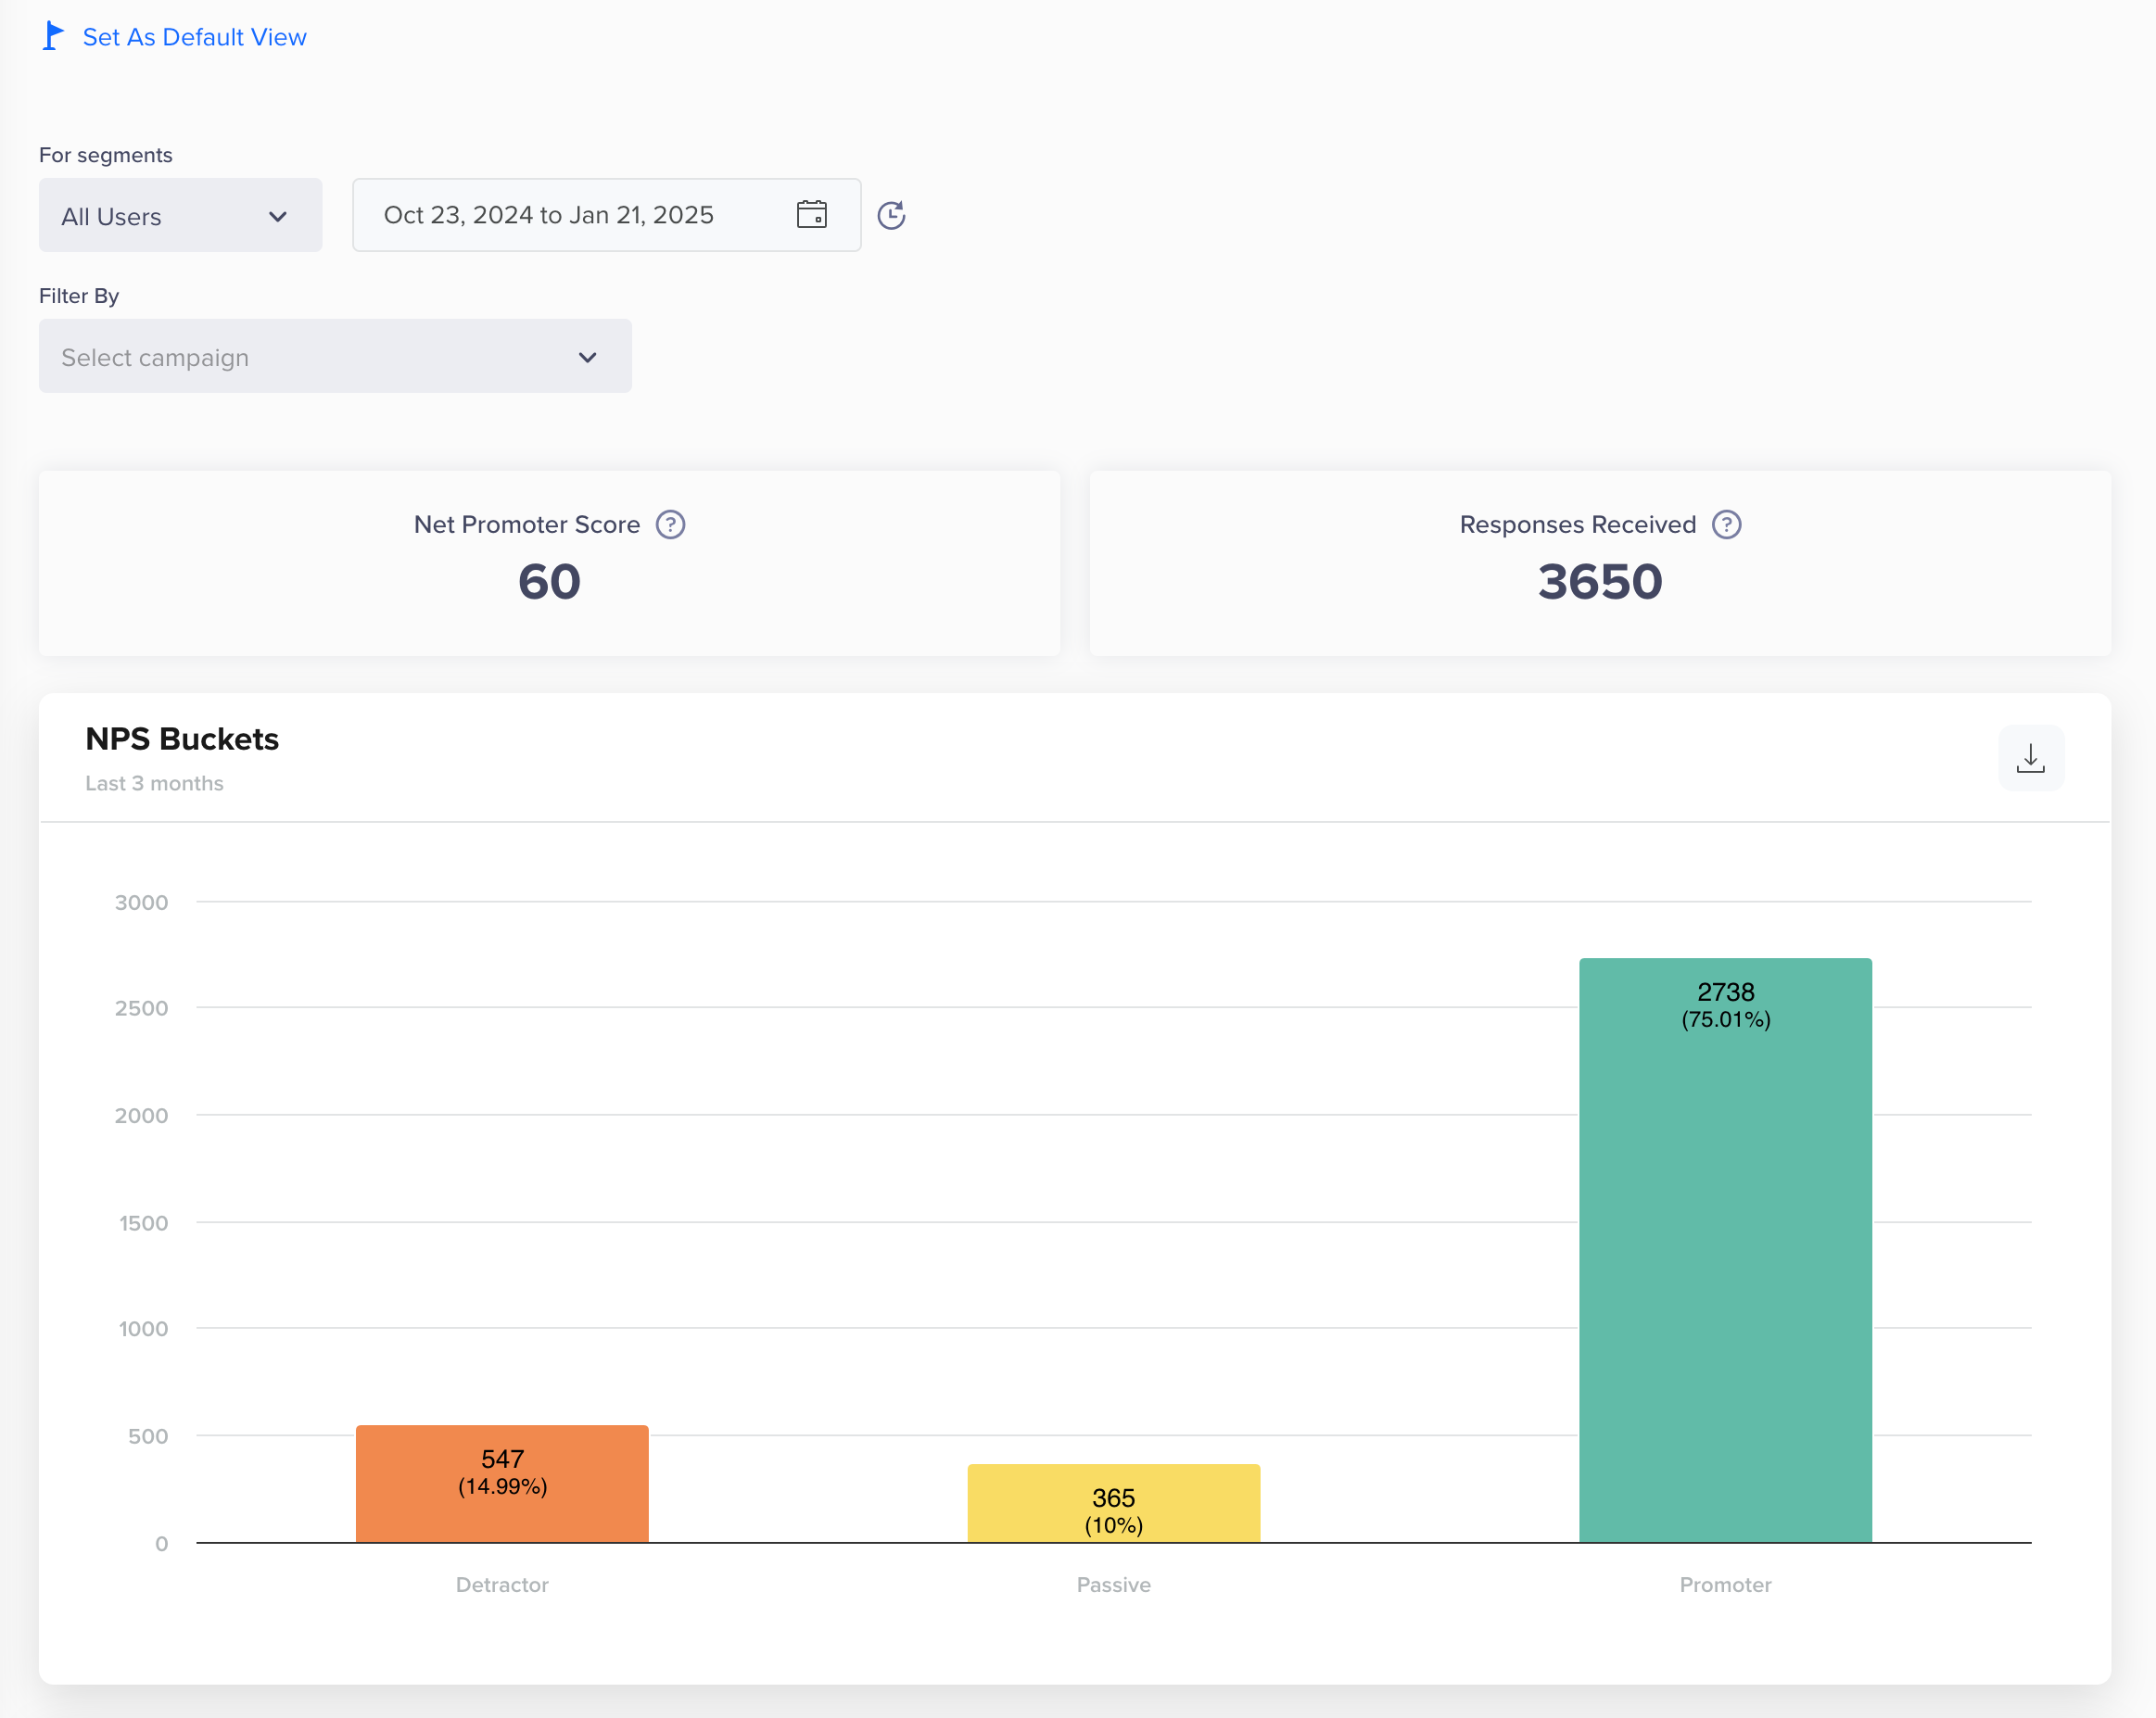
- NPS Buckets: Categorized breakdown of Detractors, Passives, and Promoters.
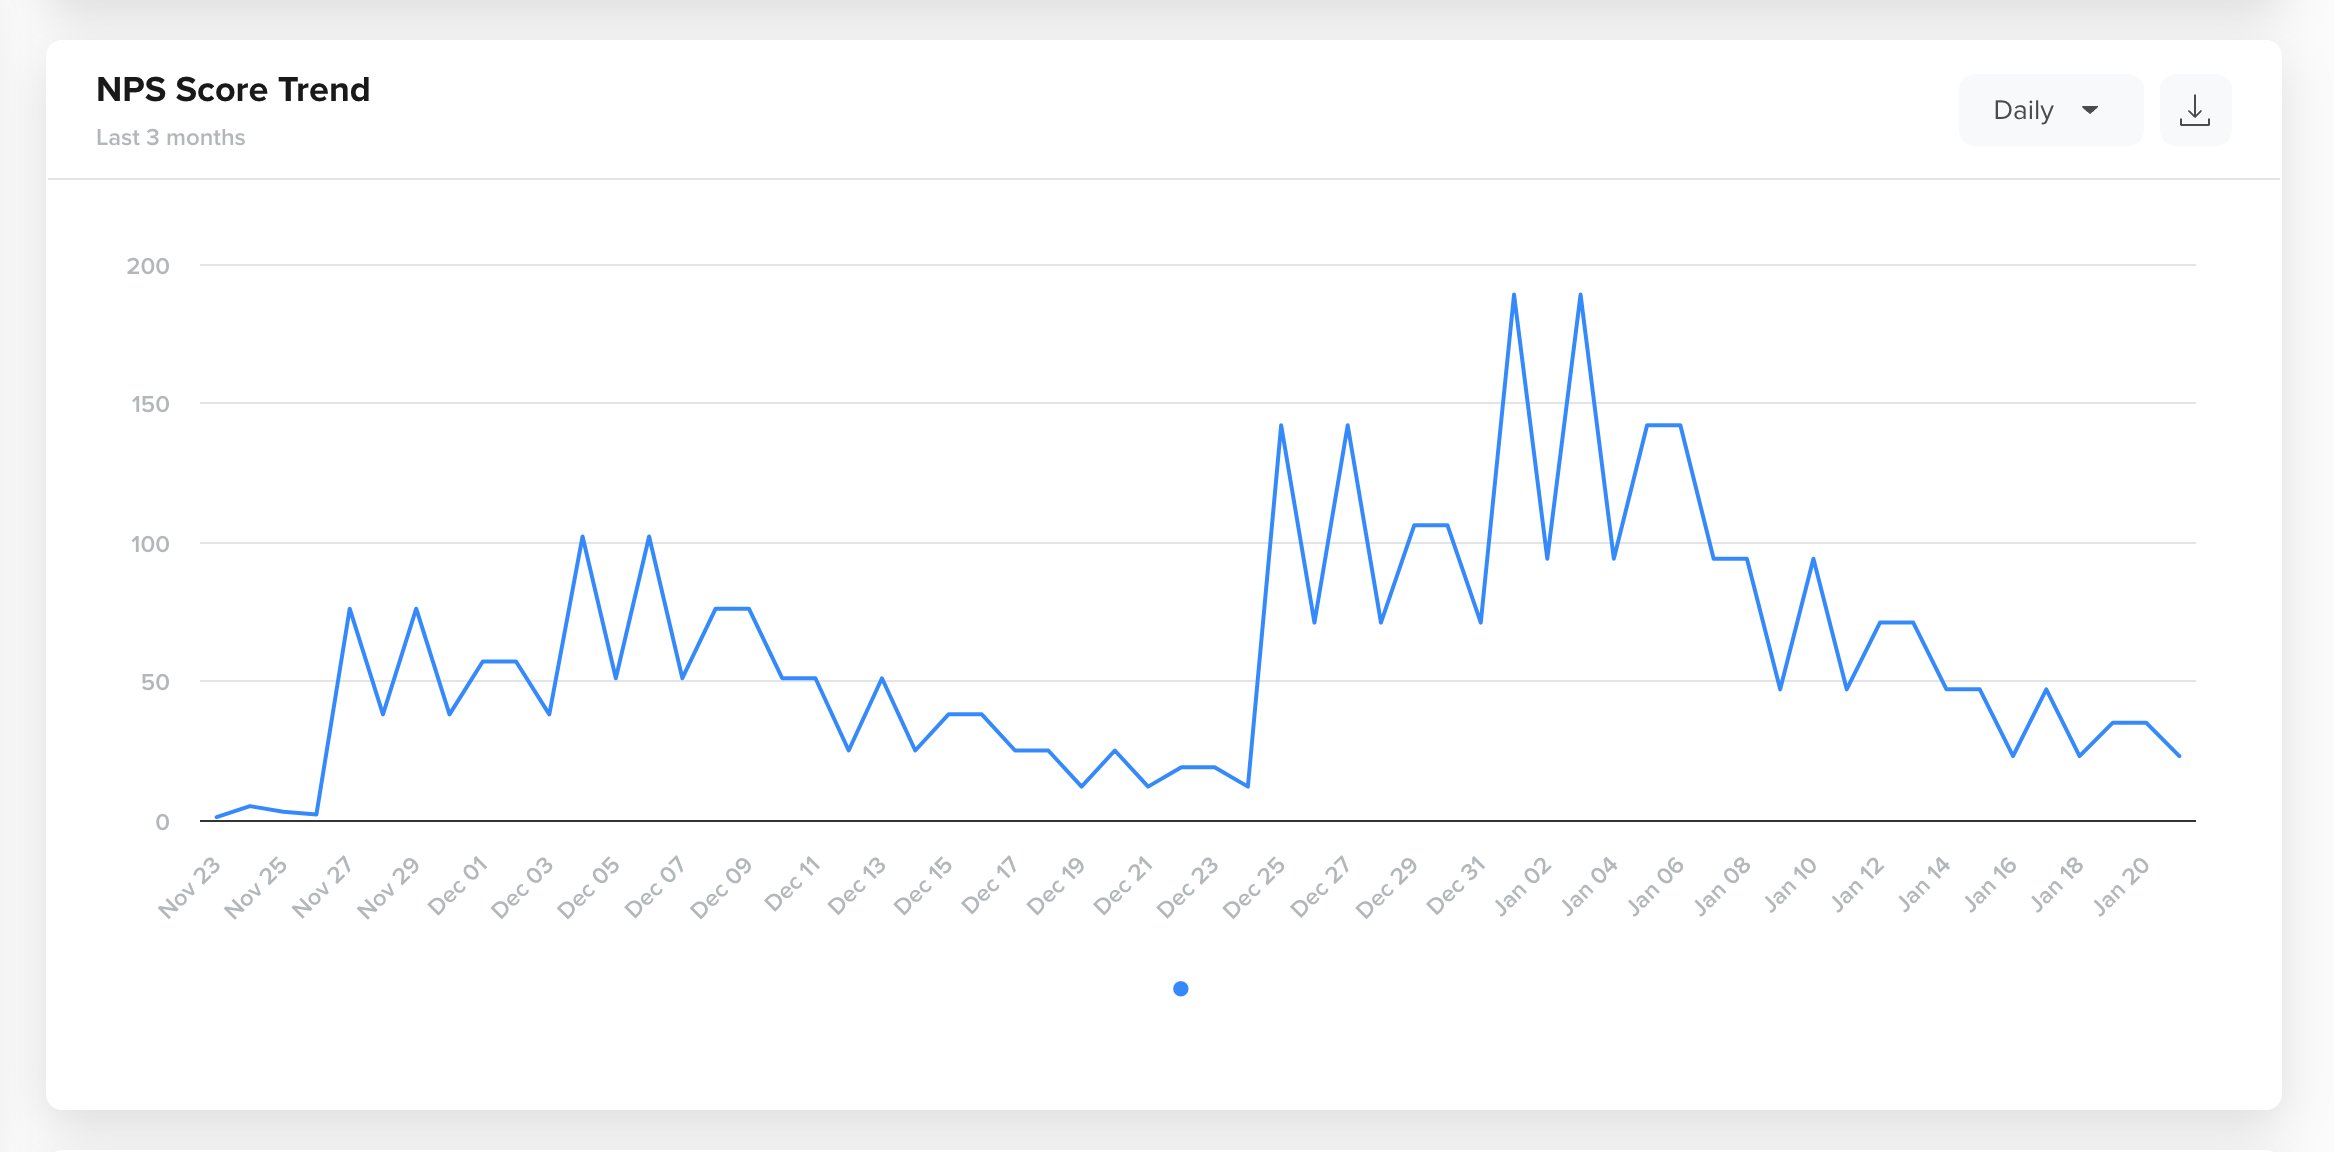
- NPS Score Trend: Visual representation of how the score changes over time.
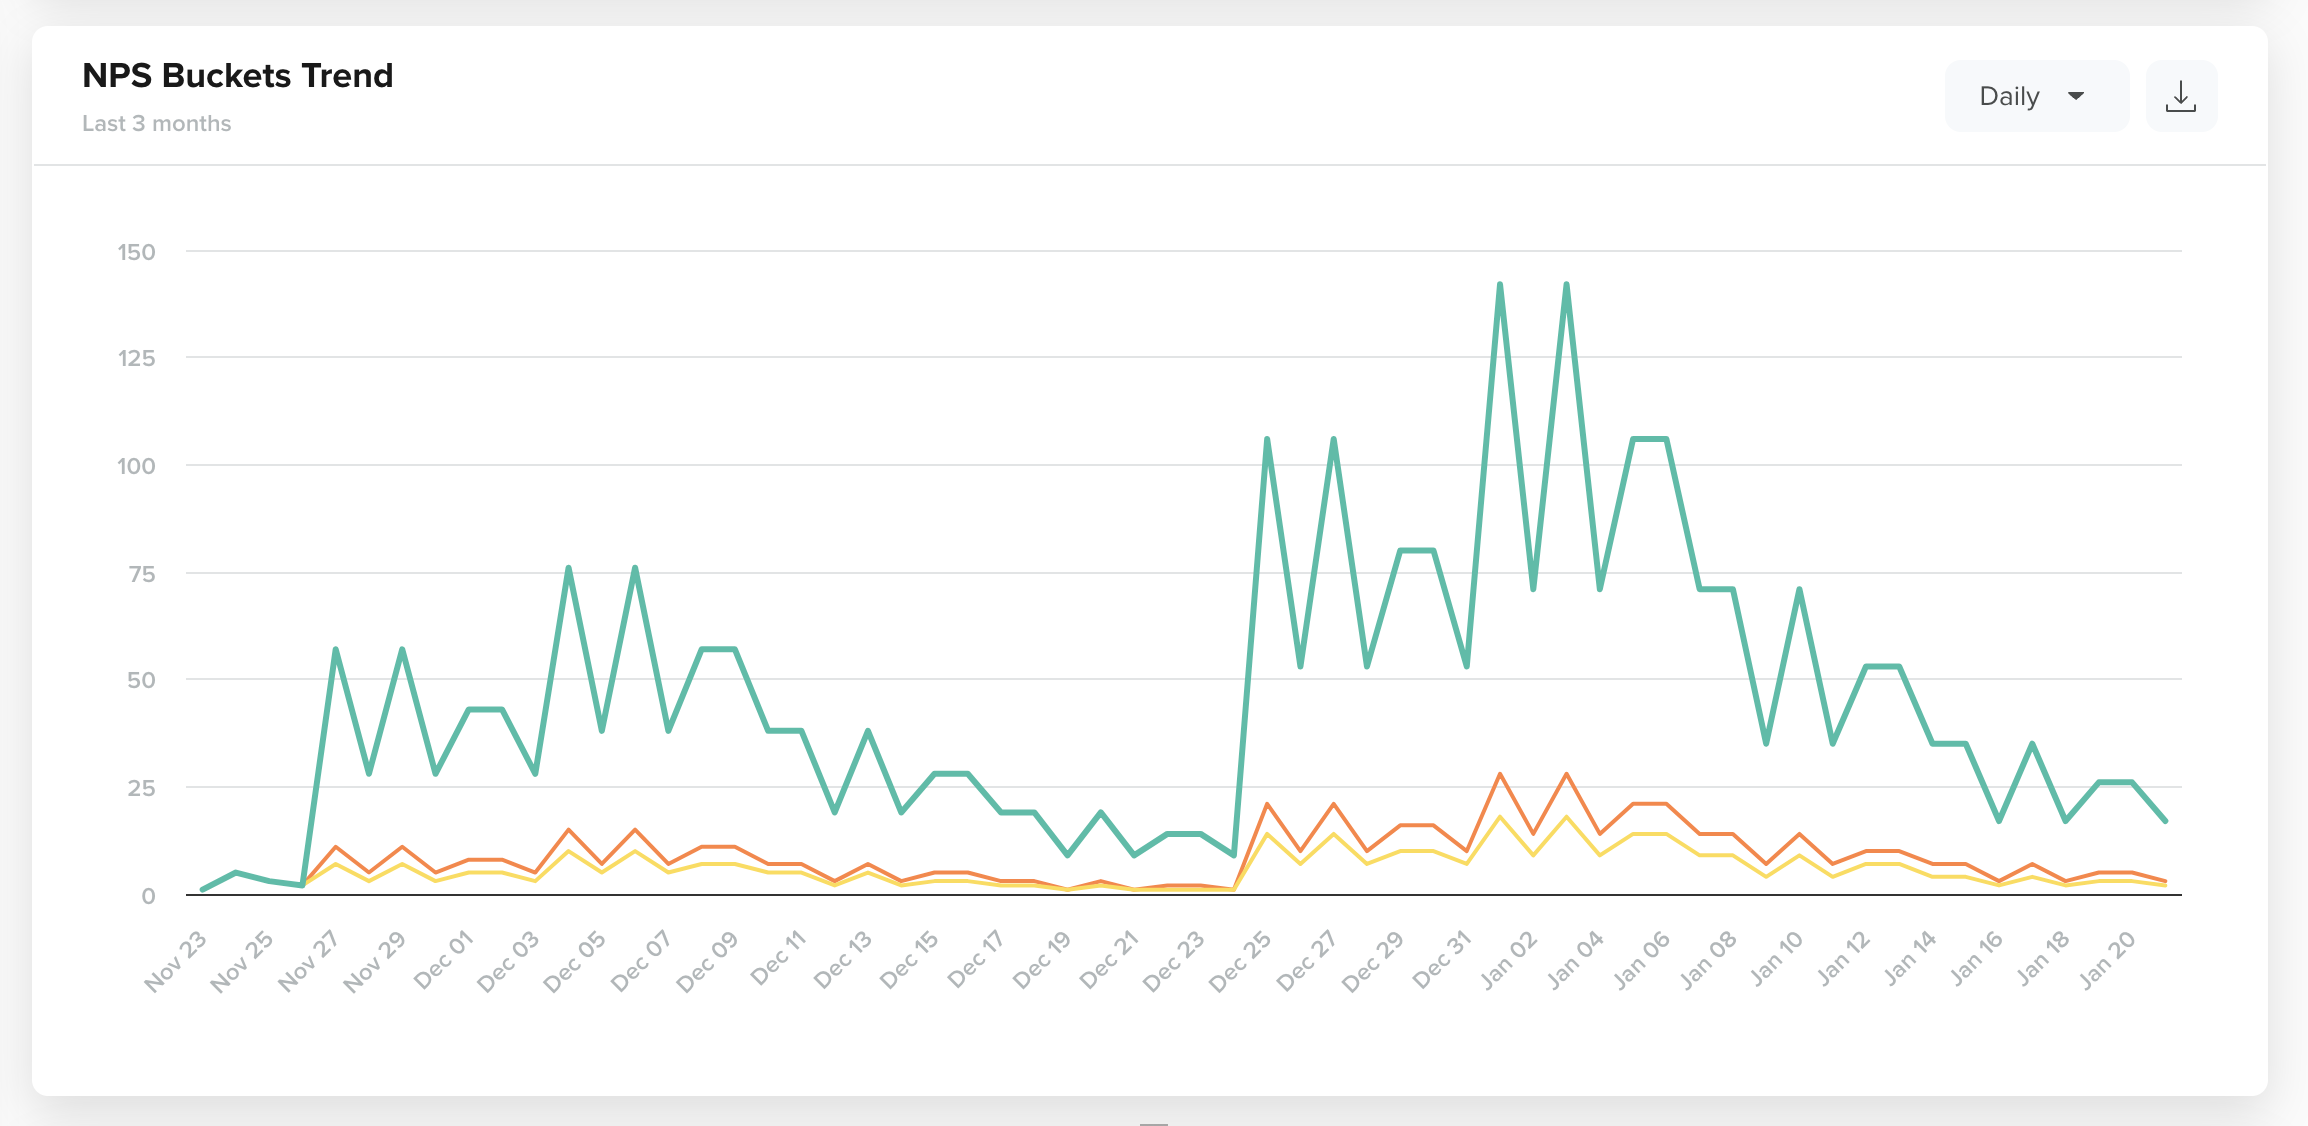
- NPS Buckets Trend: Distribution of Detractors, Passives, and Promoters over a selected time period (daily, weekly, or monthly).
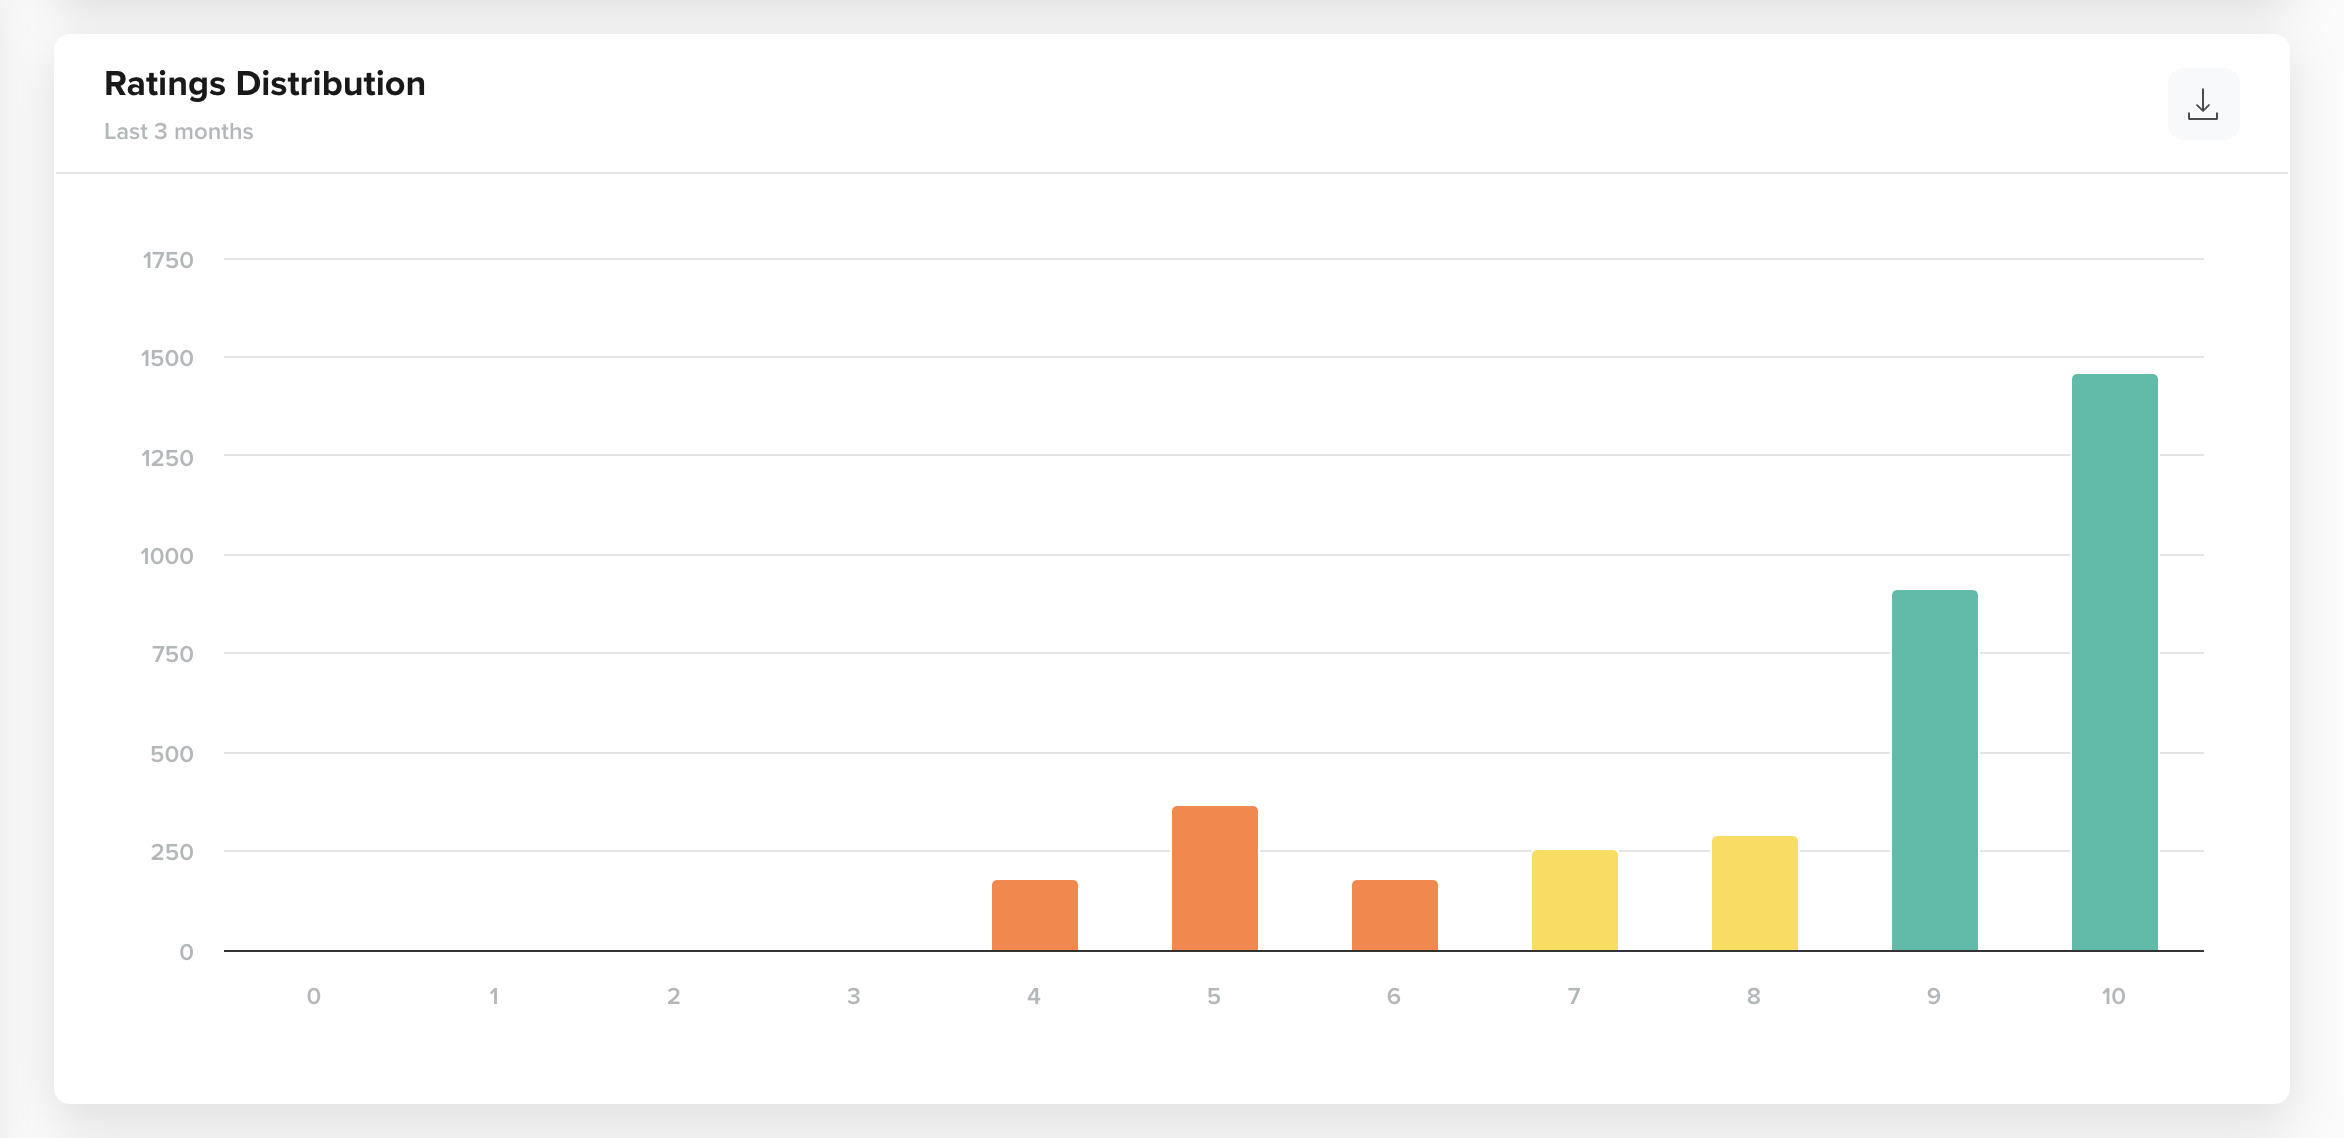
- Ratings Distribution: Bar chart of user ratings on a scale of 0–10.
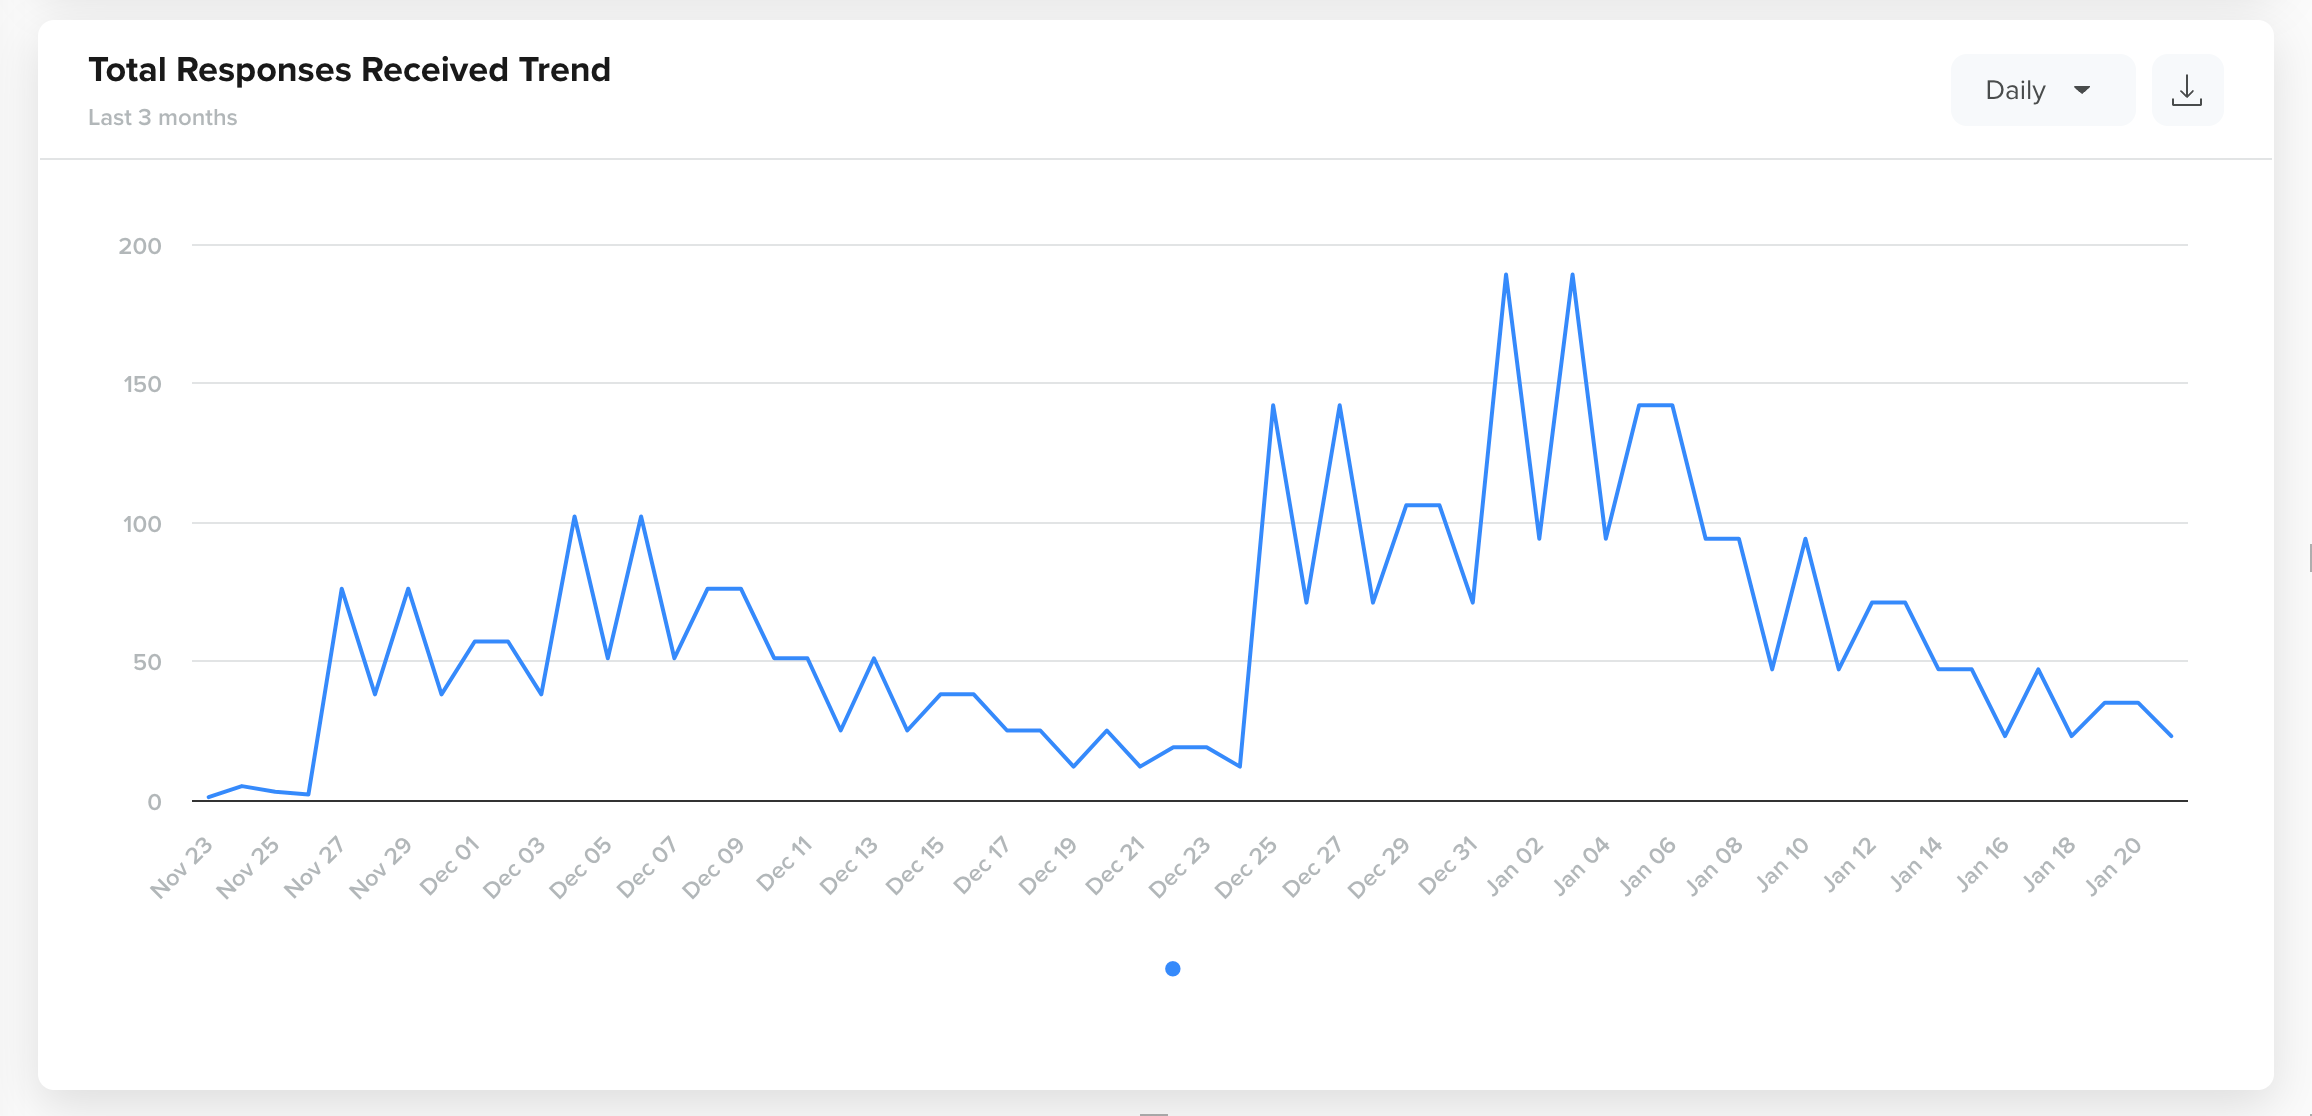
- Total Responses Trend: Trend line showing submission volumes across time periods.
At a high level, the NPS feedback is categorized into three buckets - Detractors, Passive, and Promoters.
- Detractors (0–6): Unhappy customers likely to churn or share negative feedback.
- Passives (7–8): Neutral customers who are satisfied but not enthusiastic.
- Promoters (9–10): Loyal customers who are highly likely to recommend your product.
The overall NPS score is calculated as the difference between the percentages of Promoters and Detractors (NPS = % of Promoters - % of Detractors). For example, for a standard NPS question, "How likely are you to recommend us on a scale from 0 to 10?” If 70% of respondents are Promoters and 10% are Detractors, then you have an NPS of 60. You can refine your view using filters for campaigns, segments, or date ranges to analyze performance for specific cohorts or time periods.
The following chart illustrates how feedback is distributed across Detractors, Passives, and Promoters:
The NPS board also provides:
- NPS Score Trend over a specific period (daily, weekly, monthly).
- NPS Buckets Trend for Detractors, Passives, and Promoters over a specific period (daily, weekly, monthly).
- A bar graph view of the Ratings Distribution for the selected duration
Additionally, you can view the trend chart for Total Responses Received daily, weekly, and monthly.
To understand event-related information in detail, refer to Analysing User Ratings in Analytics.
Updated about 2 months ago