Promo Campaign Stats
Understand how Promo Campaign Stats provide clear, reward-specific insights into user engagement, reward distribution, and redemption trends through KPIs and time-based charts.
Overview
The Rewards Distribution tab under Promo Campaign Stats provides a comprehensive overview of Promo campaign performance, displaying real-time and historical analytics for user engagement, reward distribution, and redemption activity. The metrics and charts displayed depend on the Reward type selected when creating the campaign.
Each reward type includes:
- Key Performance Indicators (KPIs) for campaign outcomes.
- Interactive charts visualizing trends over time.
- Date filters to customize your analysis by day, week, or month.
NoteThe Campaigns with the Past Behavior Segments show total metrics only (no time-based charts), while Campaigns with the Live Behavior Segments include both total metrics and interactive, time-based performance graphs.
Loyalty Points Campaign Stats
Loyalty Points campaigns display wallet-based reward performance and the total number of points distributed. These KPIs help you assess the frequency of rewards and the overall point volume during the campaign as follows:
- Rewards Distributed: Represents the total number of times a reward was distributed during the campaign. For example, if rewards were triggered multiple times for the same user, each instance is counted toward the total.
- Points Distributed: Indicates the total number of loyalty points issued to all qualifying users. For example, a total of 6,132 loyalty points were distributed.
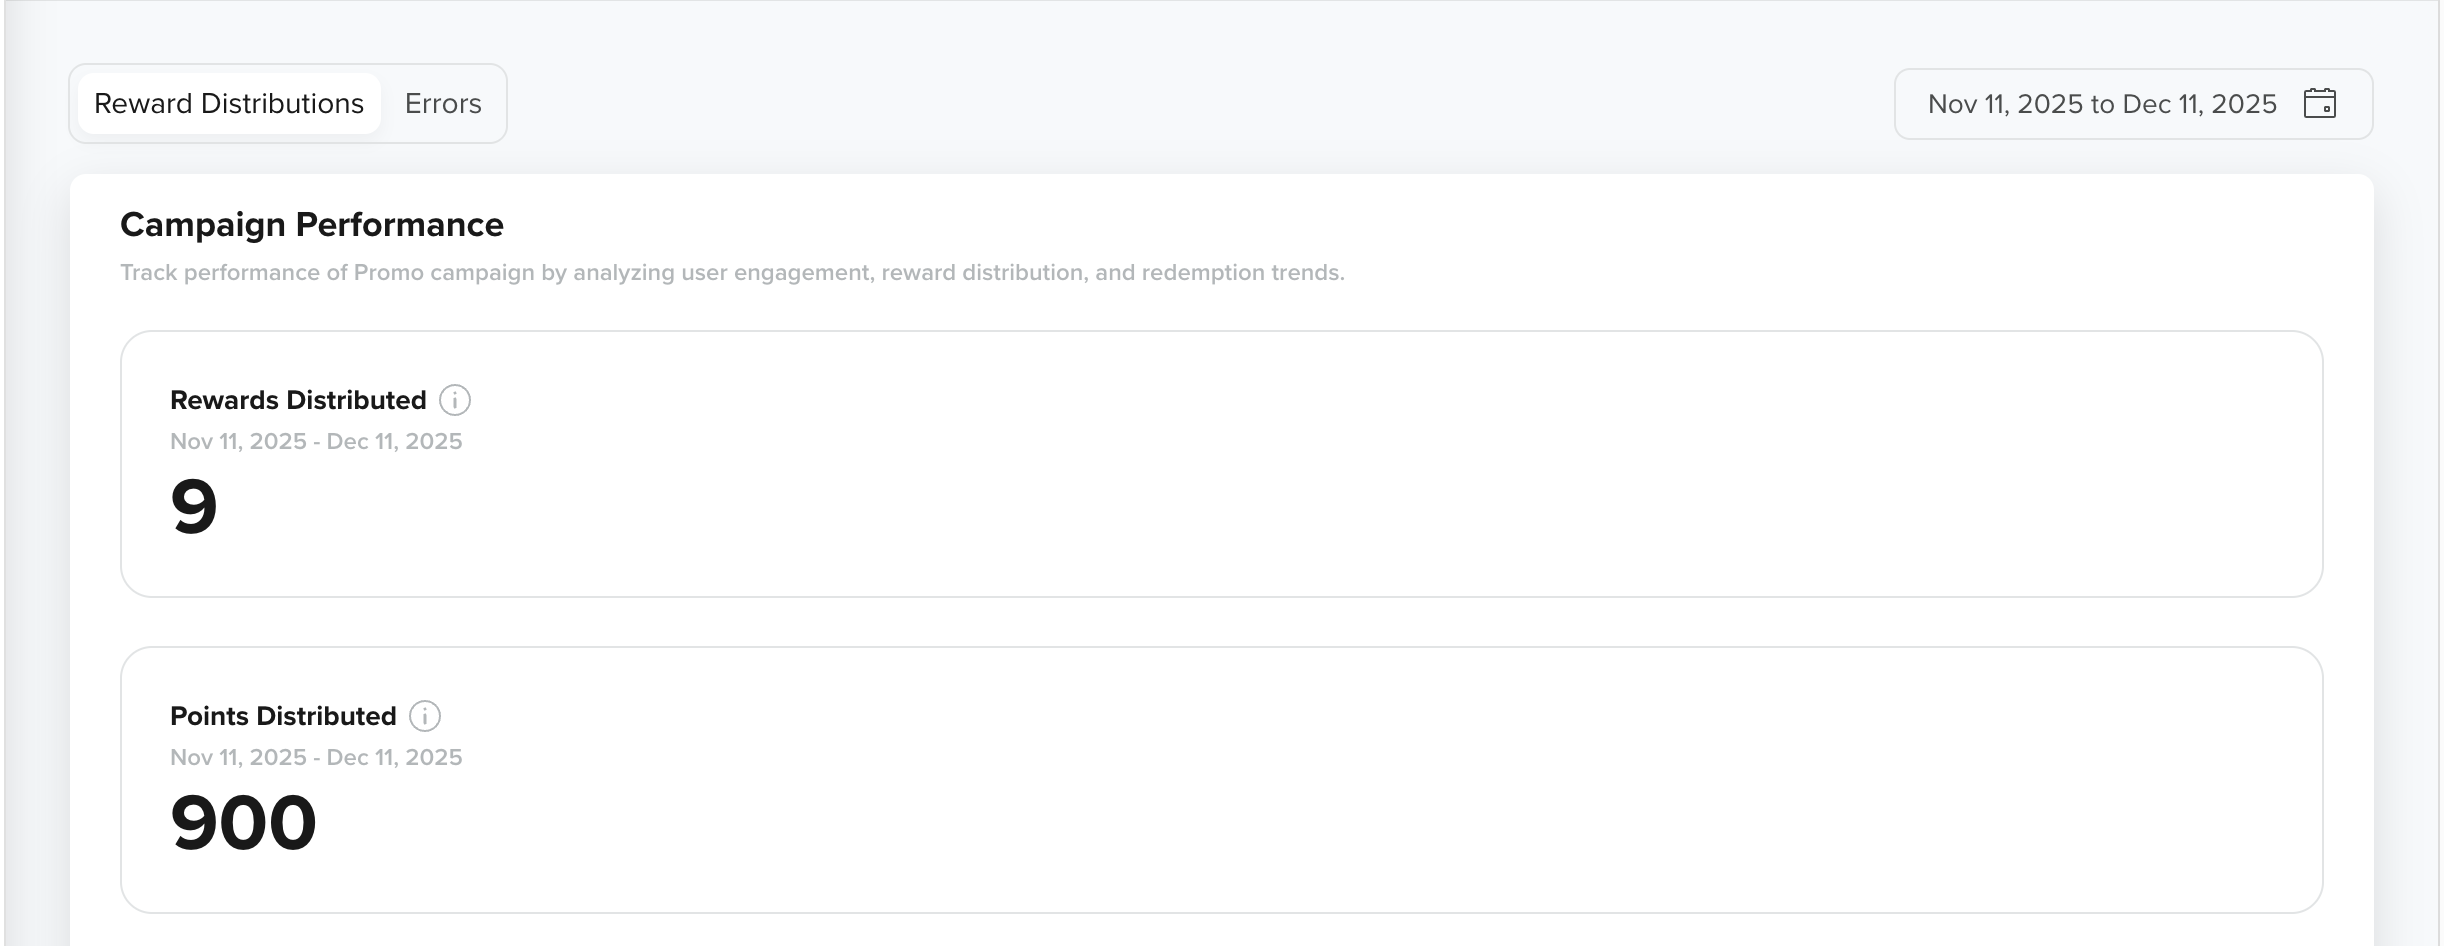
KPIs for Promo Campaign with Loyalty Wallet Rewards
View Trends
The Loyalty Wallets rewards KPIs also include two line charts that show how reward distribution changed throughout the campaign. These charts help you visually identify patterns such as high-engagement days, reward spikes, or periods of inactivity. For example, if users were rewarded on multiple days, the charts show recurring spikes corresponding to the distribution of rewards and points.
-
Rewards Distributed: This line chart illustrates the frequency of rewards issued on each day, week, or month within the selected date range.
- X-axis: Represents the Date or Month for the selected duration.
- Y-axis: Represents the total number of rewards distributed during that period.
You can aggregate chart data by Day, Week, or Month using the dropdown in the top-right corner of the chart. When you hover over any data point, the chart displays: - The exact number of rewards distributed for that period, and
- The percentage change compared to the previous period (Day/Week/Month based on the selected aggregation).
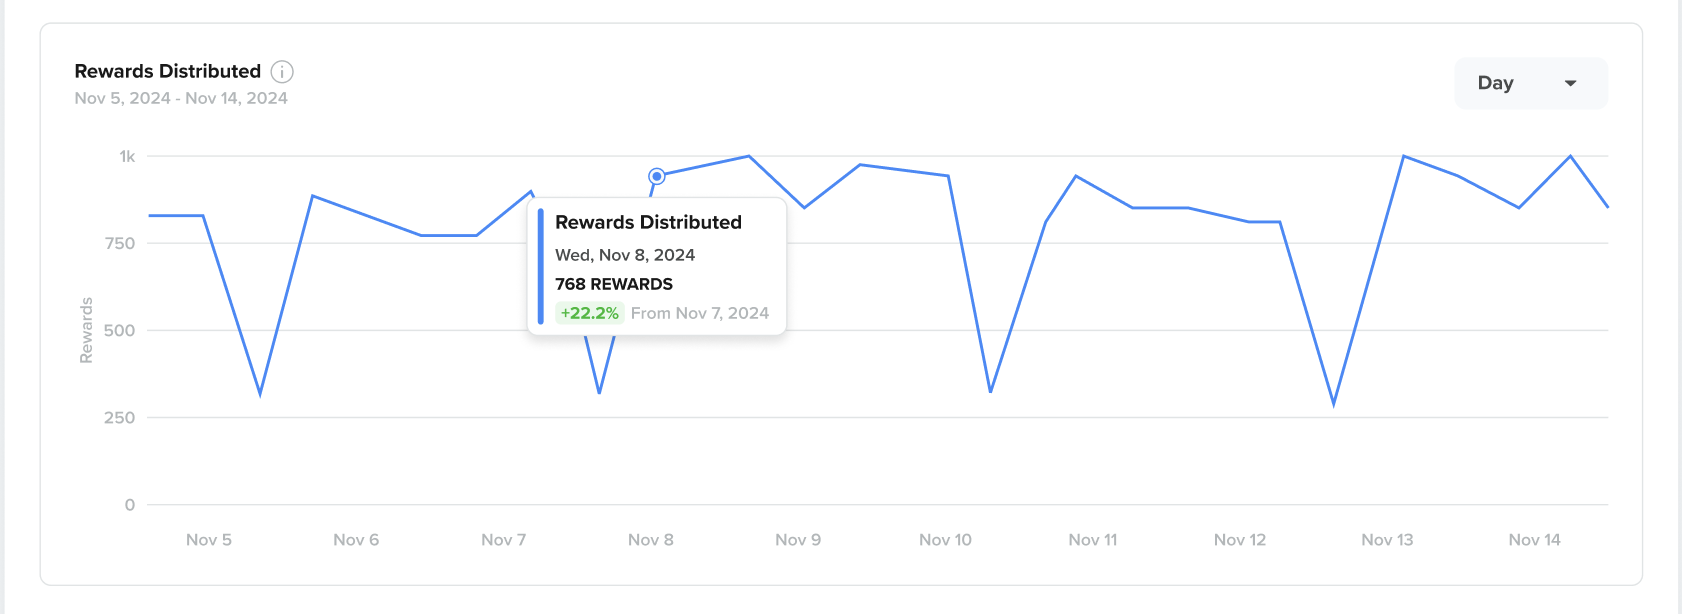
Rewards Distributed Over Time in Loyalty Wallets
- Points Distributed: This line chart illustrates the number of loyalty points issued on each date within the campaign range, as well as distribution trends, such as reward bursts on high-activity days or consistent distribution throughout the campaign.
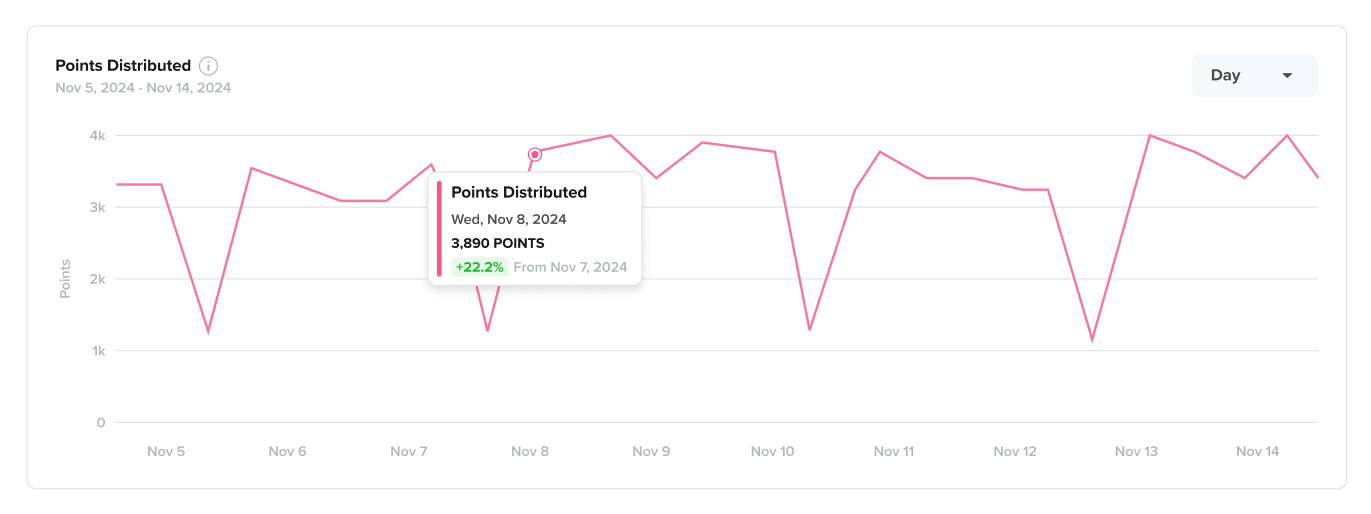
Points Distributed Over Time in Loyalty Wallets
Coupon Campaign Stats
Coupon campaigns help you track how coupons are issued and redeemed over time, providing visibility into user engagement and the financial impact of discounts or cashback rewards delivered.
The Rewards Distribution tab adapts based on the Coupon Type (Single Code or Bulk Code) and the Coupon Benefit (Discount or Cashback). Only relevant KPIs and charts are displayed.
The KPIs in this section help you understand how frequently coupon rewards were issued, how coupons were distributed, and the total value redeemed by users.
-
Rewards Distributed: Represents the total number of times a coupon reward was issued during the campaign. Each reward trigger is counted, including repeat rewards issued to the same user.
-
Coupons Distributed: Indicates how coupon codes were distributed, based on the type of coupon used in the campaign.
- Single Code Coupon: Shows the number of times the same coupon code was shared with users.
- Bulk Code Coupon: Shows how many unique coupon codes from the bulk series were distributed. Each campaign trigger assigns a new code to the user.
-
Discount Redeemed: Applicable only for discount coupons, this KPI shows the total value of discounts redeemed using coupons issued by the campaign.
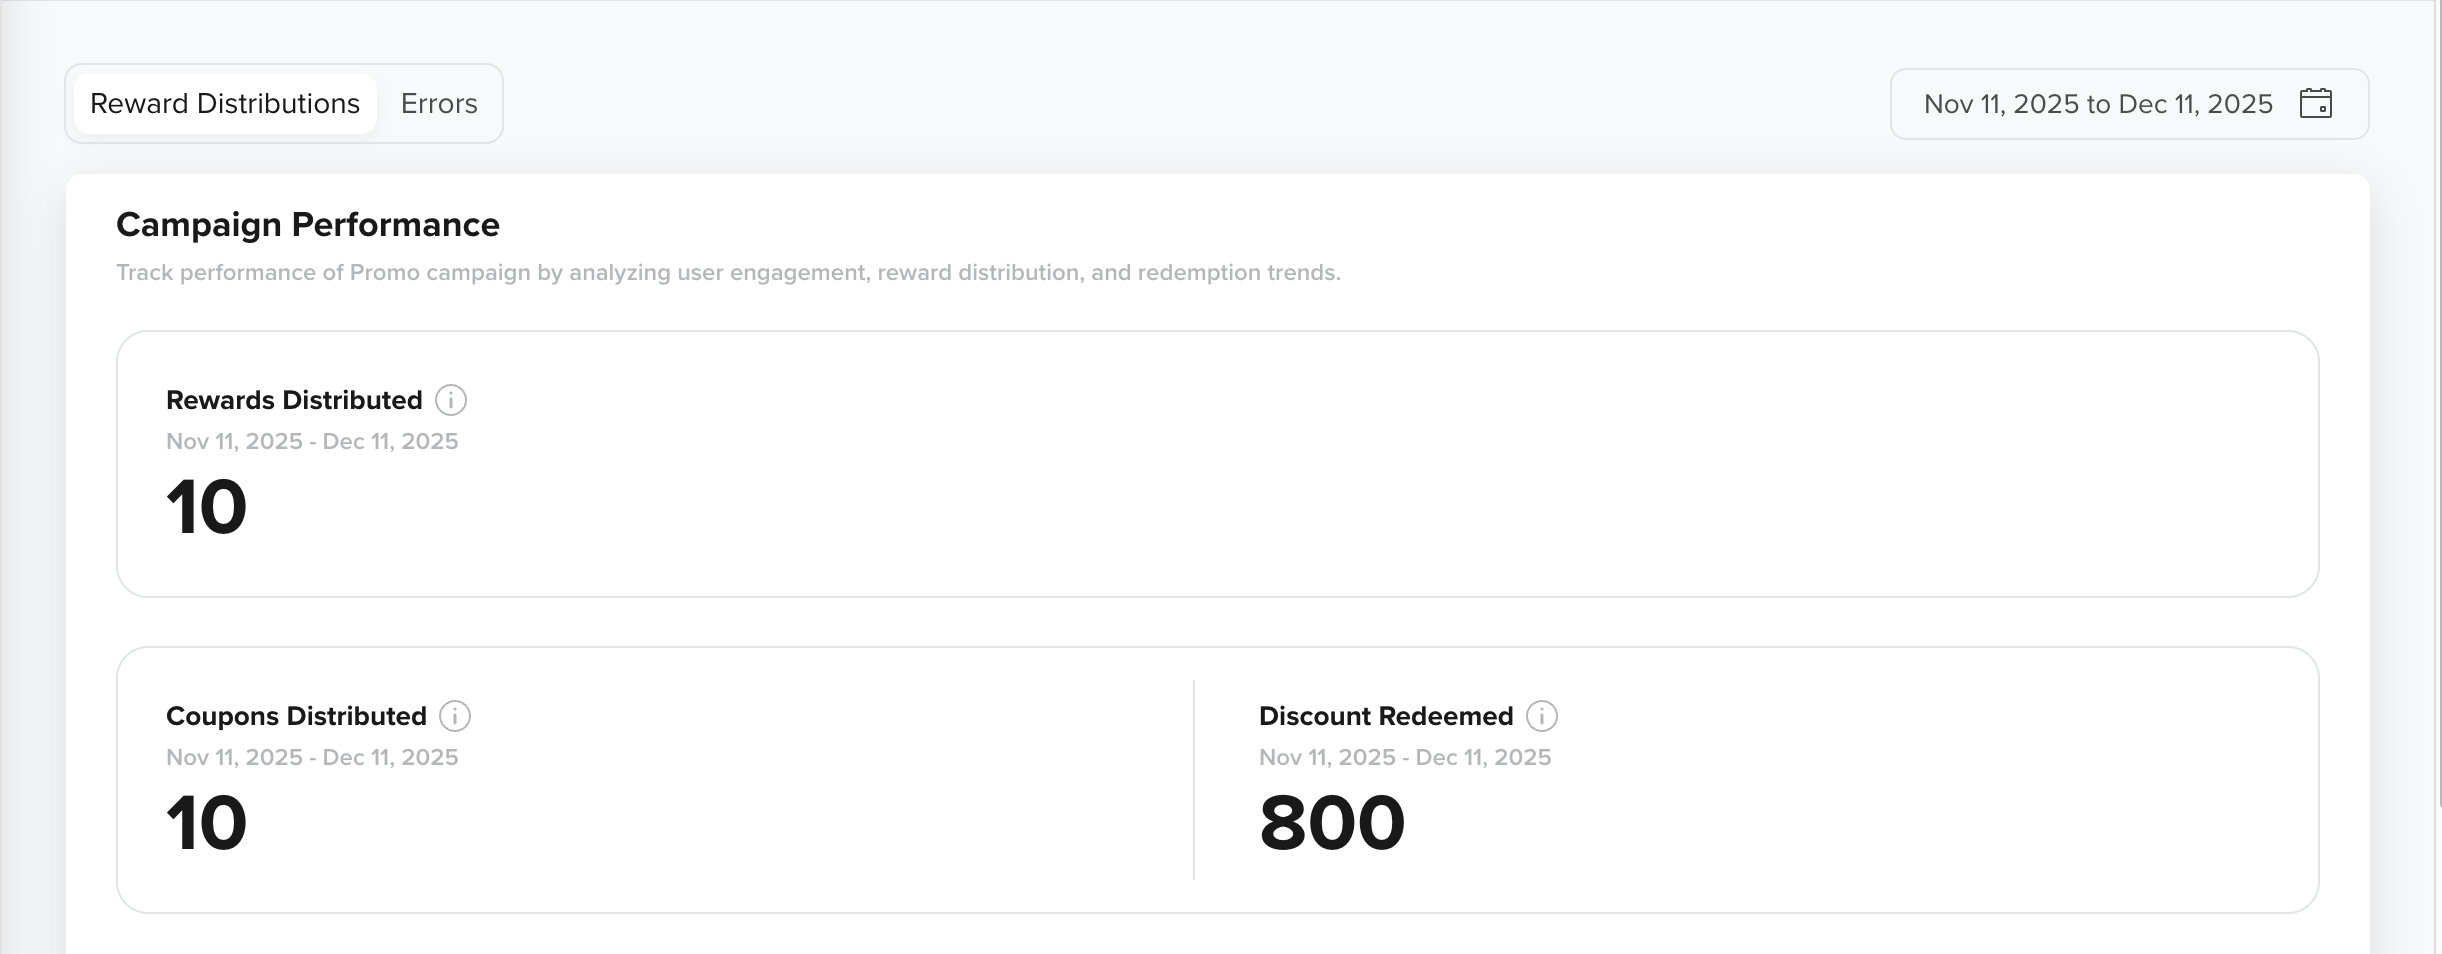
KPIs for Promo Campaigns with Coupon Rewards
- Cashback Points Credited: Applicable only to cashback coupons, this KPI shows the total number of cashback points credited to users’ wallets from coupon redemptions. For example, the campaign may show 5,000 cashback points credited during the selected period.
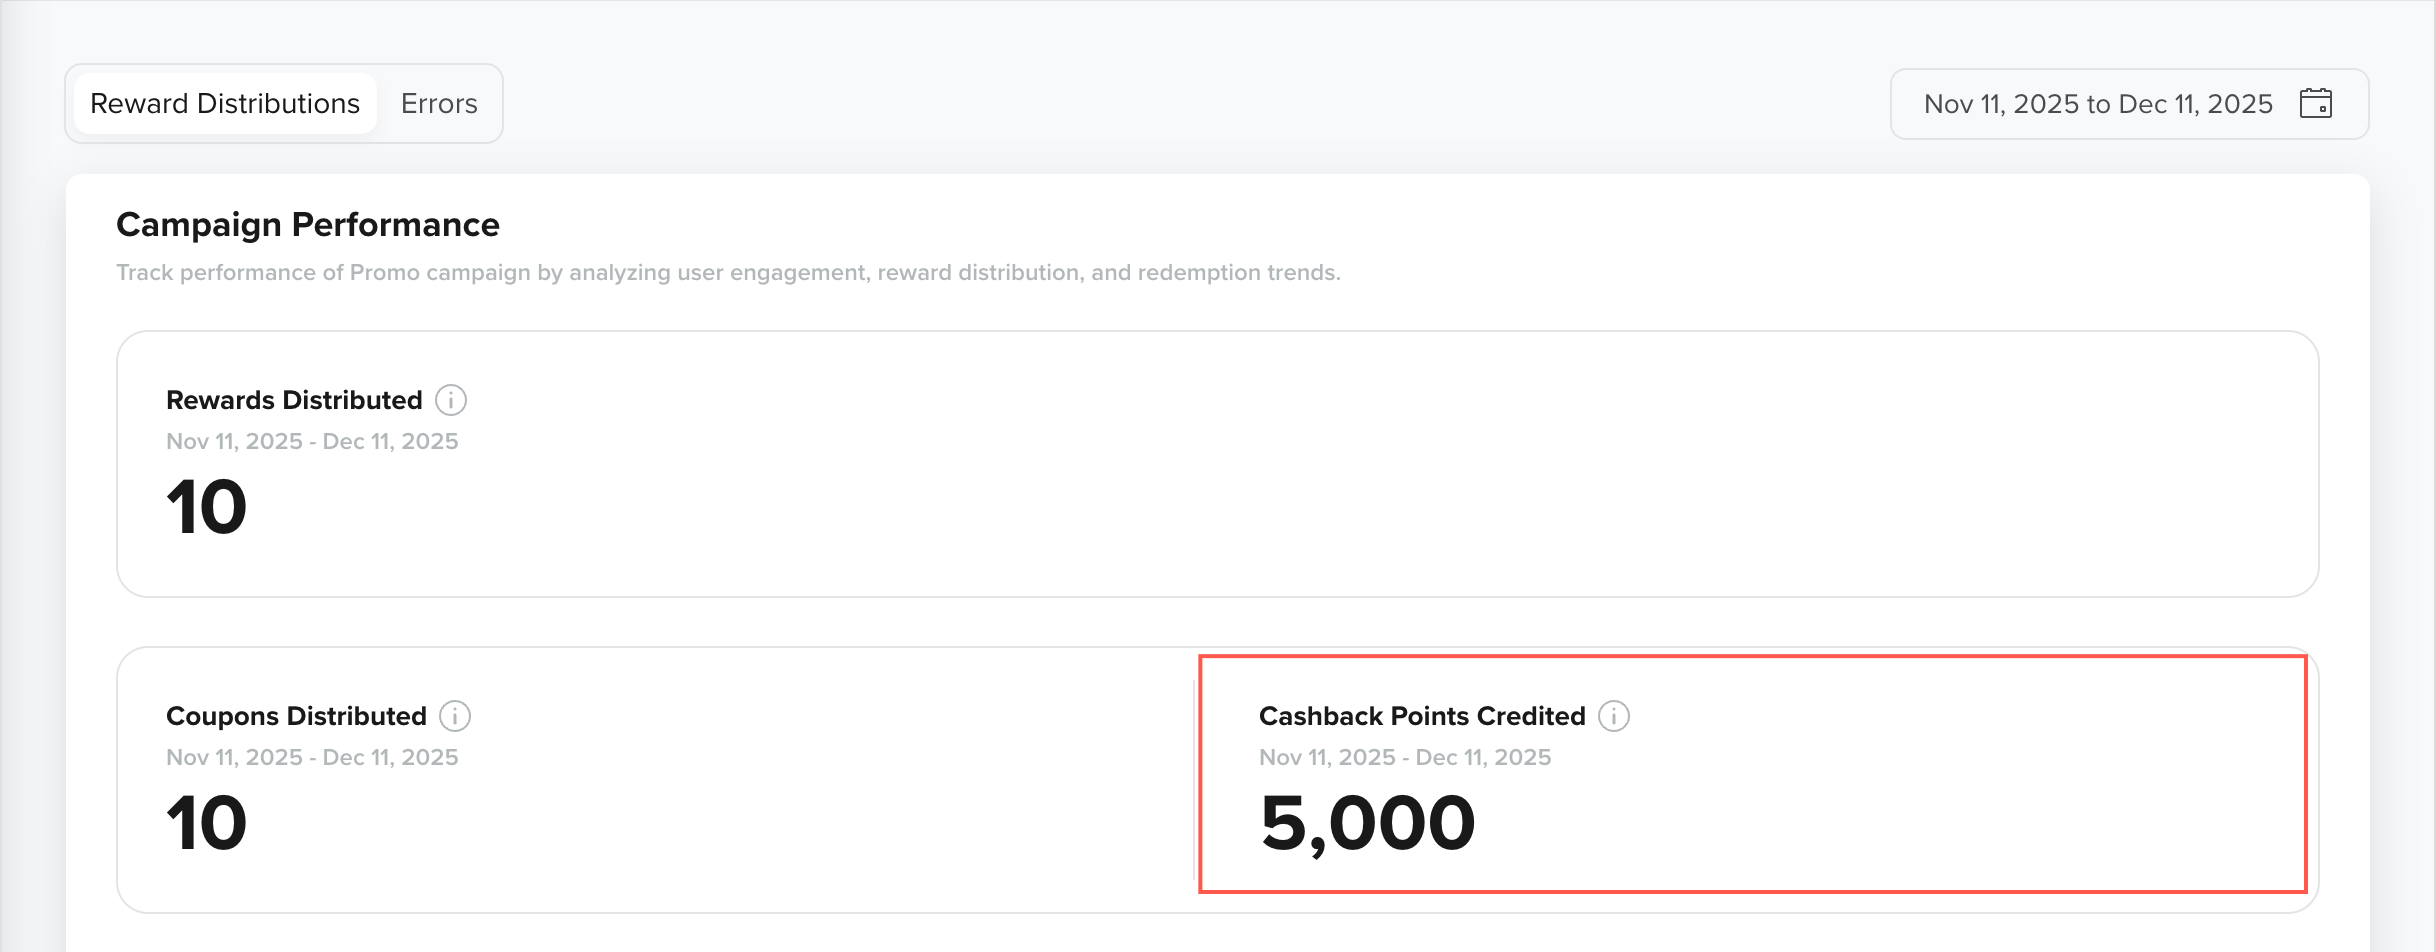
Cashback Points Credited KPI for Cashback Coupon Types
Partner Voucher Campaign Stats
Partner Voucher campaigns track the distribution of unique voucher codes sourced from external providers. These analytics help you understand how many vouchers were issued and how distribution patterns changed over time.
The KPIs for Partner Voucher campaigns help you track the number of voucher codes assigned and overall engagement with voucher rewards.
- Rewards Distributed: Includes a line chart that displays voucher distribution patterns over time. This helps you analyze days with higher voucher issuance and spot trends or anomalies in campaign performance. For example, a spike on a specific date indicates higher voucher issuance compared to surrounding days.
- Voucher Codes Distributed: Indicates the total number of partner voucher codes assigned to users during the campaign.
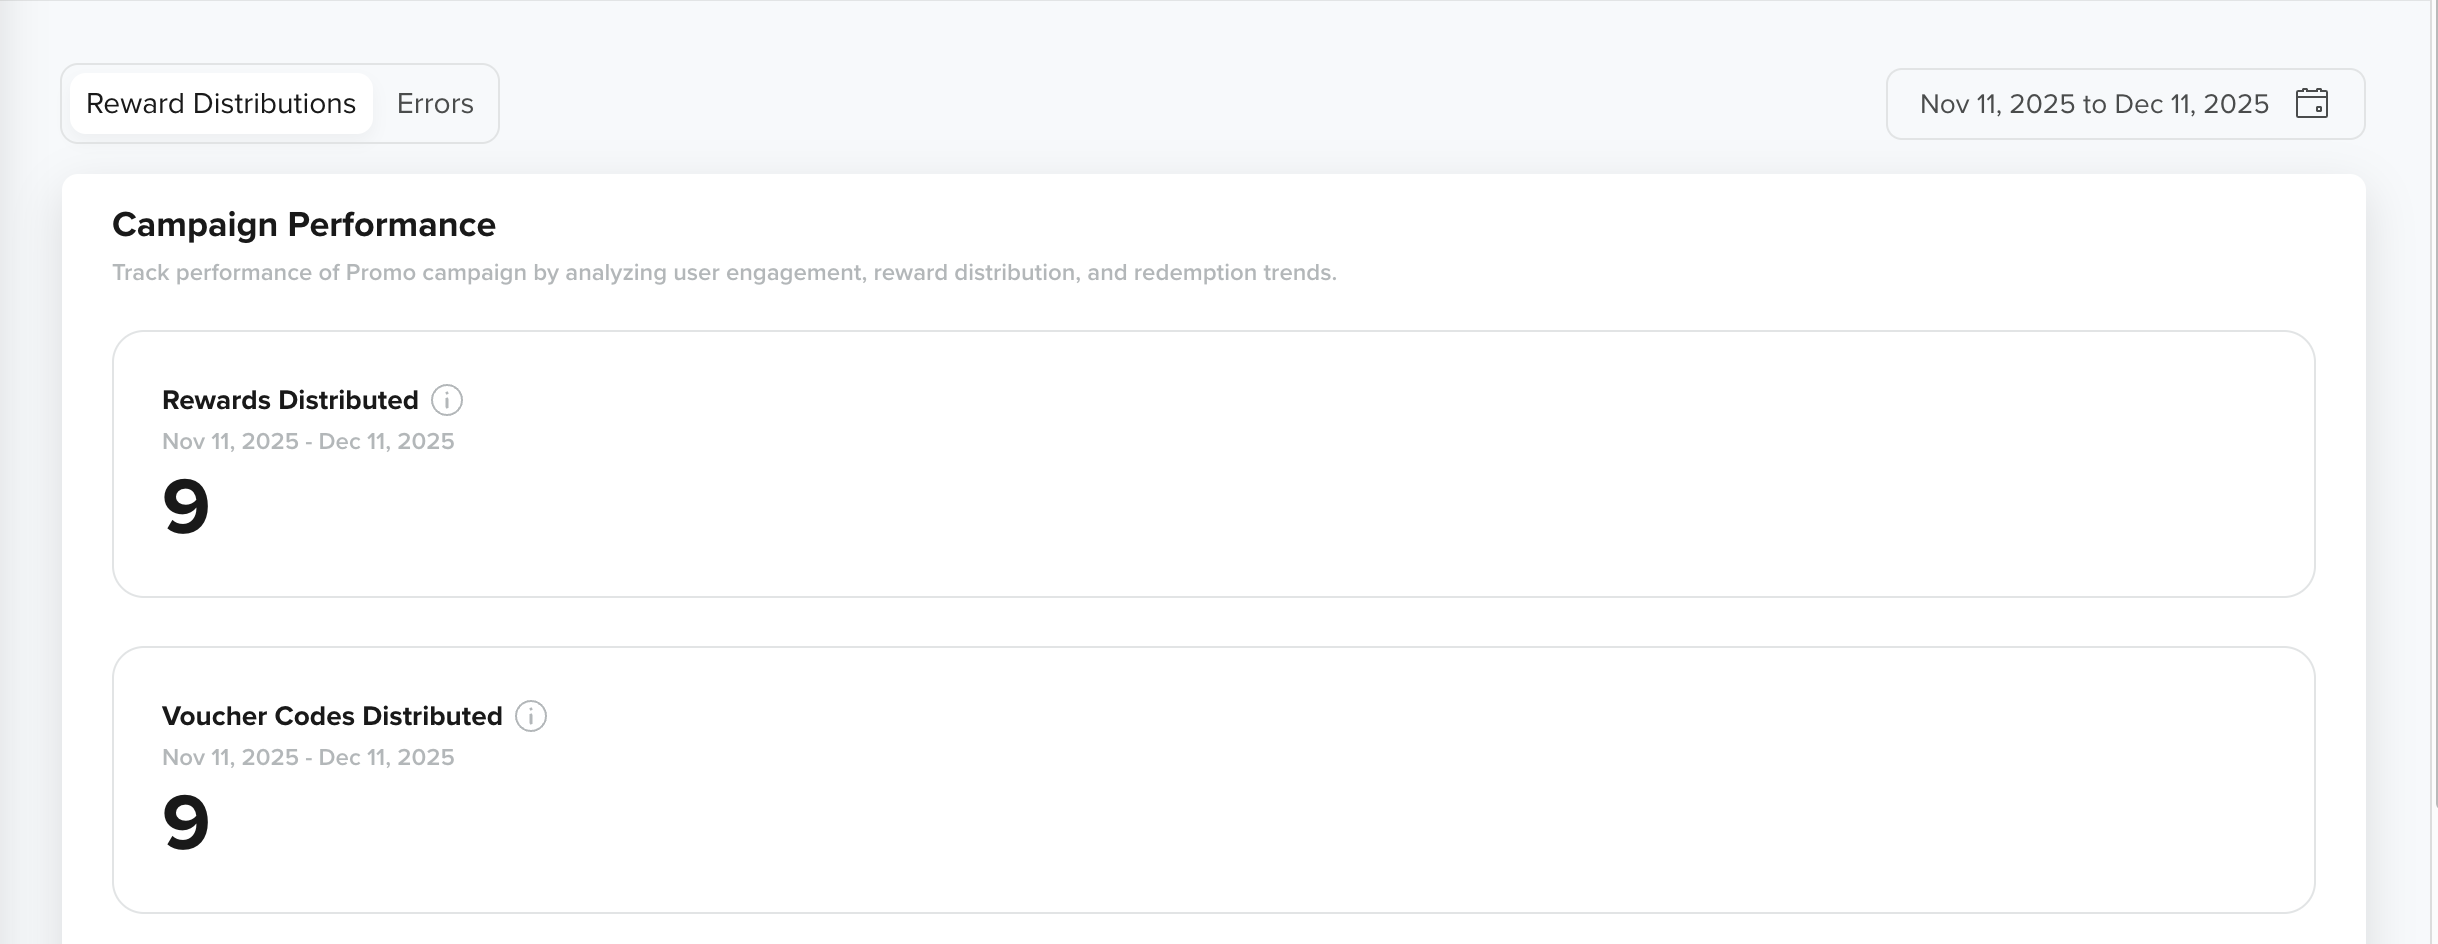
KPIs for Promo Campaigns with Partner Voucher Rewards
View Trends
This Voucher Codes Distributed chart illustrates the distribution of voucher codes across each day, week, or month within the selected date range. It provides a clear view of distribution frequency and peak issuance dates.
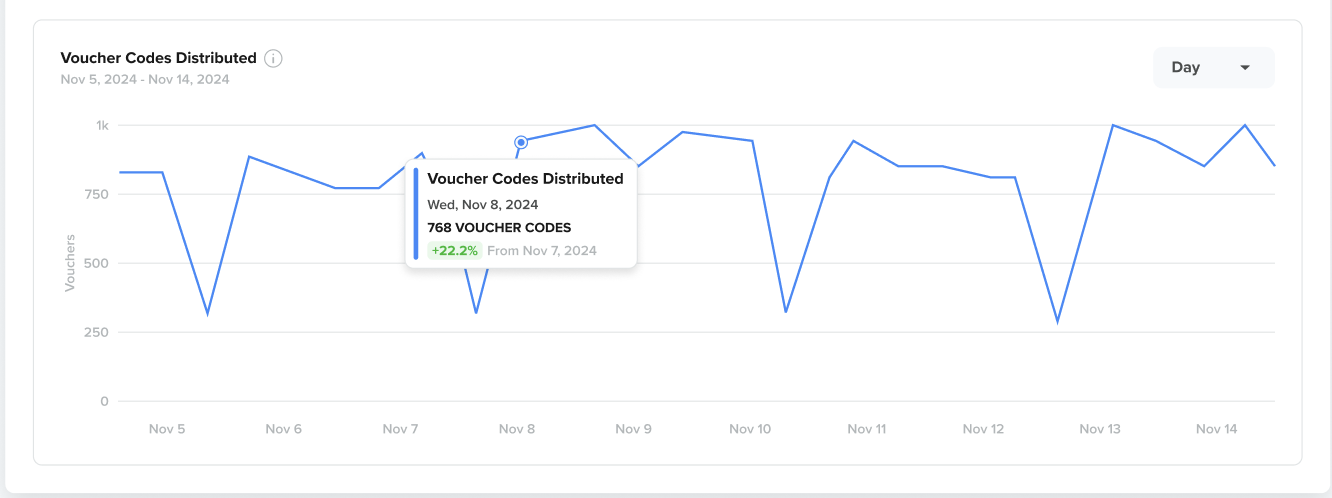
Vouchers Distributed Over Time in Partner Vouchers
Custom Rewards Campaign Stats
Custom Rewards campaigns rely on webhook calls to deliver rewards, such as wallet credits, digital items, or third-party payouts. The Rewards Distributed tab displays the number of webhook-triggered rewards that succeeded, were sent, or failed.
The KPIs in this section help you evaluate webhook performance and identify any system-level issues that may impact reward delivery.
- Webhook Credits Rewarded: Represents the total credits successfully issued through webhook calls when Self-Managed Wallet Credits are used as the reward type. This KPI does not apply to Physical & Digital Rewards.
- Webhook Sent: Indicates the total number of webhook requests triggered from CleverTap to the external endpoint.
- Webhook Failed: Shows the number of webhook requests that failed due to issues such as endpoint failures, timeouts, or invalid payloads.
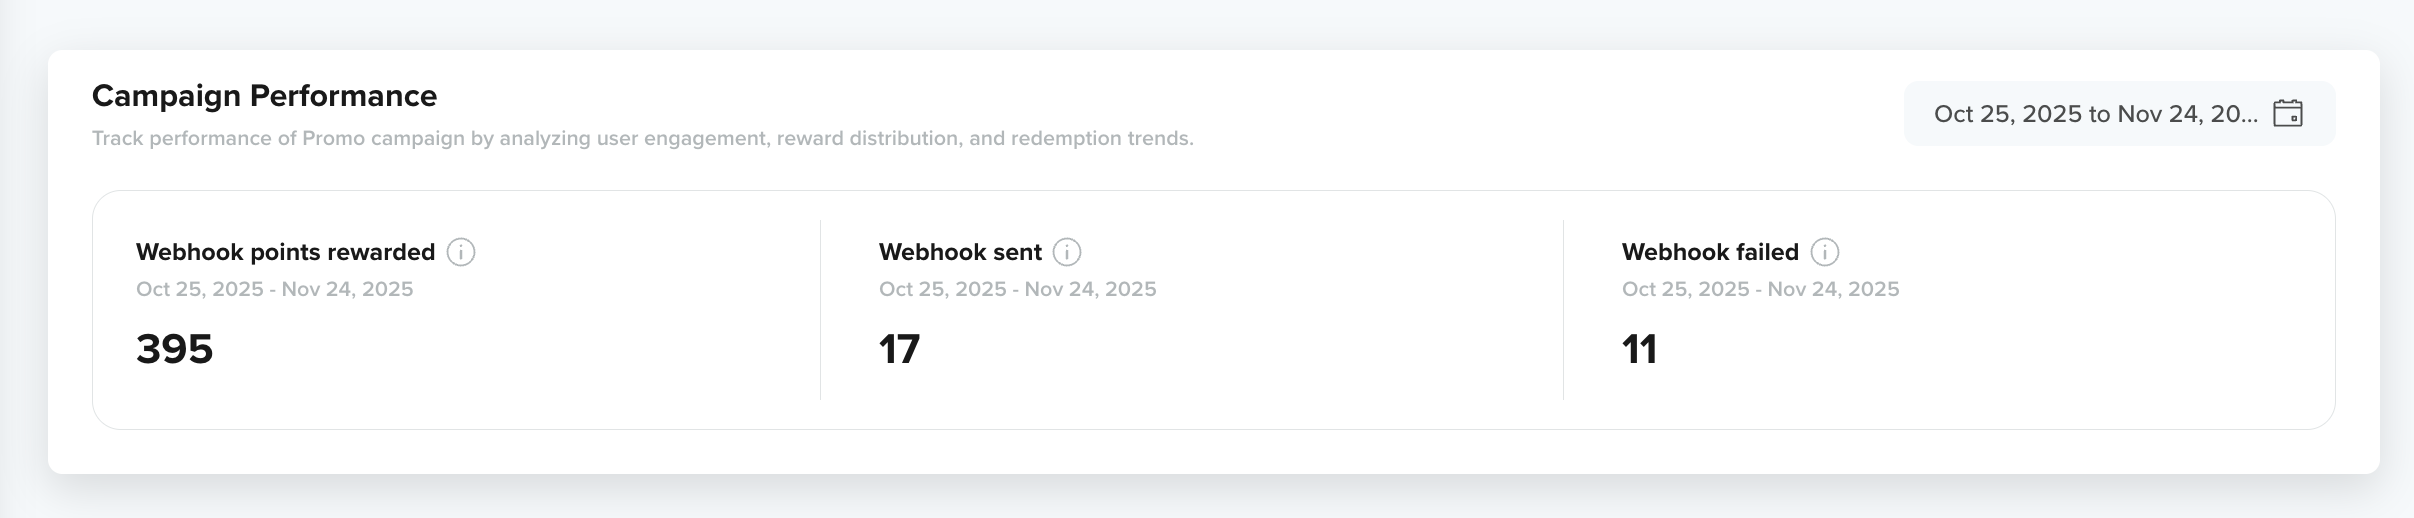
KPIs for Promo Campaigns with Custom Rewards
Updated 6 months ago