Revenue View
Learn how to view insights and data related to the revenue generated by a business in CleverTap dashboard.
Overview
If your app charges customers for goods or services, you can use CleverTap to track revenue. You can record the Charged event to track customer purchases and view revenue-related metrics. These metrics are commonly used in business and analytics to assess a business's financial performance, understand its customer base, and evaluate the effectiveness of its revenue-generating strategies.
Set Conversion EventTo display revenue data on your dashboard, set a conversion event and the revenue property to track revenue. The revenue property must be a numeric value. For example, set the Charged event as your Conversion Event and specify the revenue event property as amount to be calculated and displayed on the Revenue page.
For more information, refer to Conversion Event.
View Revenue Metrics
To view the revenue metrics:
- Navigate to Boards > Revenue from the CleverTap dashboard.
- Select the segment and the date range. The Revenue view opens.
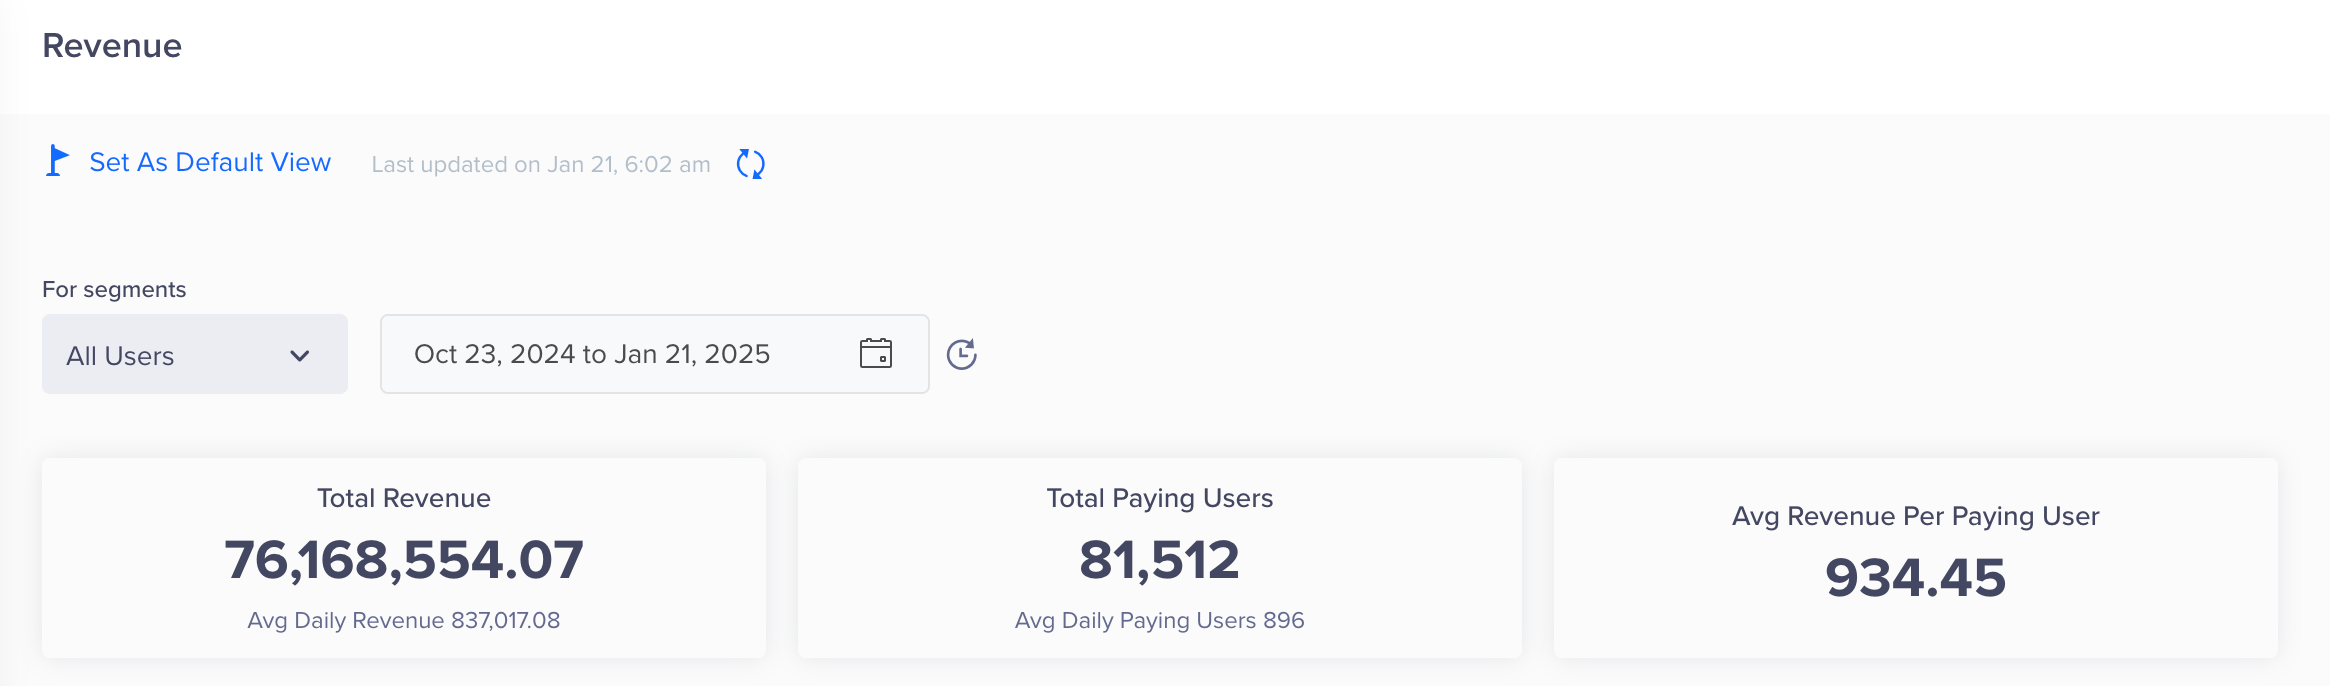
Revenue Numbers
The following metrics are displayed:
- Total Revenue: It is the overall income generated by the company from sales. For example, if an e-commerce company earns $1,00,000 monthly by selling products on the website. Here, $1,00,000 is considered the total revenue for that month.
- Total Paying Users: It refers to the number of customers who have purchased. For example, a video streaming platform has 10,000 users, but only 2,000 of them have subscribed to a premium plan. In this case, the total number of paying users is 2,000.
- Average Revenue Per Paying User (ARPPU): It measures the average amount of revenue generated from each paying user over a specific period. The ARPPU is calculated as (Total Revenue/Total Paying Users) over a specific period.
The revenue page also displays the following trends:
Trend of Revenue
The Trend of Revenue metric displays the historical trend or pattern of revenue generated over a specified period. It allows you to analyze how revenue has changed over time, identify trends, and make informed decisions about your business strategies.
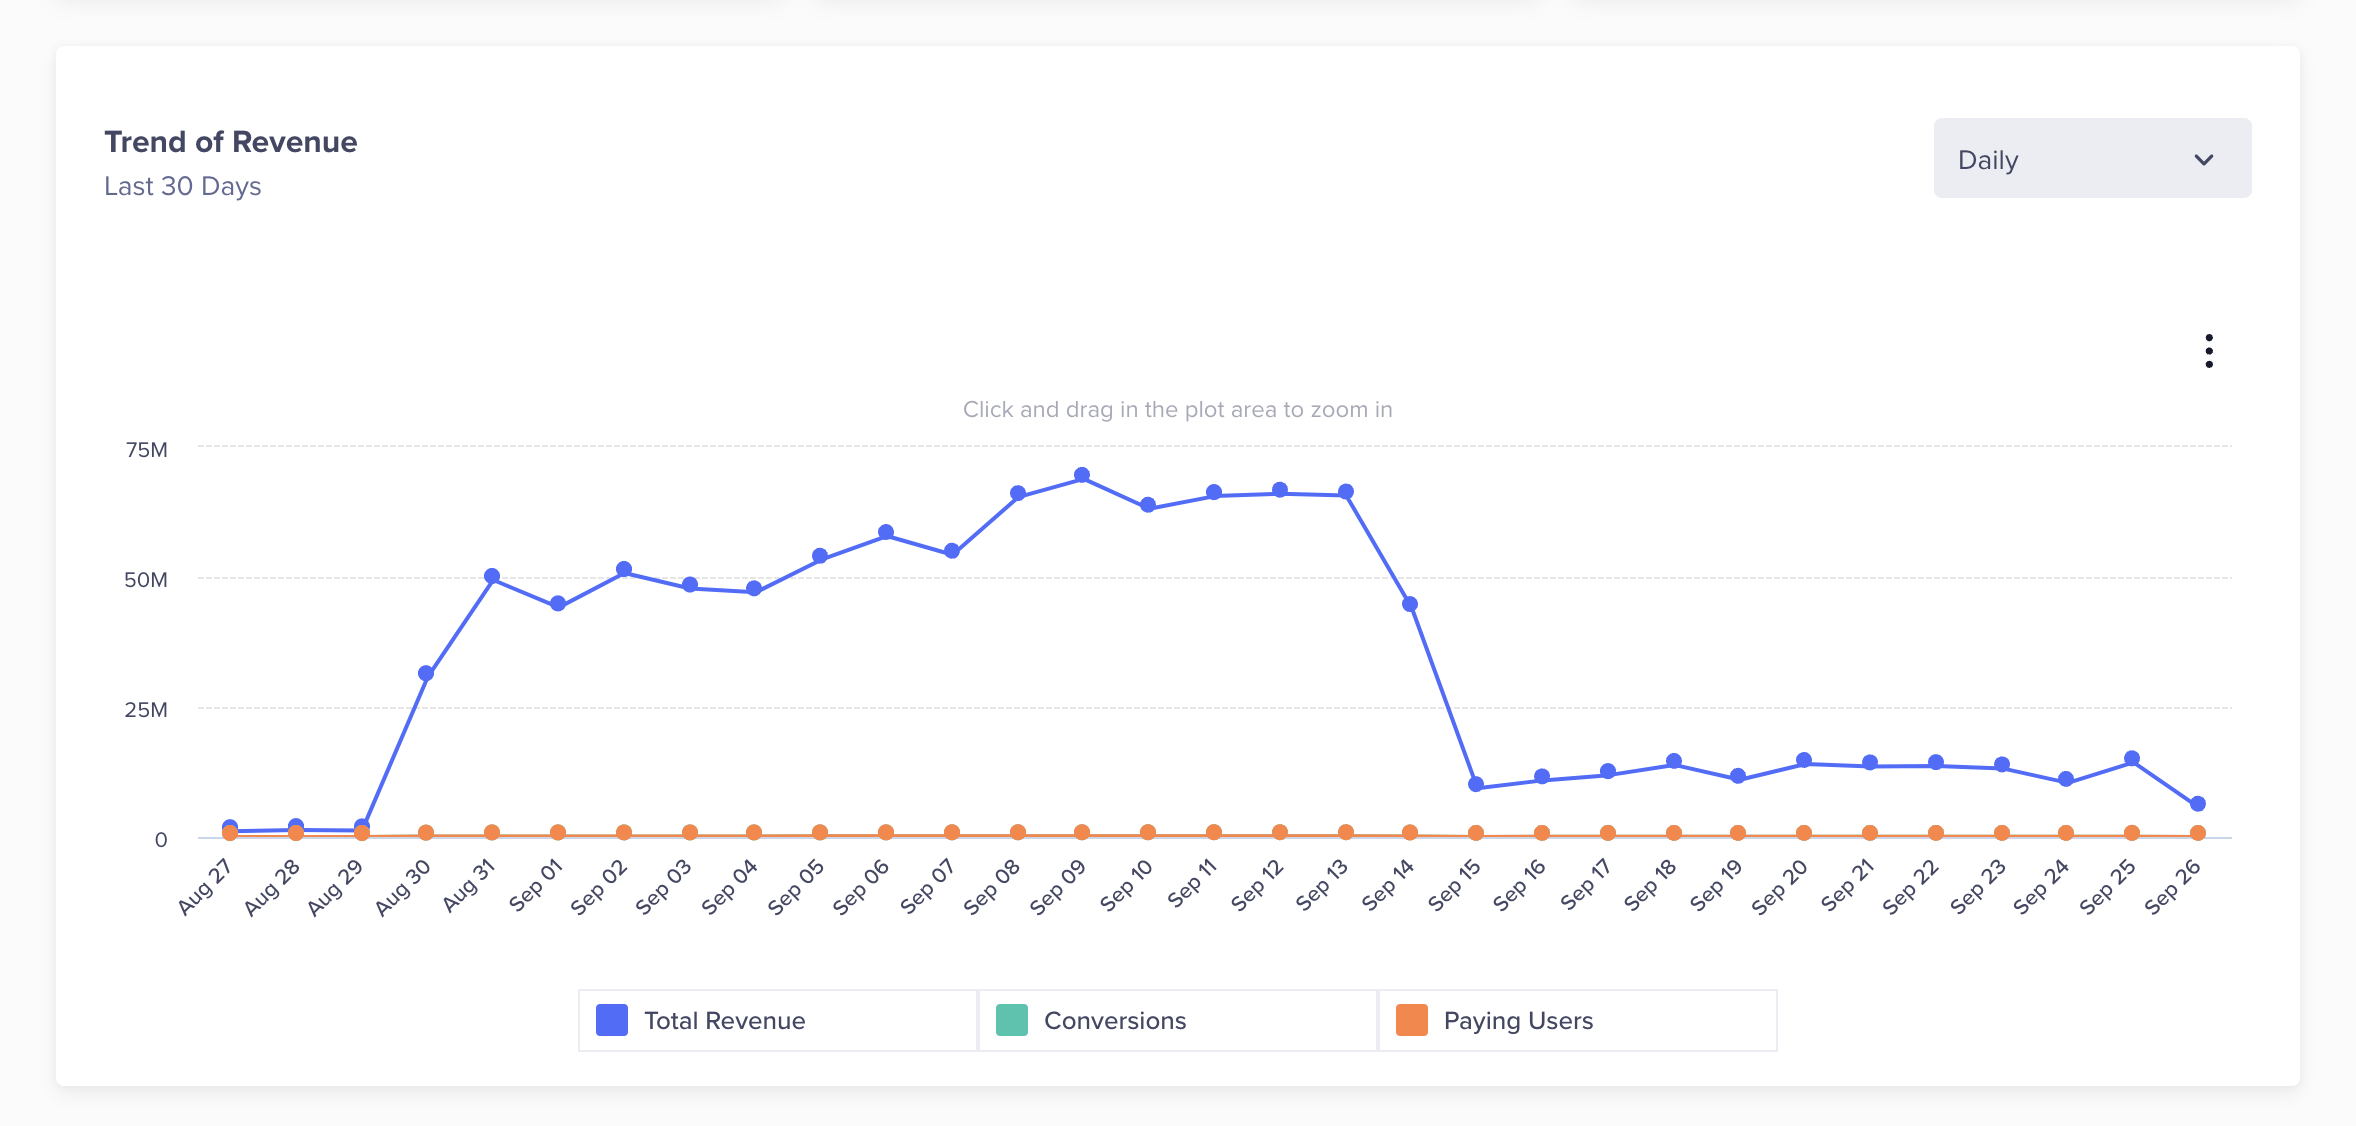
View the Trend of Revenue
Revenue Distribution by Device
The Revenue Distribution by Device metric provides a device-level breakdown of the revenue generated by a business or application. It helps you understand which devices contribute the most to your revenue and how user behavior and purchasing patterns vary across devices. It is valuable for businesses and app developers because it helps them optimize their strategies for different device types.
For example, if you have an Over the Top (OTT) app available on both Mobile and Desktop platforms. After collecting and analyzing the data, the Revenue Distribution by Device metric shows that Mobile devices generate 70% of your total revenue, while Desktop devices contribute 30%. Since Mobile devices contribute the most to your revenue, it is prudent to allocate your advertising budget and efforts primarily to mobile channels.
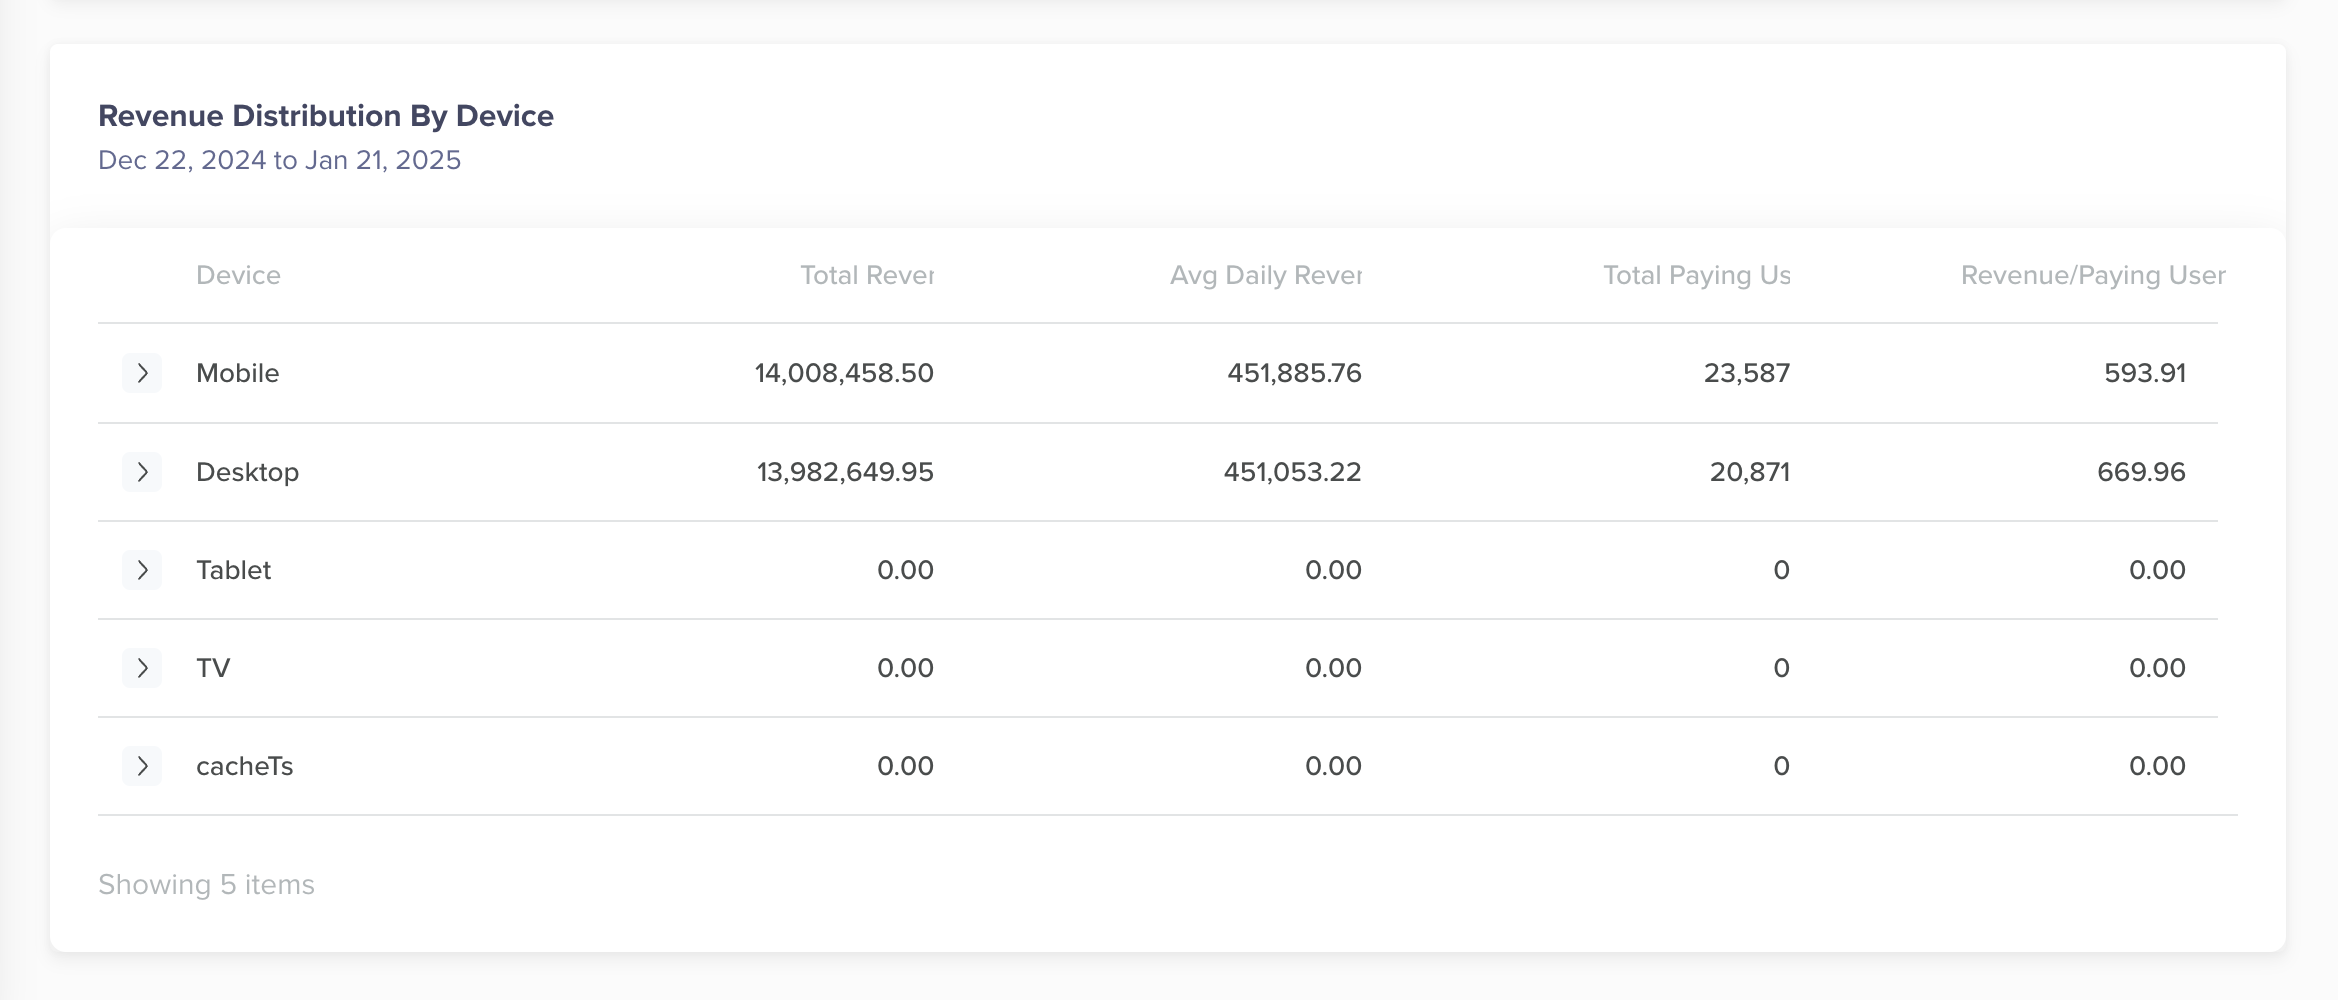
View Revenue Distribution by Device
Updated 8 months ago