Push Stats
Measure the performance of your push campaign.
View Push Campaign Stats
Once the campaign is live, you can view its stats by navigating to Push under Campaigns on the CleverTap dashboard and selecting the campaign of interest to view its deliveries, clicks, and conversions.

Filter by Channel
Click to open the selected campaign. The Stats page displays the overall campaign performance, including metrics such as reach, conversions, and goal completion.
Custom Conversion Window
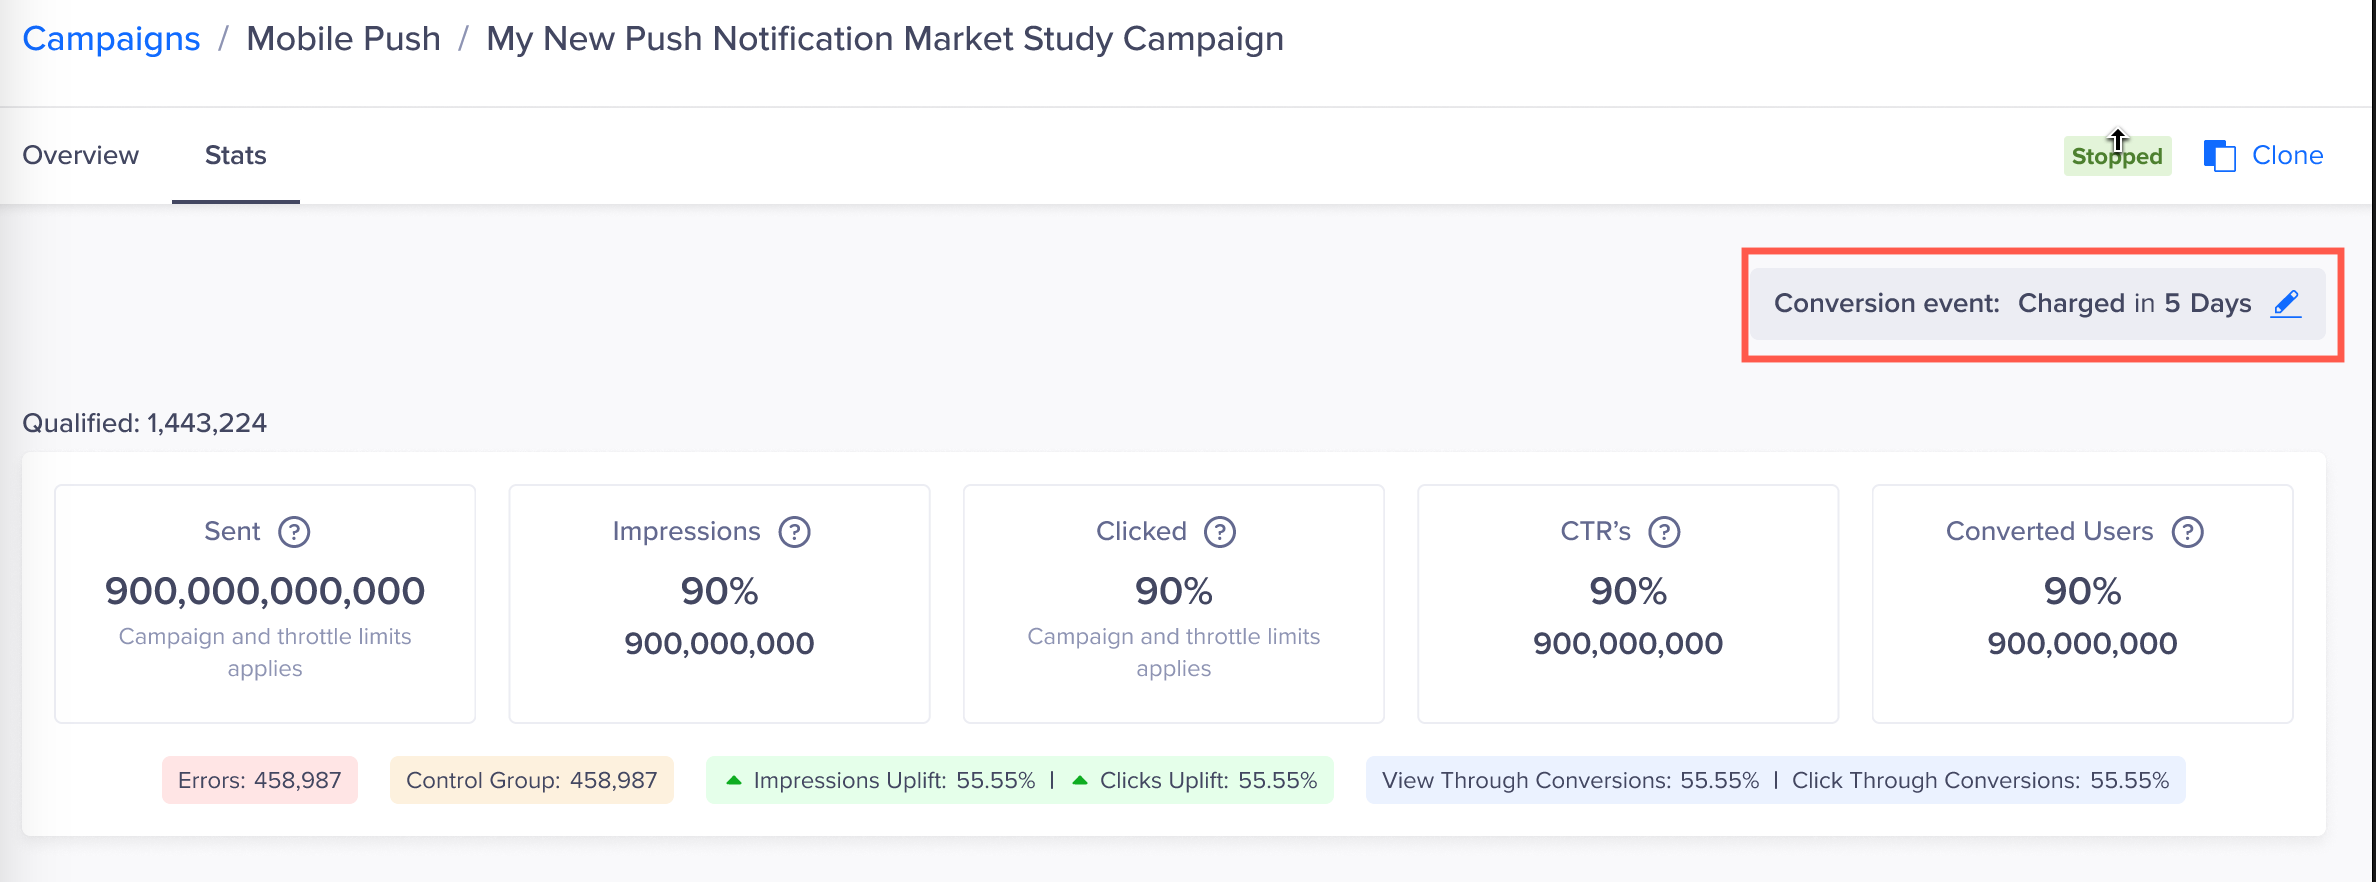
Under the Sent Conversions card, you can track the following stats for push notification campaigns:
- Qualified: The number of users qualified for the campaign.
- Sent: The total number of notifications sent to user devices.
- Impressions: The total number of devices that receive the notifications. Calculated with
(Impressions/Sent) * 100. Available only for CleverTap SDK 3.5.1 and above. - Uplift: Click to get details of the uplift achieved by Pull Notification and sending to App inbox.
- Clicks: Number of clicks generated by the campaign. Calculated as (Clicks/Sent) * 100.
- CTR: The clickthrough rate of the campaign. It is measured by (Click/Impressions) * 100.
- Converted users: The number of users that converted after receiving the campaign.
- Errors: The number of errors for the campaign. These errors can be technical, such as FCM-related errors, or non-technical, such as messages exceeding frequency.
- Control group: The number of users considered in the control group for the campaign.
- View through conversions: The users who converted after viewing the notification. View through conversions are measured by Users who converted after viewing / Users who were sent the notification * 100.
- Click through conversions: The users who converted after clicking the notification. Click through conversions are measured by [(Users who converted after clicking / Users who were sent the notification) x 100].

Sent Conversions
You can see the Conversion Event and Conversion Window defined for the campaign. In this example, the conversion event is Charged, and the conversion window is set to 5 days. This means that any user who performs the Charged event within five days of receiving the campaign will be counted as a conversion.
You can modify these details by clicking the ![]() icon next to the conversion information. This allows you to change the conversion event or adjust the conversion window to better align with your campaign goals and reporting needs.
icon next to the conversion information. This allows you to change the conversion event or adjust the conversion window to better align with your campaign goals and reporting needs.
Sample Single Message Campaign Stats
The following is a stats example of a single message campaign stats report:

Single Message Campaign Stats Report
Sample A/B Testing
The following is a stats example of an A/B testing campaign stats report:

A/B Testing Stats
The table will display results by the variants. The stats include Sent, Viewed, Clicked, CTR, and Errors, according to the channel.
You can also split the campaign stats and view the performance of each variant of the campaign.
Message Trend
Shows the daily, weekly, and monthly trends for campaign messages.

Daily Message Trend
Conversion Performance
It shows Conversion performance, Revenue performance, Users conversion funnel, and Influenced conversion funnel.
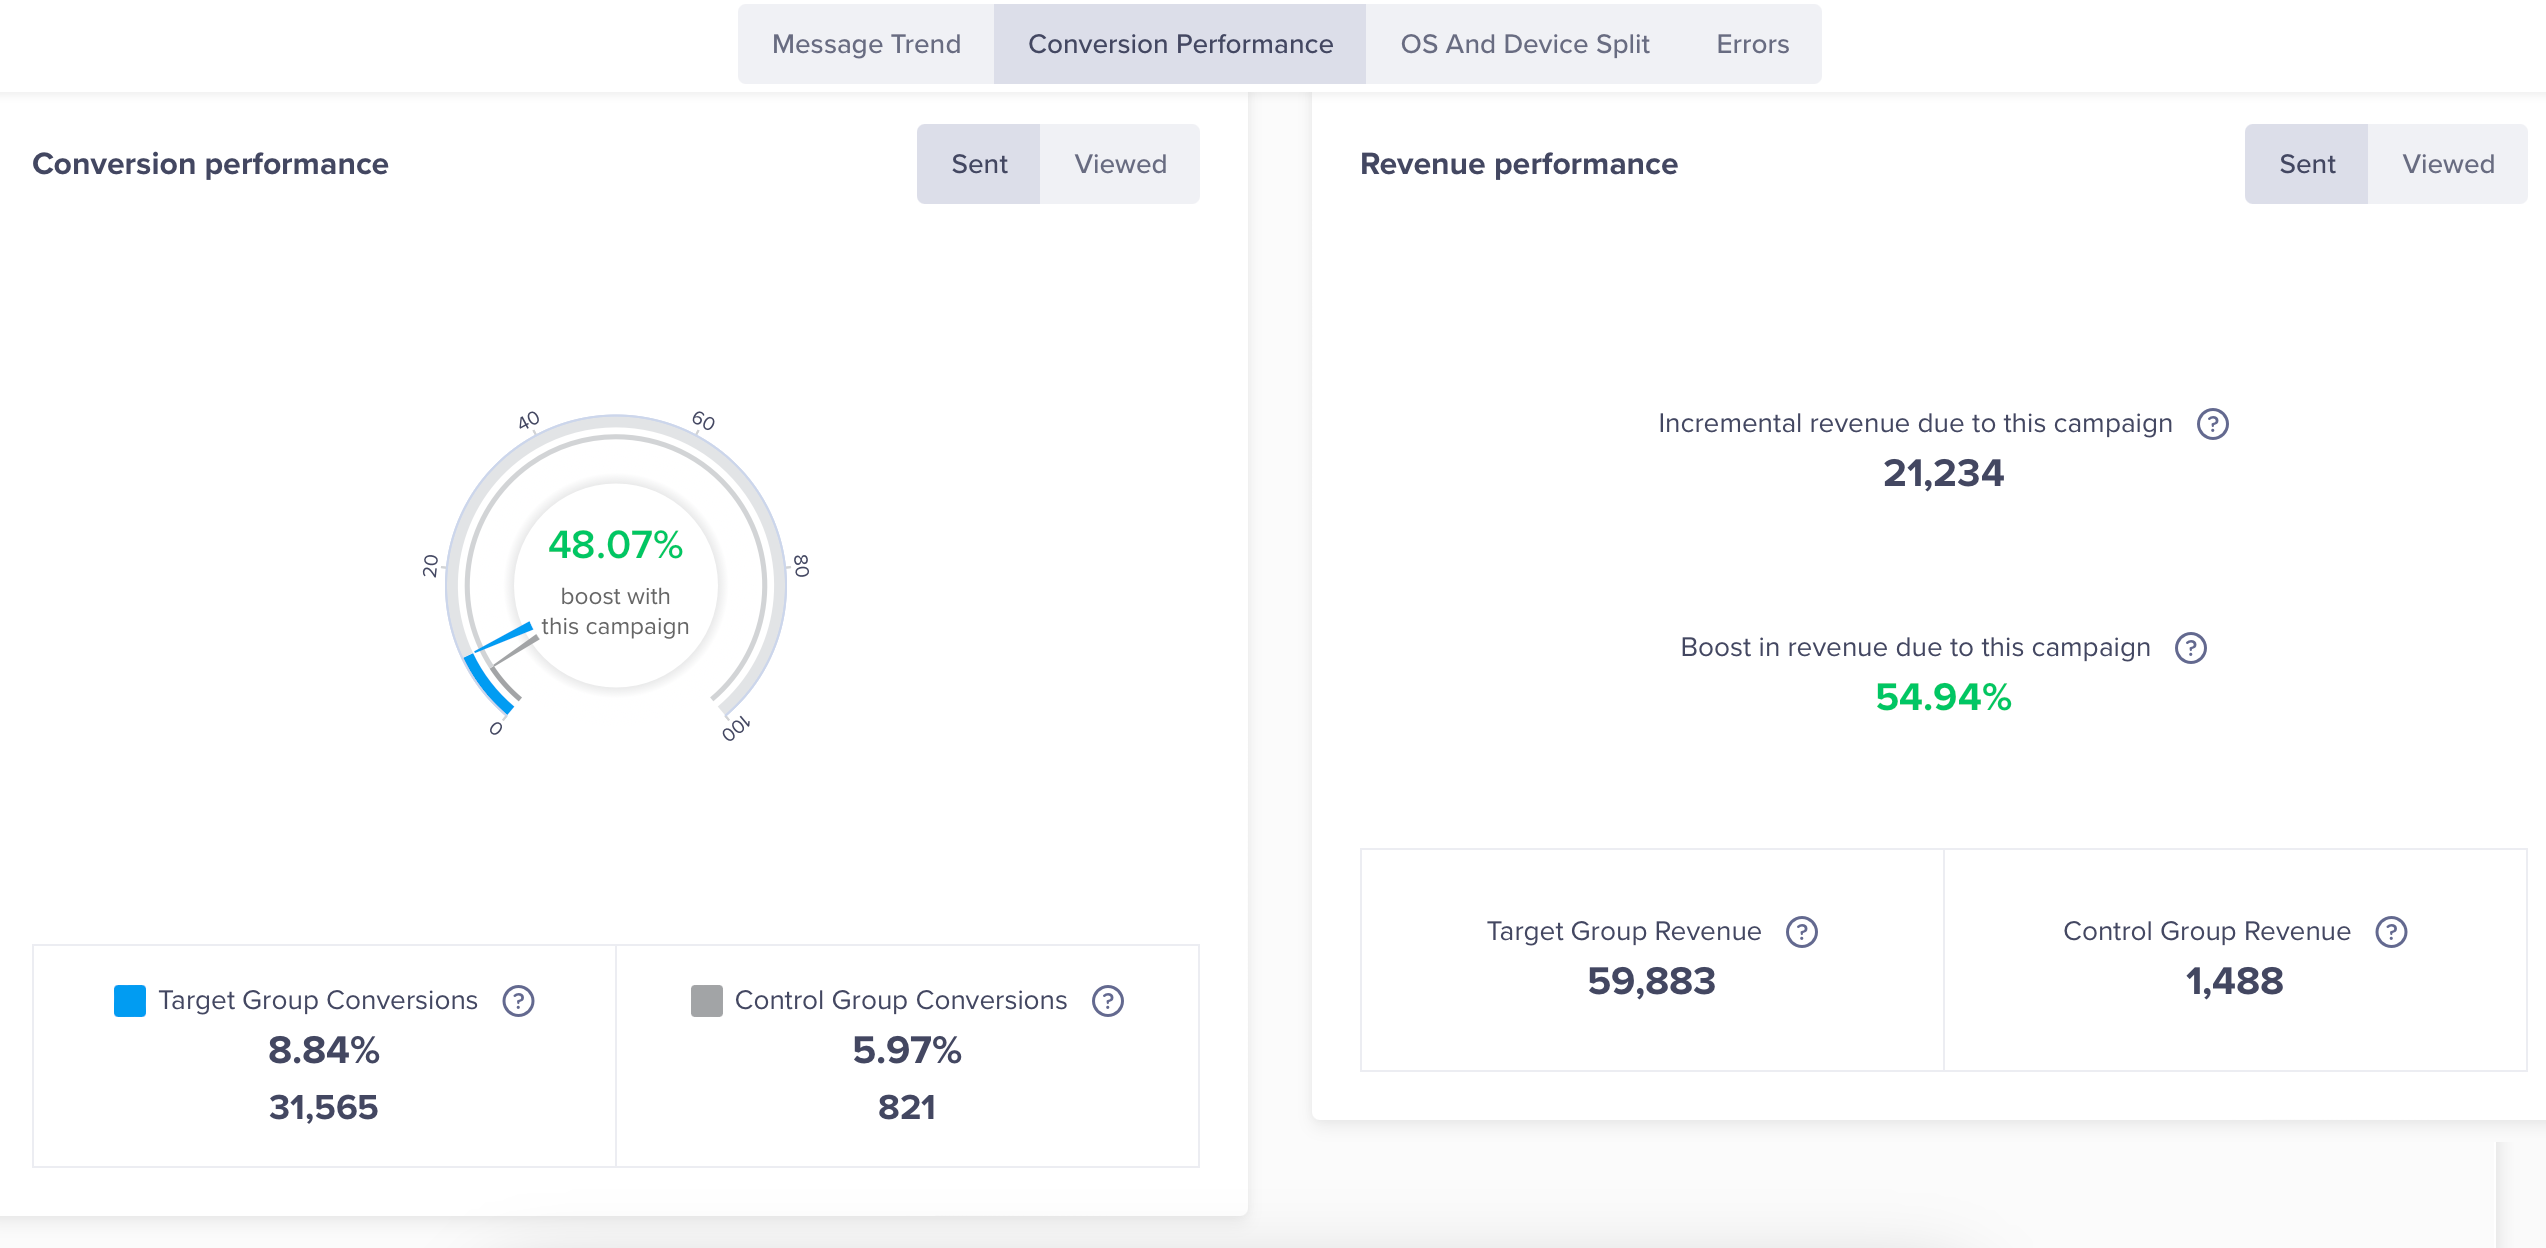
Conversion Performance and Revenue Numbers shown In the Table
For A/B Test, Split Delivery, and Message on User Property campaigns, you can view stats for each variant under both the Direct and Influenced Conversion Funnel.

Users Conversion Funnel

Influenced Conversion Funnel
Key Points to RememberThe Conversion Performance number for All Variants may be equal to or less than the combined Conversion Performance number for each individual variant. For example, if the Conversion Performance number for All Variants is 10500, with Variant A at 5575 and Variant B at 5053, the total for Variants A and B combined is 10628, exceeding the total for All Variants.
This scenario can occur due to the following reasons:
- For Live campaigns, different variants are delivered to various devices, identified by different GUIDs for the same user. Consequently, the Conversion Performance number for All Variants might not match the sum of the Conversion Performance numbers for each variant. For instance, a user may receive Variant A before uninstalling the app and then receive Variant B after reinstalling it until their identity is established.
- For Recurring campaigns (user property campaigns), the user can qualify more than once when and receive different message copy each time. For example, the user upgrades to a new plan. In this case, the message copy received by the user before and after upgrading the Membership type can be different.
In both the cases, the same user is counted twice, once for Variant A and once for Variant B. However, when calculating the Conversion Performance number for All Variants, each user is counted only once.
OS and Device split
The impressions by the OS, such as iOS or Android, and devices.

Impression split by OS and Devices
Errors
You can view campaign errors from the Stats > Errors tab.

Push Stats Errors
For more information about errors or troubleshooting issues, refer to Push Notification Troubleshooting.
Updated 4 months ago