Web Pop-up Stats
Understand all the statistical information available for your Web Popup campaign
Viewing Web Pop-up Campaign Stats
Once the campaign has been published, you can view the statistics from the dashboard. Click Campaigns > select the specific campaign from the campaign list. A Stats page opens up where you can view the total Views, Clicks, Conversions, CTR, and Conversion Performance.

Web Pop-up Campaign Stats
- Views: Represents the number of times a Web Popup is viewed.
- Clicks: Represents the number of times users have clicked on the Web Popup.
- CTR: Represents the ratio of Clicks to Views. (CTR = Clicks/Views * 100).
- Trend charts: Represents trends in data over a specific period of time (for example daily, weekly, monthly).

Performance Trends
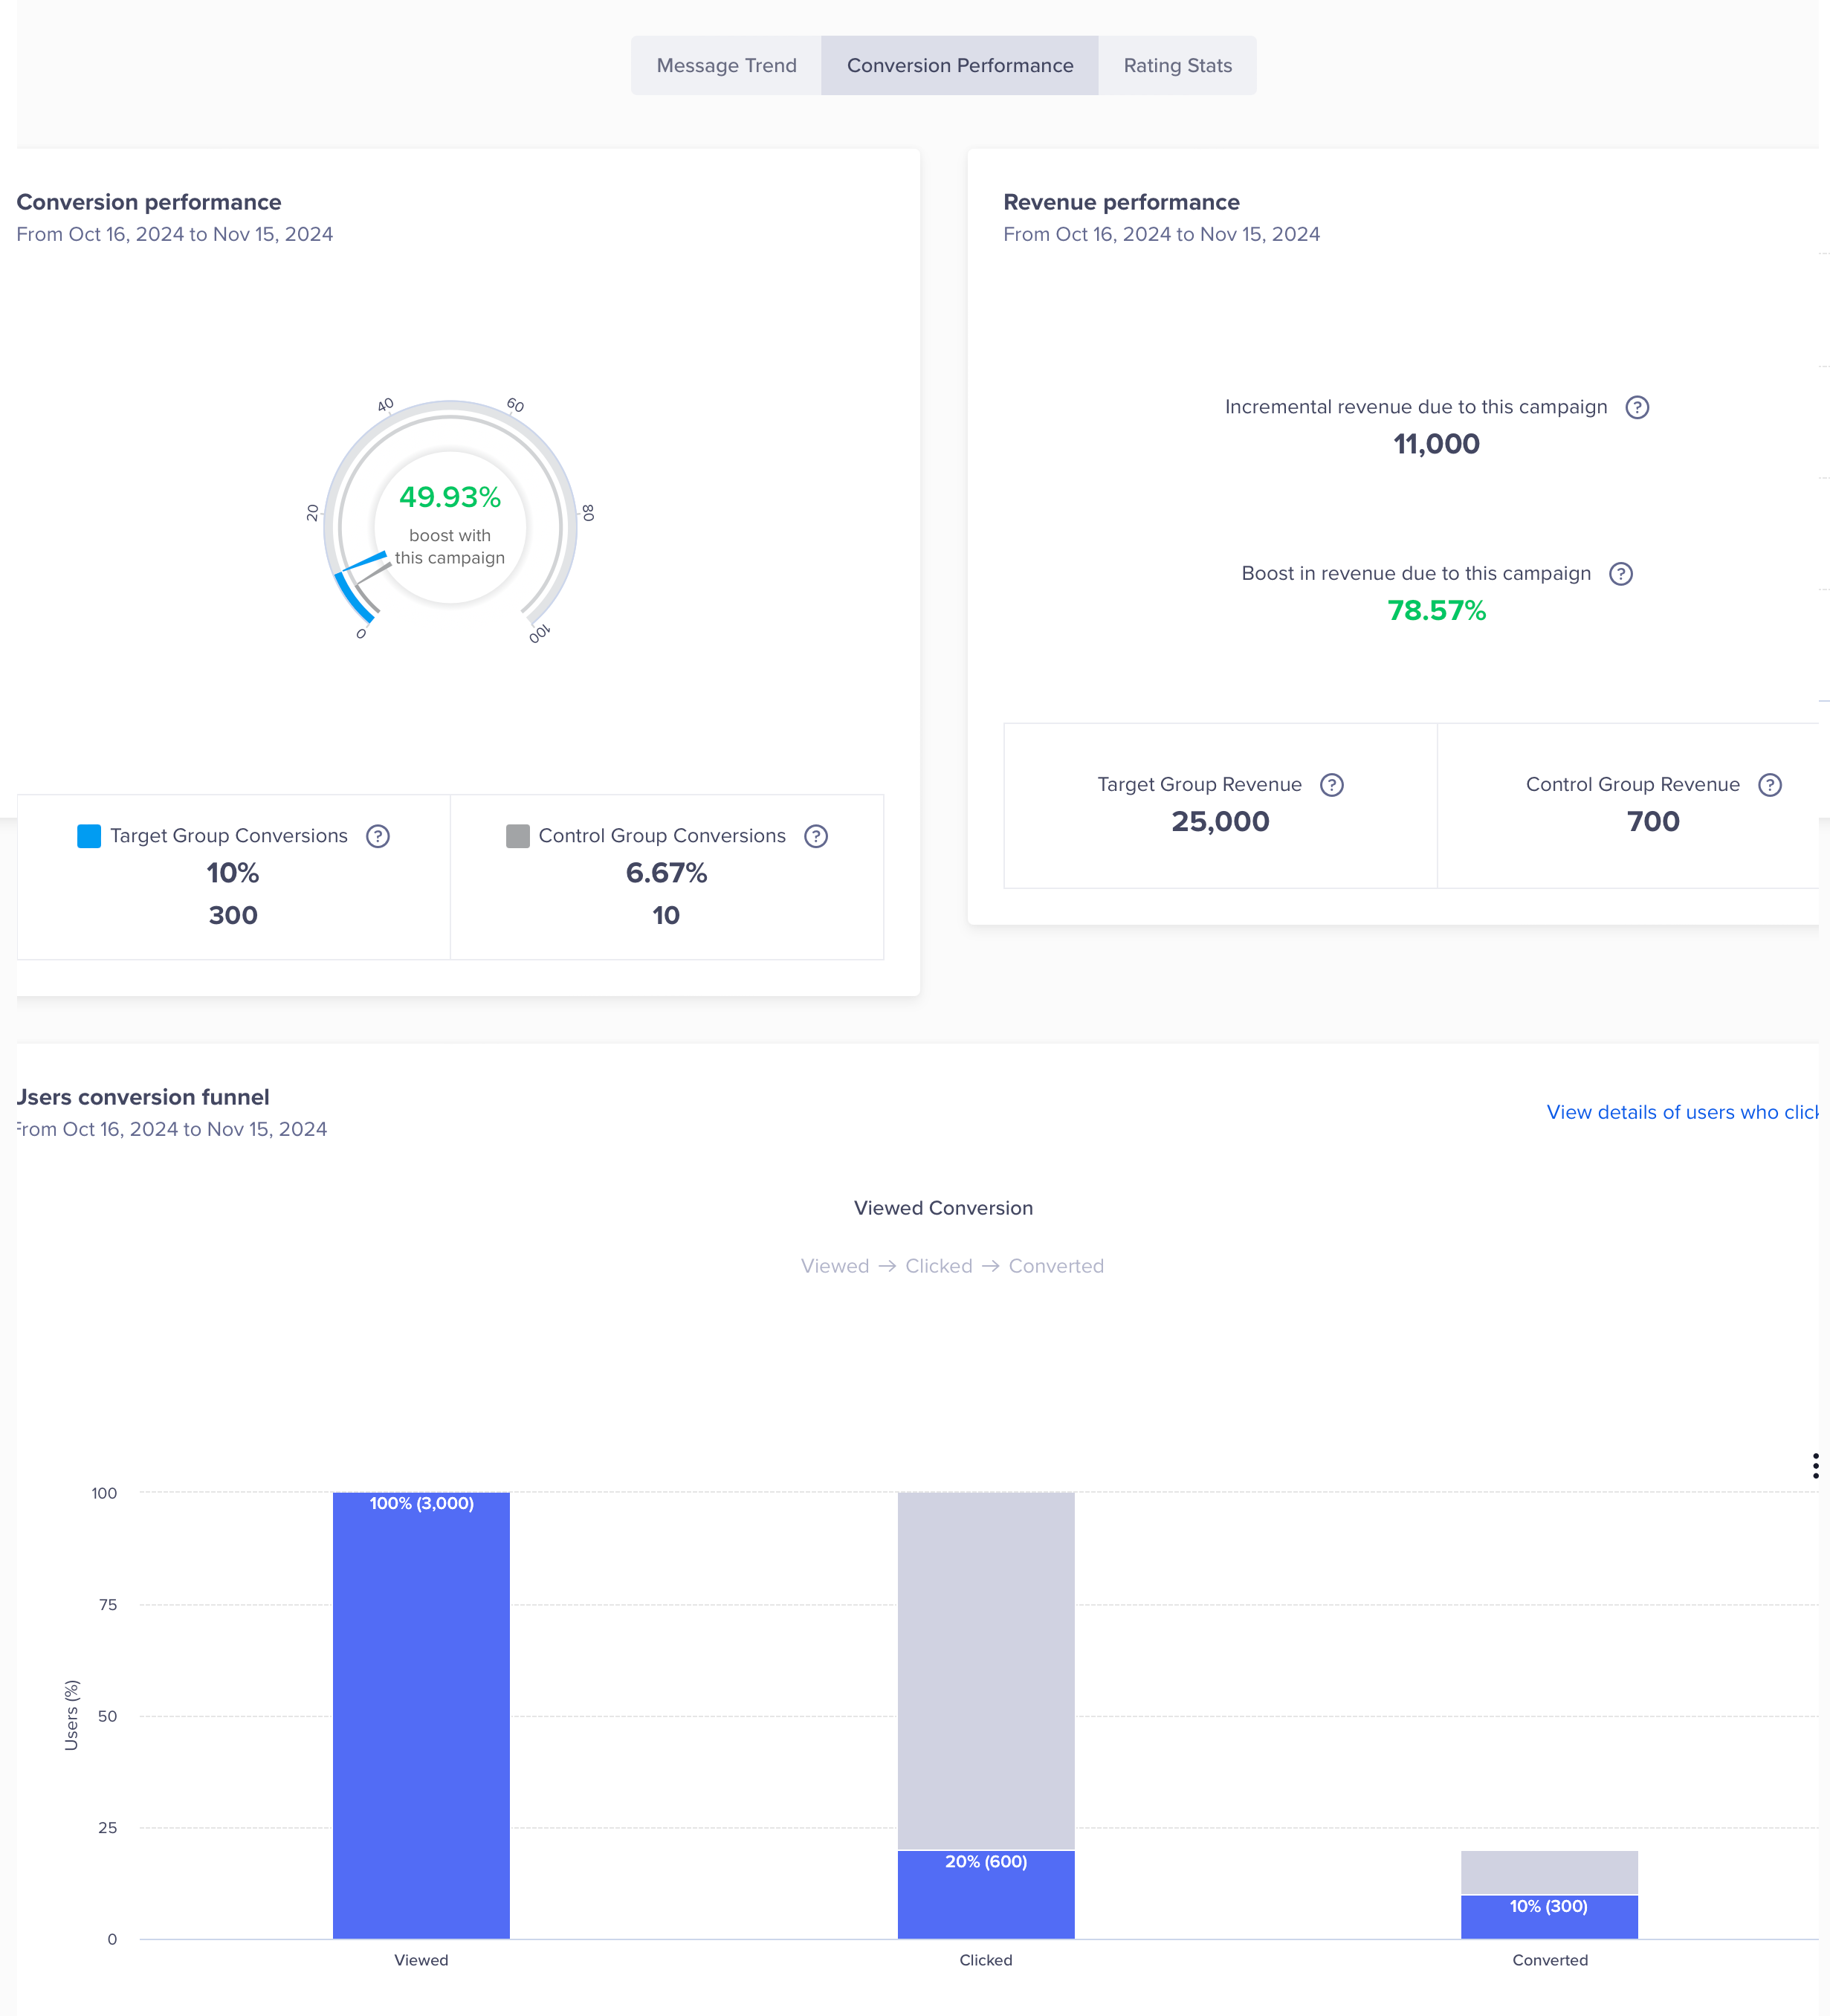
Web Pop-up Conversion Performance
Split of Clicks
You can track the distribution of clicks on each CTA that you include in your Web Popup campaign. For example, you want to send a Web Popup promotion for an upcoming movie on your video streaming app. You can create a Web Popup campaign, add CTAs for reviews, promotions, movie merchandise, and more, and then send it. We will record the clicks for each CTA in the Web Popup, and you can view them on the Campaign Stats page.
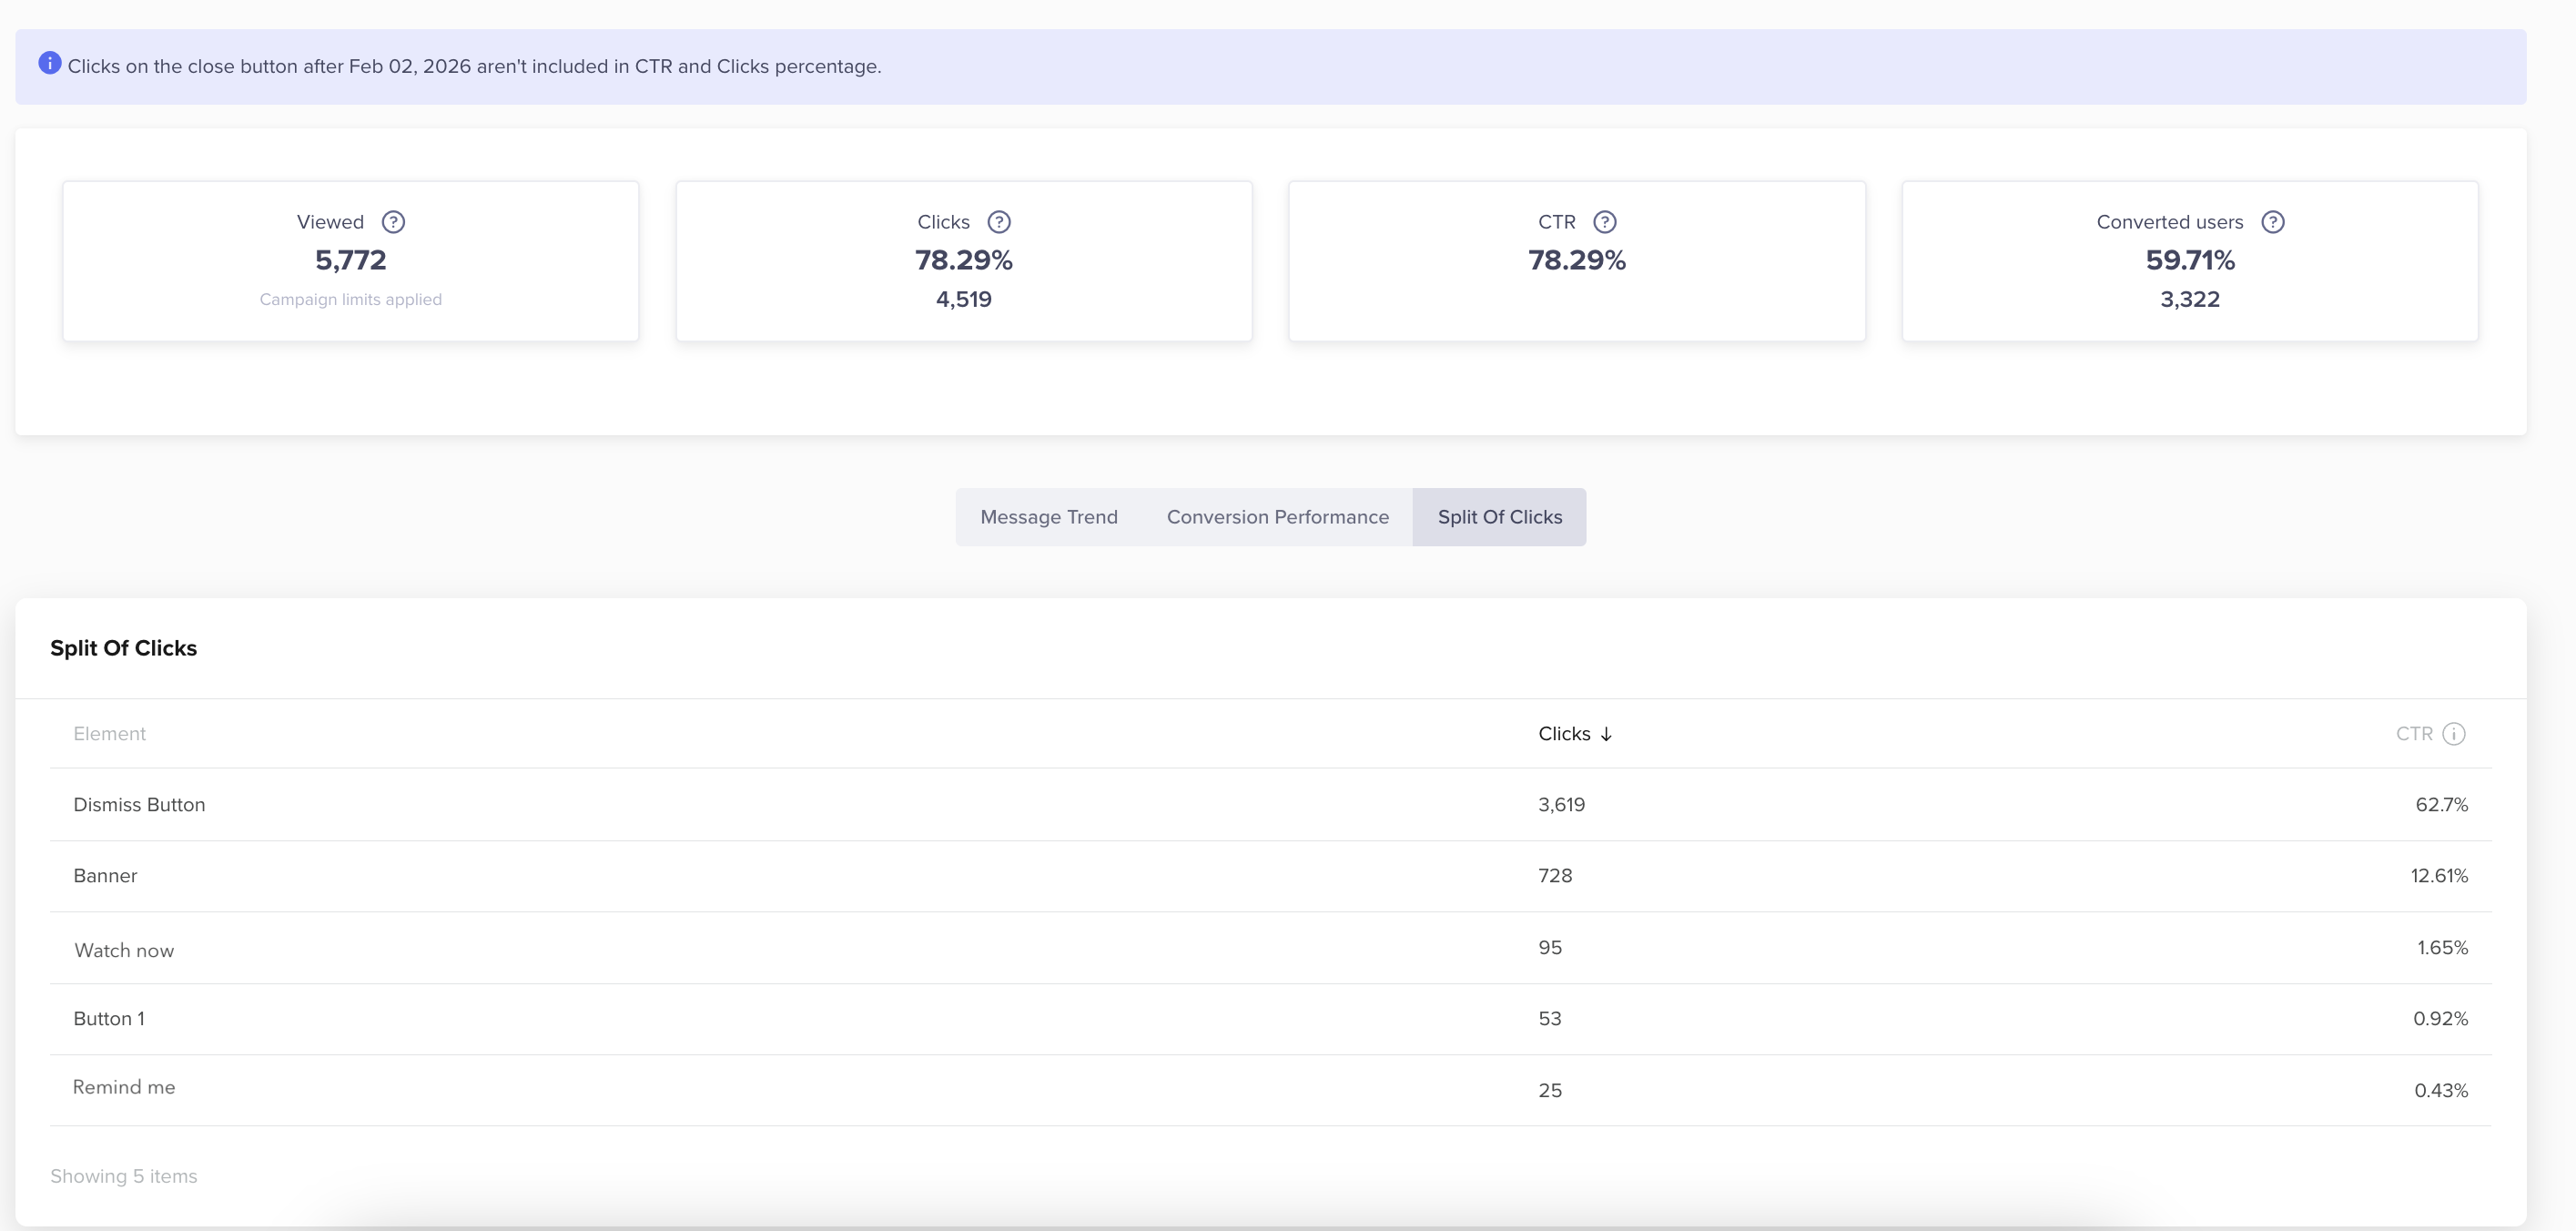
Split of Clicks
Ratings Performance
To view the Ratings Performance, click Campaigns, then select the specific campaign from the list. Under the Ratings Performance tab, you'll find trend charts for Average Ratings and Total Responses Received. The view for trend charts can be toggled to Daily, Weekly and Monthly basis. Besides you can also view the Rating distribution for the past 30 days.

Ratings Performance
NPS Performance
To view the NPS Performance of your Web Popup, navigate to the NPS board available under the Boards tab. Apply the appropriate filters (by date, campaign ID) to fetch the data for the respective campaign.
Updated 6 months ago