
Annotations in Analytics
Learn how to add contextual notes directly to trend charts to capture the story behind your data.
Overview
When a chart in Analytics shows a sudden spike or dip, the chart itself does not always tell you the reason for the sudden spike or dip. The reason usually lives elsewhere, such as in an email or Slack thread, a marketing calendar, or the memory of whoever ran the campaign that week. A few weeks later, that context is gone. Annotations solve this problem for an analysis.
An annotation is a note attached to a specific date, or a range of dates, on a Trends chart. Once added, it appears as a small marker below the trendline for everyone in your account. Hover over the marker to read the note. Annotations persist across sessions, so a note added today is still there for a teammate who opens the same chart next quarter.
Annotations help across roles in the following ways:
- A performance marketer marks the day a campaign went live, so a spike in conversions is self-explanatory.
- A data analyst marks the date range of a data pipeline incident so a dip in event volume is not mistaken for a real drop in user activity.
- A product manager scans the chart, views every annotation at a glance, and clicks it to read the full note.
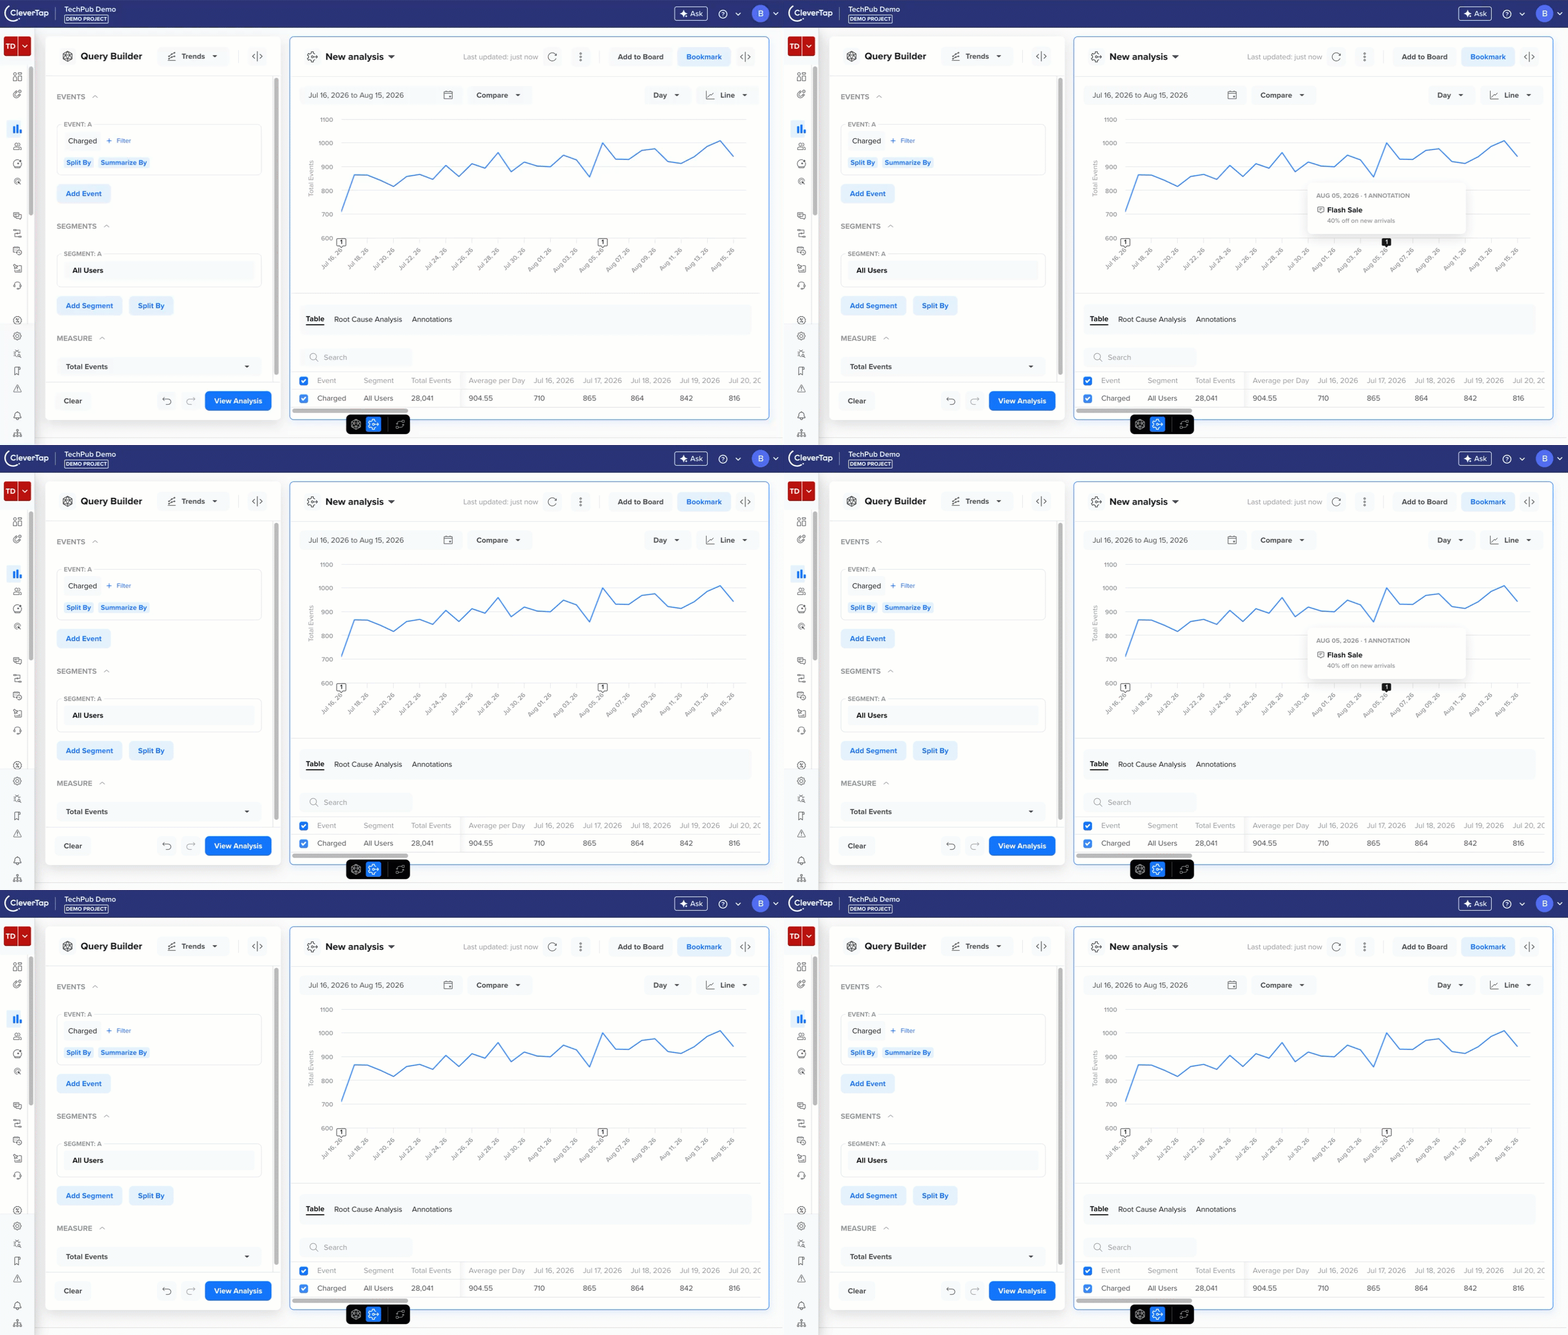
Annotation markers on a Trends chart
Annotations Access Controls
Annotations are public within your CleverTap account. There are no private annotations. The entire team reads every note.
The following table shows who can perform each action on an annotation:
| Action | Account Admin | Annotation Creator | Other Members |
|---|---|---|---|
| Create an annotation | Yes | Yes | Yes |
| View annotations on a chart | Yes | Yes | Yes |
| Bulk upload annotations using a CSV file | Yes | Yes | Yes |
| Edit an annotation | Yes, any annotation | Yes, own annotations only | No |
| Delete an annotation | Yes, any annotation | Yes, own annotations only | No |
| Open the Manage Annotations page | Yes | Yes | Yes |
Creating Annotations
An annotation is created for a trendline, and the annotation creation asks you to make two independent choices. Understanding these two choices removes most of the confusion around creating annotations. The following are the two fields:
Entry Type
The Entry Type field determines whether you create one annotation or many at once. You can select one of the following options:
- Single: Fill in a form and create one annotation.
- Bulk: Upload a CSV file and create multiple annotations in one upload, for example, an entire quarterly promotions calendar.
Date Selection
The Date Selection field determines whether the event occurred on a single day or spanned multiple days. You can select one of the following options:
- Specific date: Select this field if the event occurred on a single day, such as an app release.
- Date range: Select this field if the event spans multiple days, such as a three-day sale.
The two choices are independent of each other. A single annotation can use a date range, and a bulk CSV file can contain a mix of specific date and date range rows.
The following table shows how a few common e-commerce events map to these choices:
| Event | Entry Type | Date Selection |
|---|---|---|
| One app release on September 19 | Single | Specific date |
| One flash sale from October 3 to October 5 | Single | Date range |
| The full festive quarter calendar with 15 events | Bulk | Mixed, decided row by row in the CSV file |
Annotation Options
The Add Annotation option allows you to add the following fields:
| Field | Required/Optional | Description |
|---|---|---|
| Entry type | Required | Select Single to create one annotation with the form, or Bulk to upload a CSV file. |
| Name | Required | A short, specific name for the event, up to 30 characters. This is what appears on the chart marker and in lists, so make it recognizable at a glance. |
| Description | Optional | Additional context (up to 70 characters). Use it to capture the reason behind the event, not a repeat of the name. |
| Date selection | Required | Select Specific date for a single day, or Date range for a period spanning more than one day. |
| Date | Required for Specific date | The day the event occurred. If you open the Add Annotation window by clicking a point on the chart, this is filled in for you. |
| Start date and End date | Required for Date range | The first and last day of the event. The end date must fall on or after the start date, and within 365 days of it. |
Create a Single Annotation
Consider an example in which you manage an online fashion store and run a Weekly Flash Sale from July 29 to August 5, resulting in a visible spike in the Charged trend.
To annotate it:
- Open the Charged trend in Analytics > Trends, then click the data point for July 29.
- Click Add Annotation.
- Select Single under Entry type.
- Enter a name for the annotation, for example, Weekly Flash Sale.
- Enter a description for the annotation, for example, Weekly Sale (July 29 to August 5).
- Select Date range in the Date selection field, and set the duration from July 29 to August 5, since the sale spanned 9 days.
- Click Add.
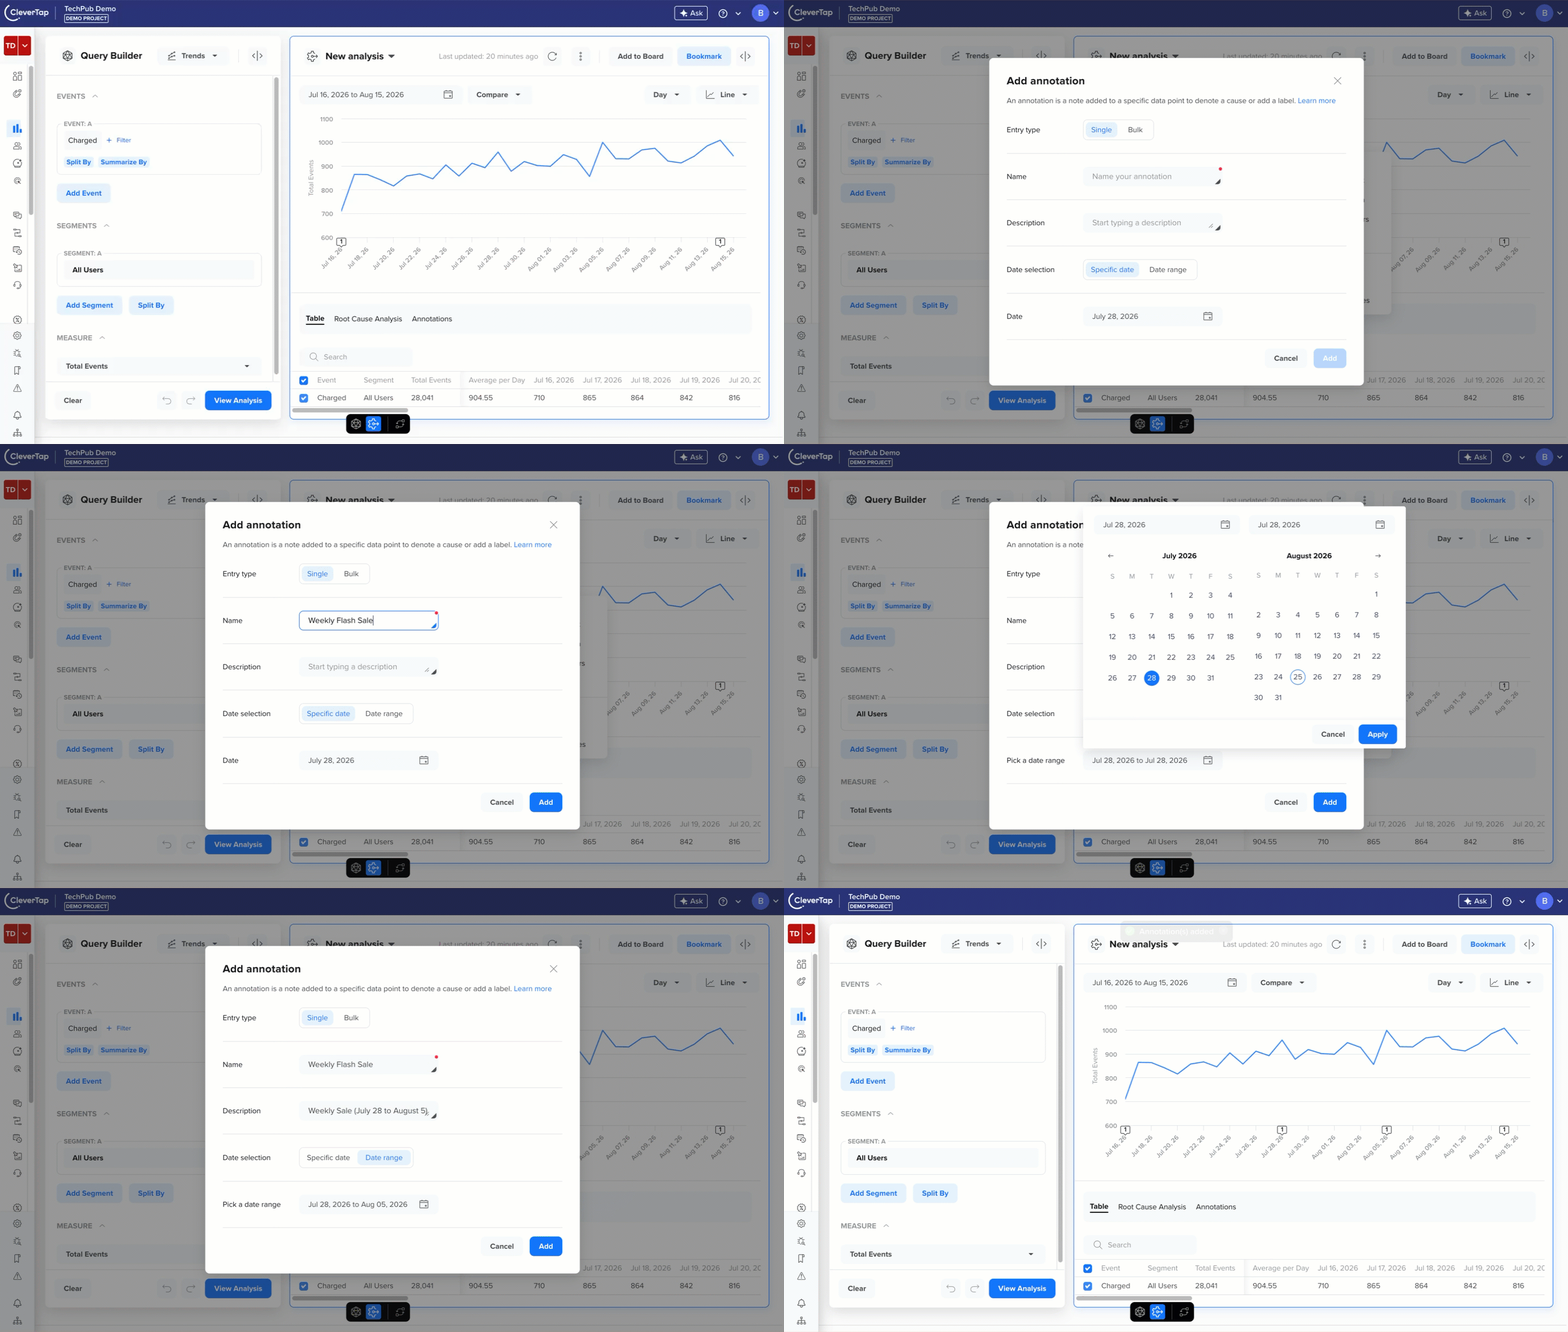
Create a Single Annotation
The annotation immediately appears on the chart. Anyone who opens this chart later and hovers over the annotation sees the sale Name and Description, so the spike explains itself.
If the sale has lasted only for one day, for example, a One Day Stock Clearance Sale, you could instead keep the Specific date selected in step 6 and enter a specific date for the annotation.
Date Range SelectionA Date range annotation can span a maximum of 365 days. The date picker does not stop you from selecting a longer range while you are choosing dates. Instead, you will see an error message when you select Add if the range you picked exceeds 365 days.
Create a Bulk Annotation
If you already keep a marketing or release calendar in a spreadsheet, you can upload it as a batch of annotations instead of creating each one by hand.
To create a Bulk upload of annotations:
- Open the Charged trend in Analytics > Trends.
- Click Add Annotation.
- Click Bulk under Entry type.
- Click Sample CSV to download a template with the correct column headers and an example row.
- Update the file using the column structure described in the Sample CSV file.
- Drag your file into the upload area, or select it from your computer.
- Click Add.
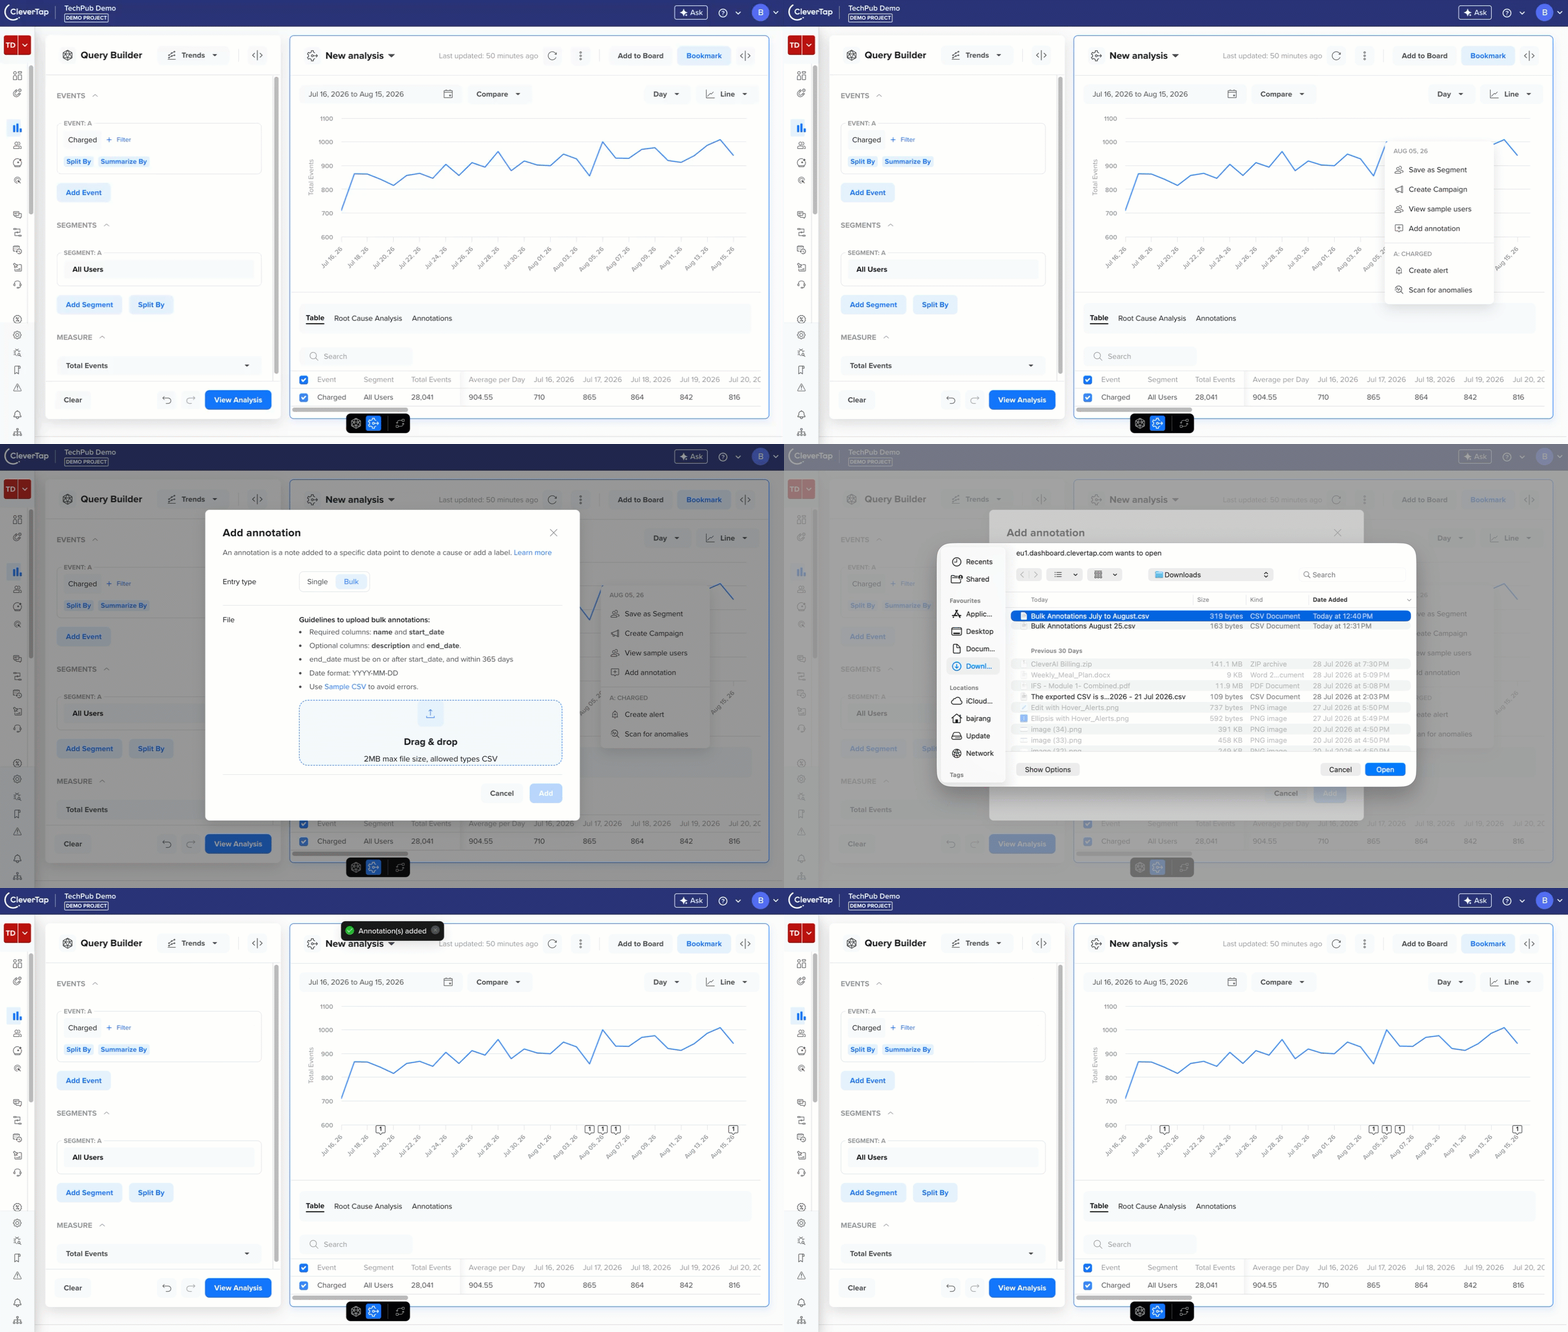
Create Bulk Annotations
On success, a confirmation message appears, and CleverTap adds all the annotations from your file.
Errors Handling in Bulk UploadThe upload is all or nothing, meaning if even one row fails validation, the system does not add any of the rows in the file. You can view the number of rows that failed along with a Download error report link. The report lists the row number, the column, and the reason for each failure, so you can fix your file and upload it again.
Also, CleverTap allows duplicate rows, meaning the same name and date appearing more than once, and does not check for them during a bulk upload. If you upload duplicates by mistake, remove them from the Manage Annotations page.
CSV File Structure
Your file must be a CSV, encoded in UTF-8, no larger than 2 MB, and no more than 5,000 rows. The following is the CSV file structure for Bulk annotations:
| Column | Required/Optional | Format | Notes |
|---|---|---|---|
| name | Required | Text, up to 30 characters | The name is shown on the marker and in lists. |
| start_date | Required | YYYY-MM-DD | Use the ISO date format, for example, 2026-11-08. |
| end_date | Optional | YYYY-MM-DD | Leave blank to create a specific date annotation. If present, it must fall on or after start_date, and within 365 days of it. |
| description | Optional | Text, up to 70 characters | If your description contains a comma, wrap the whole value in quotation marks. |
Continuing the fashion store example, suppose you want to load the entire festive quarter at once. Save the following as festive_quarter_calendar.csv:
name,start_date,end_date,description
Diwali Sale,2026-11-08,2026-11-12,20% off across all categories
iOS App v4.2 Release,2026-09-19,,Introduces the new referral flow
Server Maintenance Window,2026-08-14,,"Checkout was unavailable for 3 hours"
Flash Sale Weekend,2026-10-03,2026-10-05,40% off on new arrivals
In the above examples, the Diwali Sale and Flash Sale Weekend rows include an end_date, so they become date range annotations. The iOS App v4.2 Release and Server Maintenance Window rows leave end_date blank, so they become specific date annotations. To leave end_date blank, keep nothing between the two commas, as in the sample file.
View Annotations on a Chart
Each annotation appears as a small marker in a row just below the trendline, aligned with its date. Hover over a marker to see the date, the annotation name, and the description as shown in the image below:
View an Annotation Marker
Annotations Tab
Every Trends chart has an Annotations tab next to the Table and Root Cause Analysis tabs. It lists every annotation whose date or date range falls within the chart's current date filter.
Select a marker to open the Annotations tab below the chart and read that entry. If a data point has more than one annotation, its marker shows the number of annotations. Click that marker to open the Annotations tab, where every annotation for that date appears.
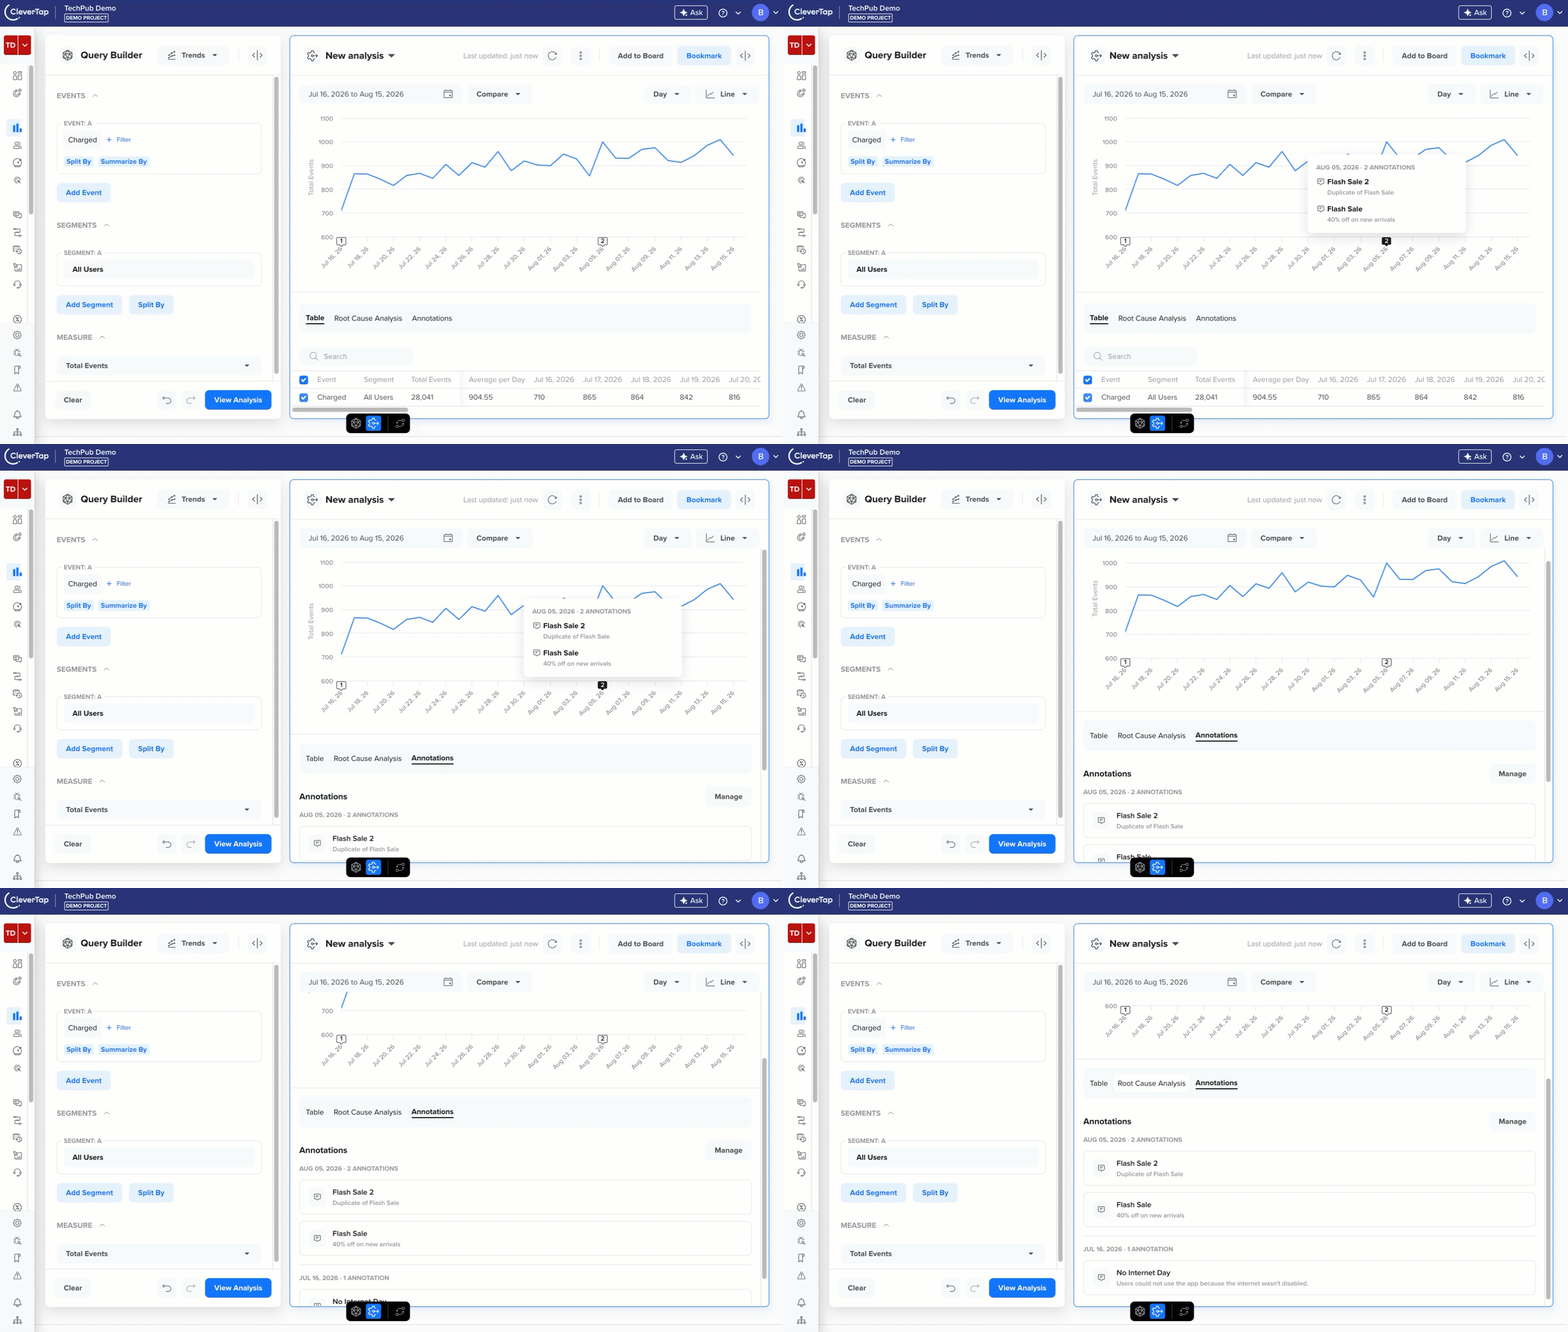
View All Annotation Markers
Date Range Annotations on the Chart
A date range annotation appears as two markers, one at the start date and one at the end date. The chart shows nothing on the days in between, so the annotation row stays uncluttered even for a long range. Both markers open the same annotation, and hovering over either one shows the complete date range.
For example, the following image shows the annotation markers for the start and end dates of the Weekly Flash Sale from July 29, 2026 to August 5, 2026.
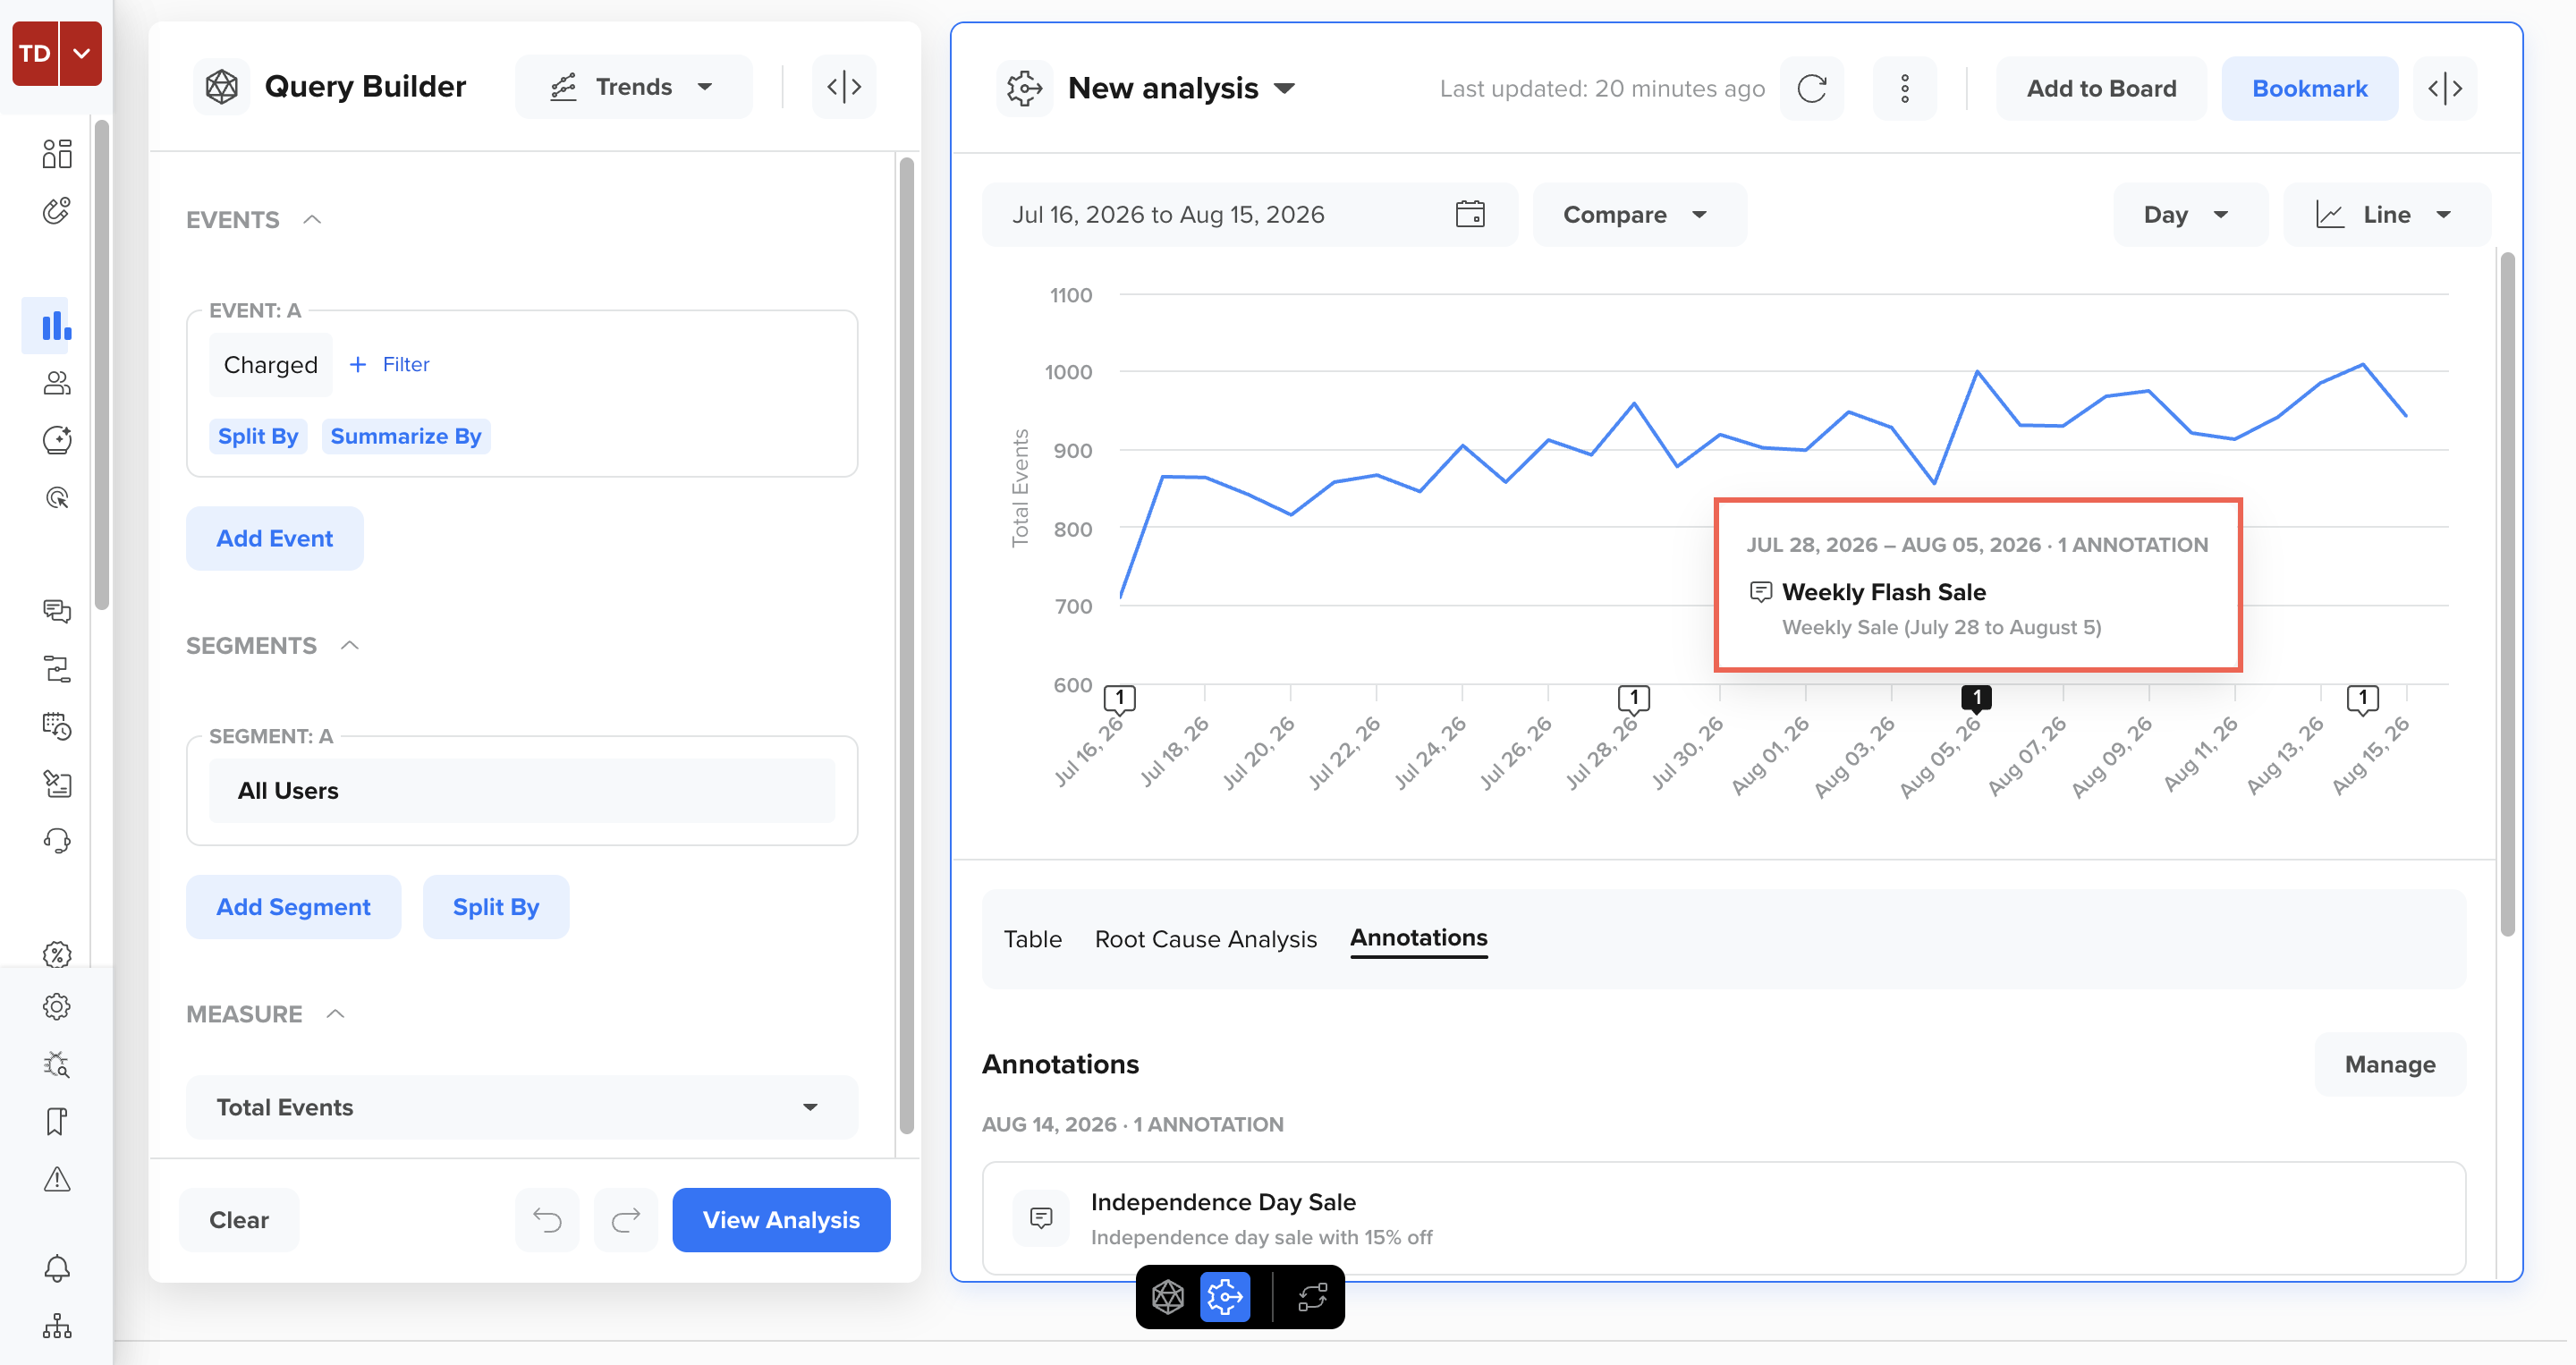
View Annotation Markers for a Date Range Annotation
View Annotations at Different Chart Granularities
Trends charts can be viewed by Day, Week, or Month. Annotations always keep their true dates, and the chart groups markers to match whichever granularity you are viewing.
| Granularity | Marker Behavior |
|---|---|
| Day | One marker per day. |
| Week | CleverTap groups all annotations that fall within a week into a single marker for that week and shows the total count. |
| Month | CleverTap groups all annotations that fall within a calendar month into a single marker for that month and shows the total count. |
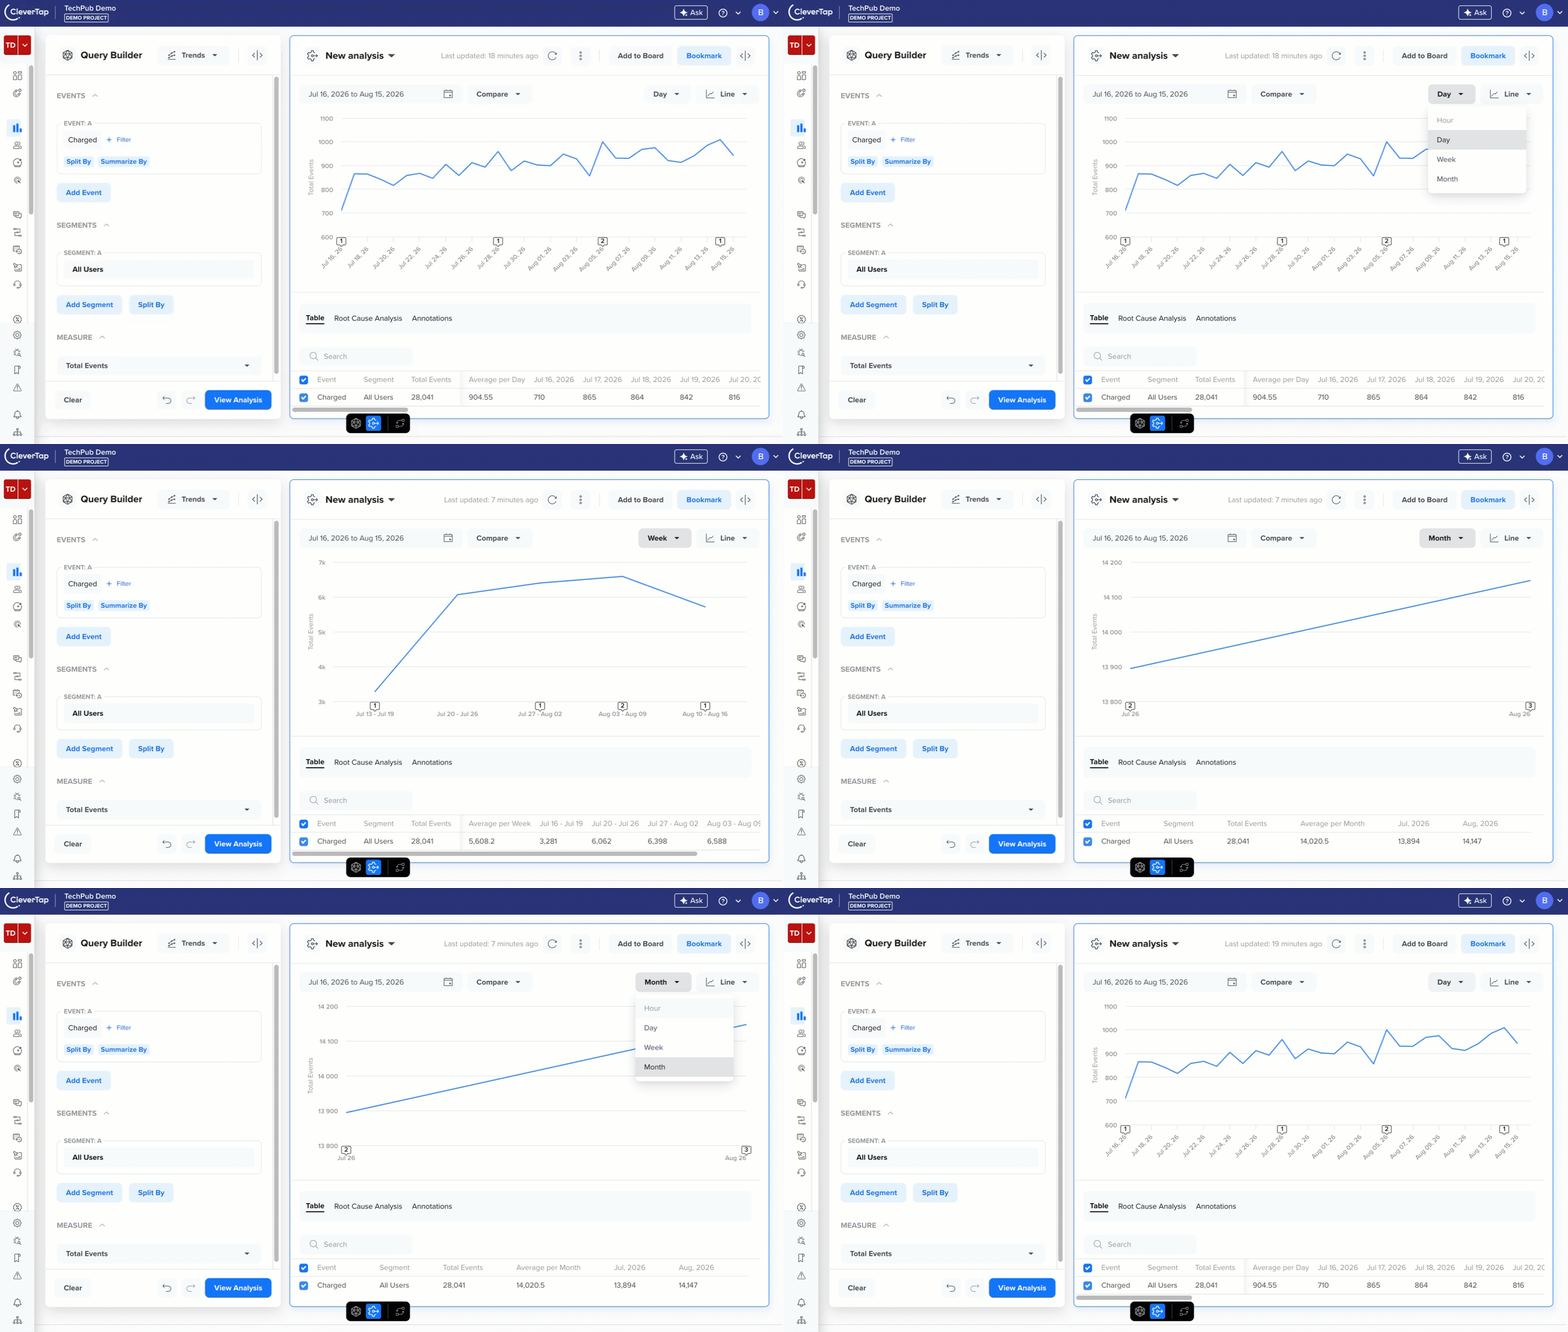
View Annotations at Different Chart Granularities
Manage Annotations
Manage Annotations is a central page under Settings where you can search, review, edit, and delete every annotation in your account, regardless of who created it or whether it was added one at a time or through a Bulk upload.
To open the Manage Annotations page, go to Settings > Annotations from the CleverTap dashboard.
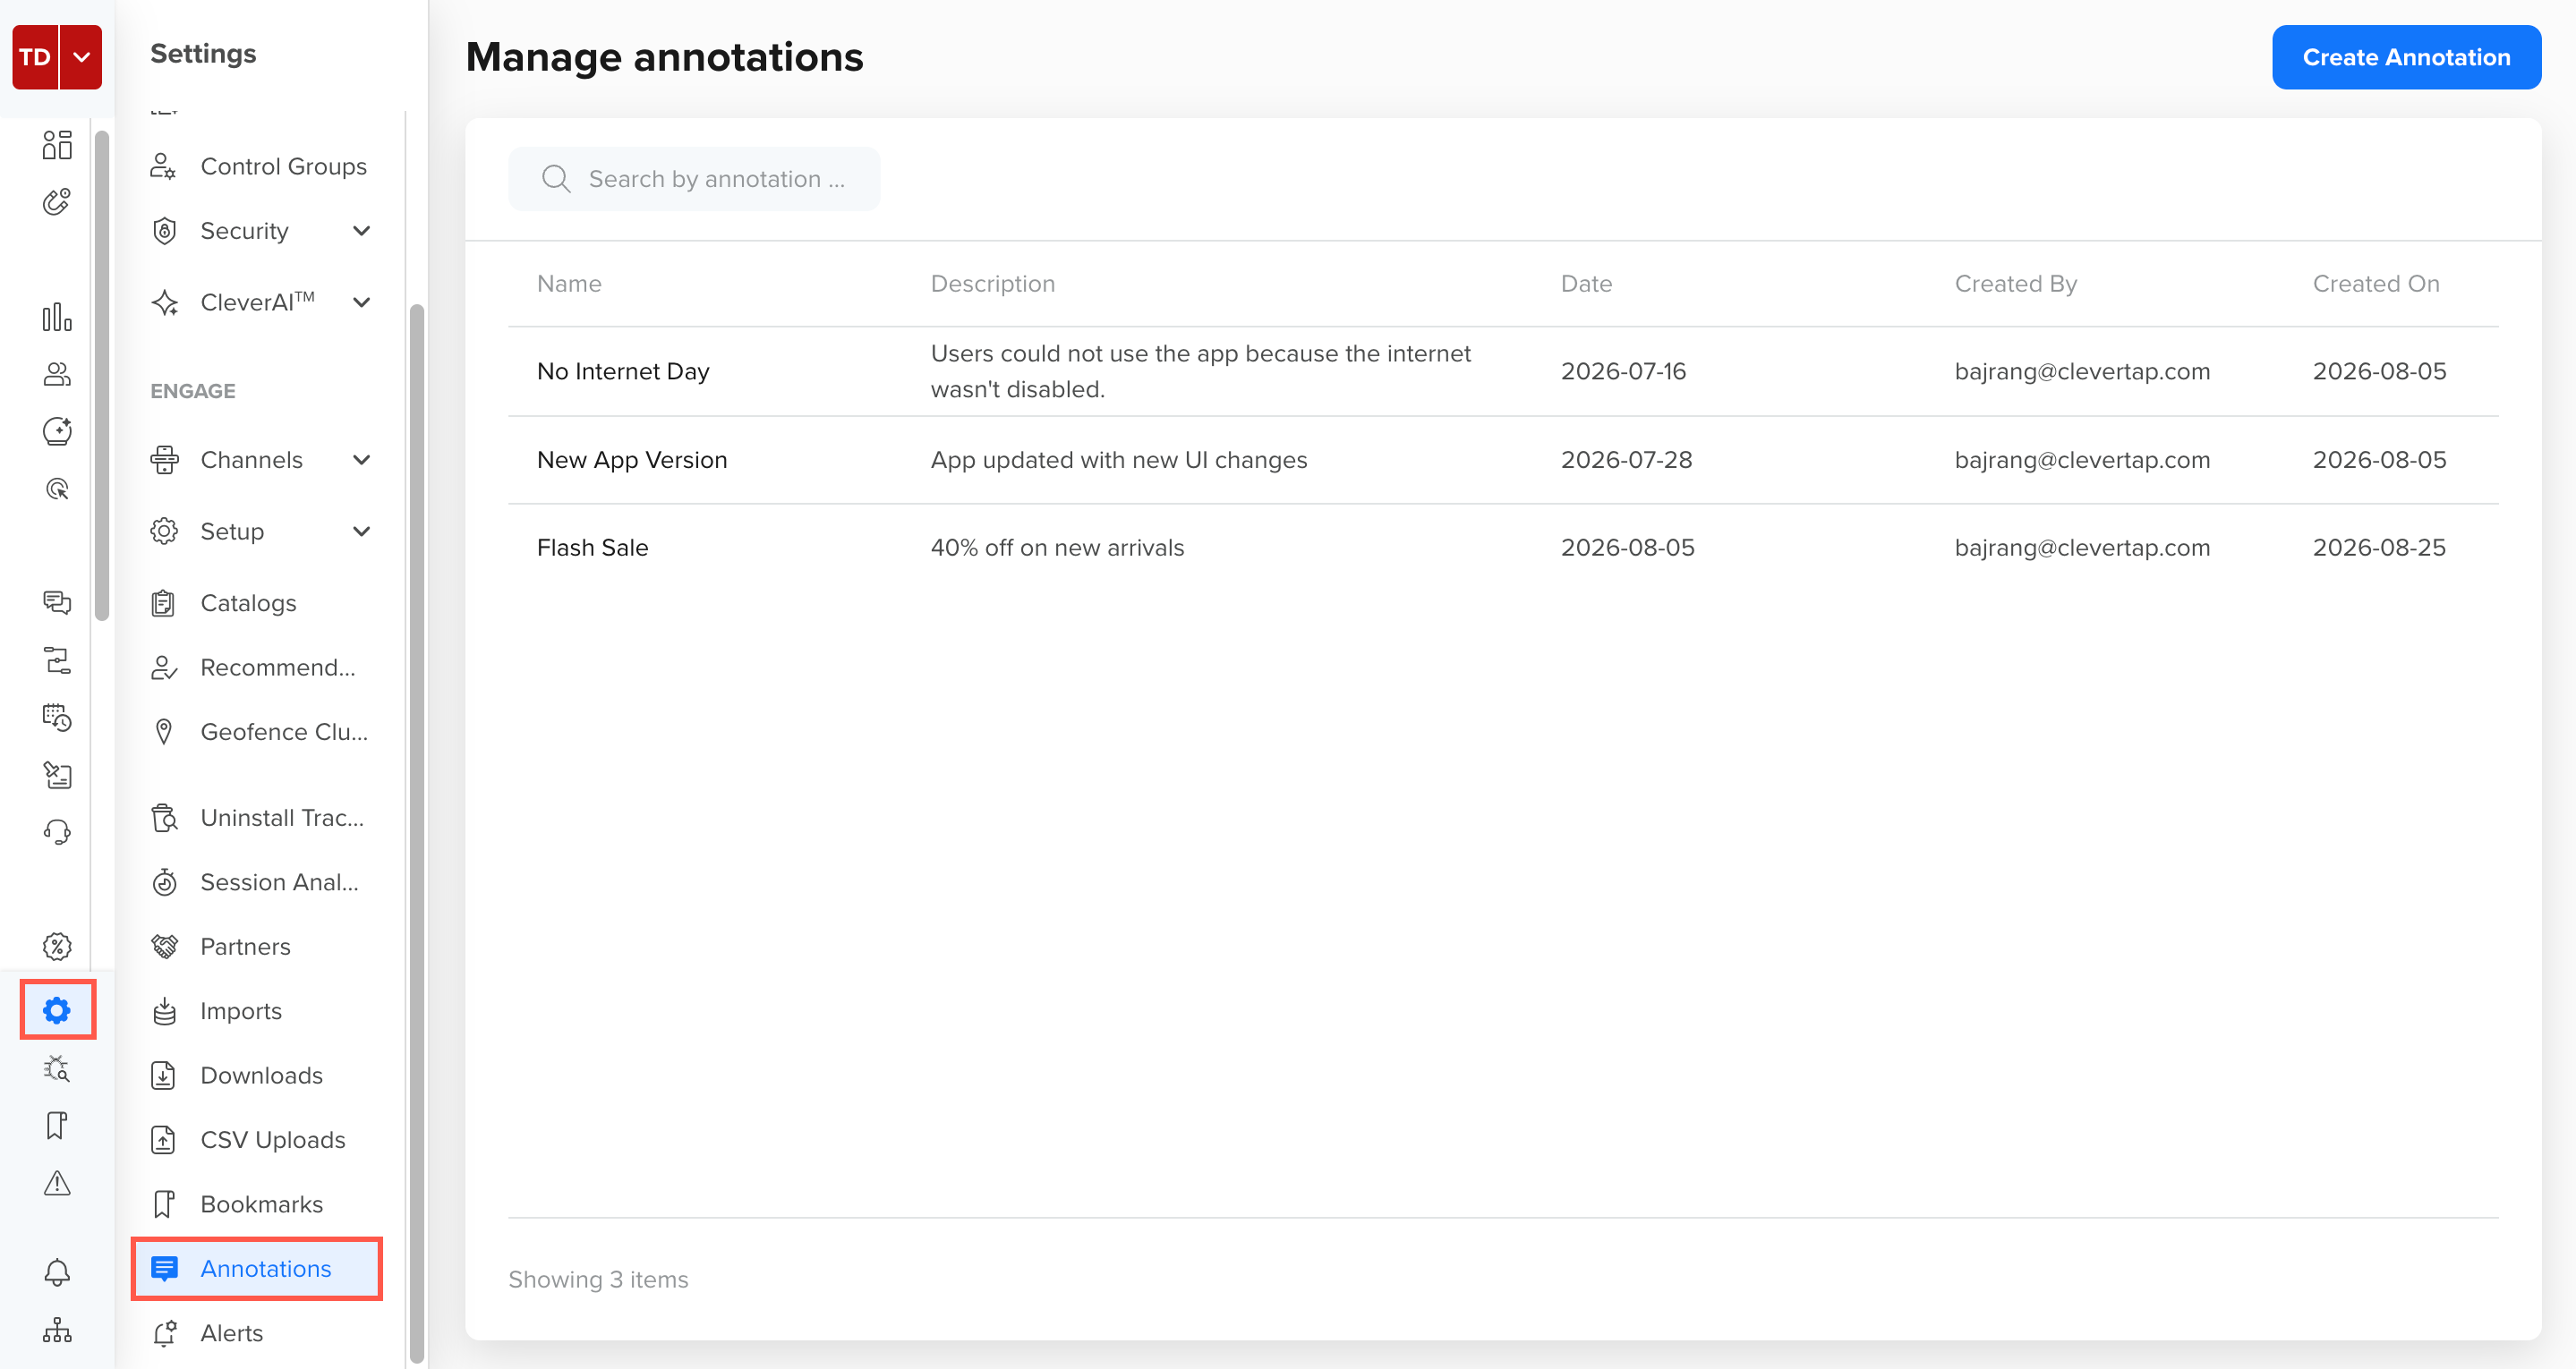
Manage Annotations
The page lists the following columns for every annotation:
| Column | Description |
|---|---|
| Name | The annotation name you enter at the time of creating an annotation. |
| Description | The full or truncated description of the annotation, depending on its length. |
| Date | The single date, or the start and end dates for a range. |
| Created By | The email address of the person who created the annotation. |
| Created On | The date the annotation was added. |
Edit
Update an annotation if event details change after you add it. For example, update it if a campaign was rescheduled, you entered a description incorrectly, or a date needs adjustment.
To edit an annotation:
- Go to Settings > Manage Annotations.
- Find the annotation using the search bar or by sorting the table.
- Click the Edit icon on its row.
- Update the Name, Description, or Dates as required.
- Click Save Changes.
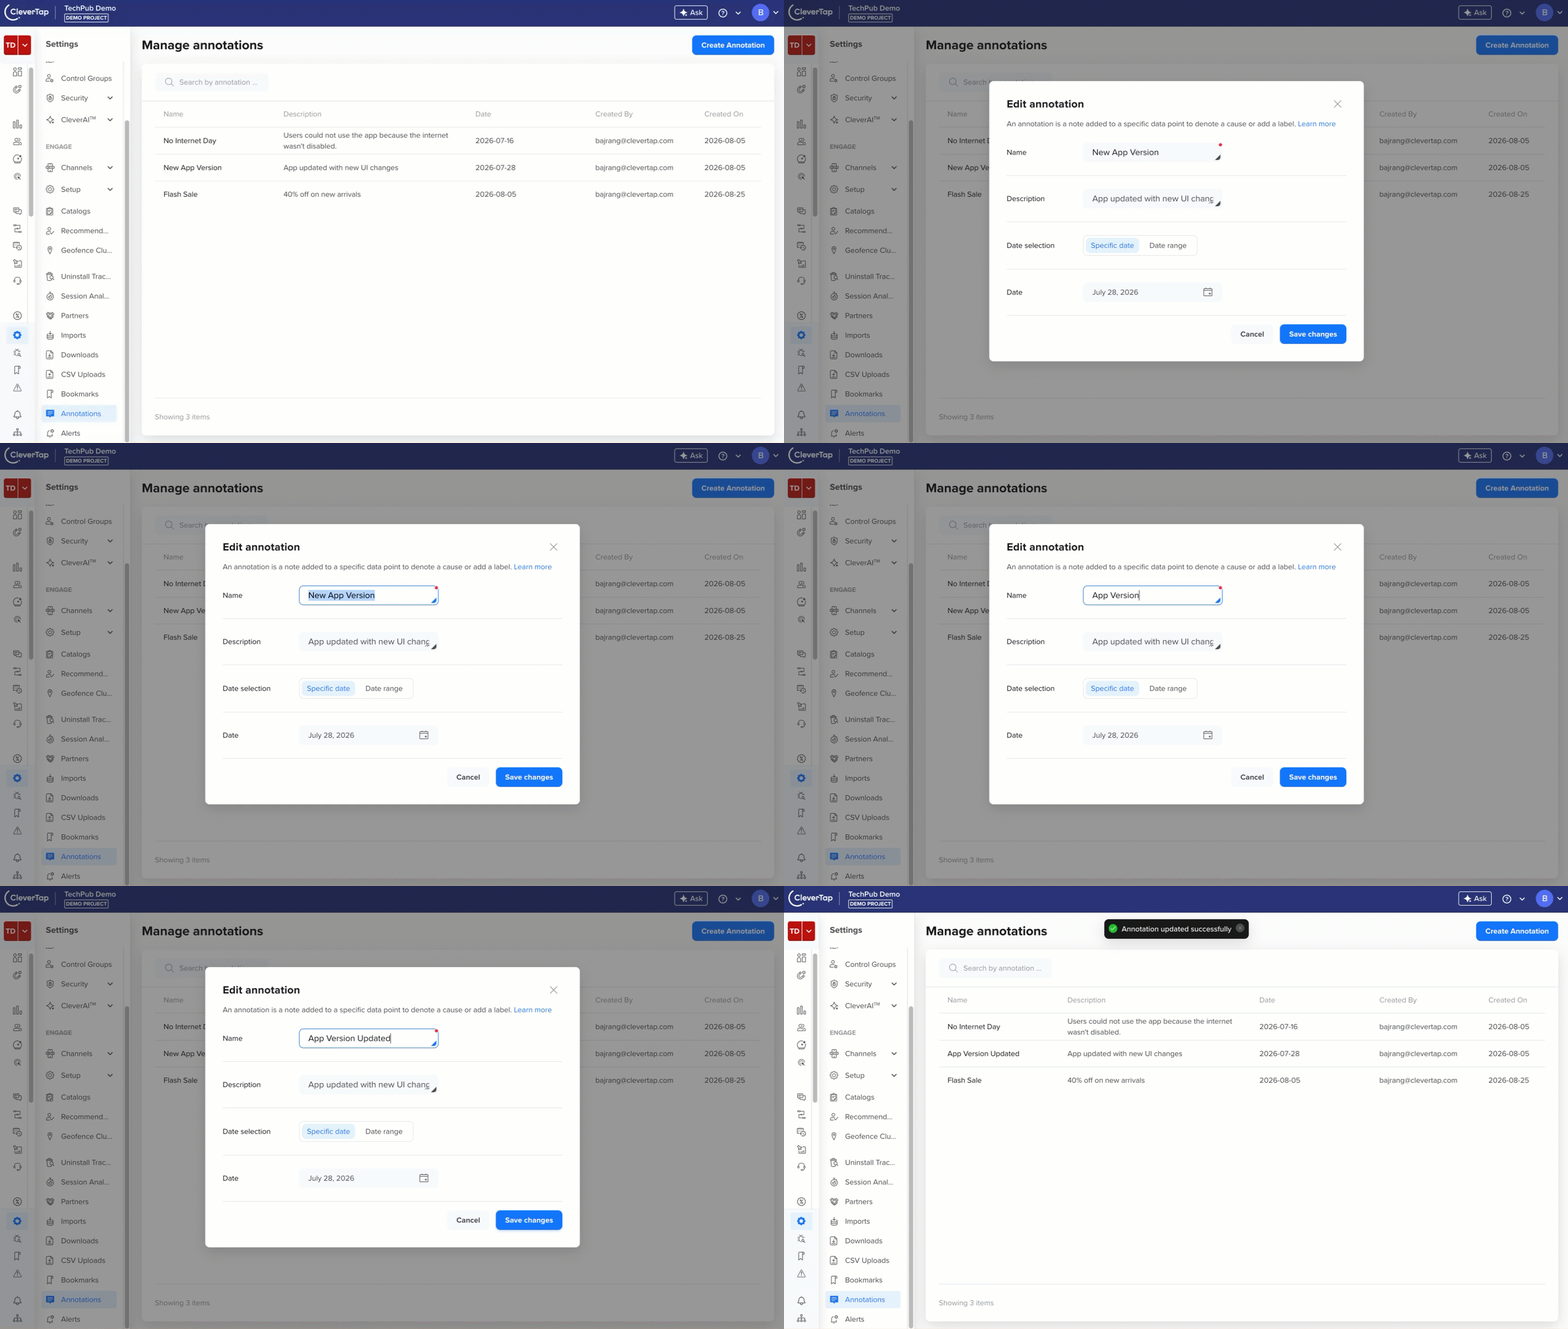
Edit an Annotation
Delete
Delete an annotation when it is no longer relevant to your analysis. For example, if it was created by mistake, duplicates an existing annotation, or refers to an event that did not occur.
To delete an annotation:
- Go to Settings > Manage Annotations.
- Find the annotation you want to remove.
- Hover over the row and click the Delete icon.
- Click Delete.
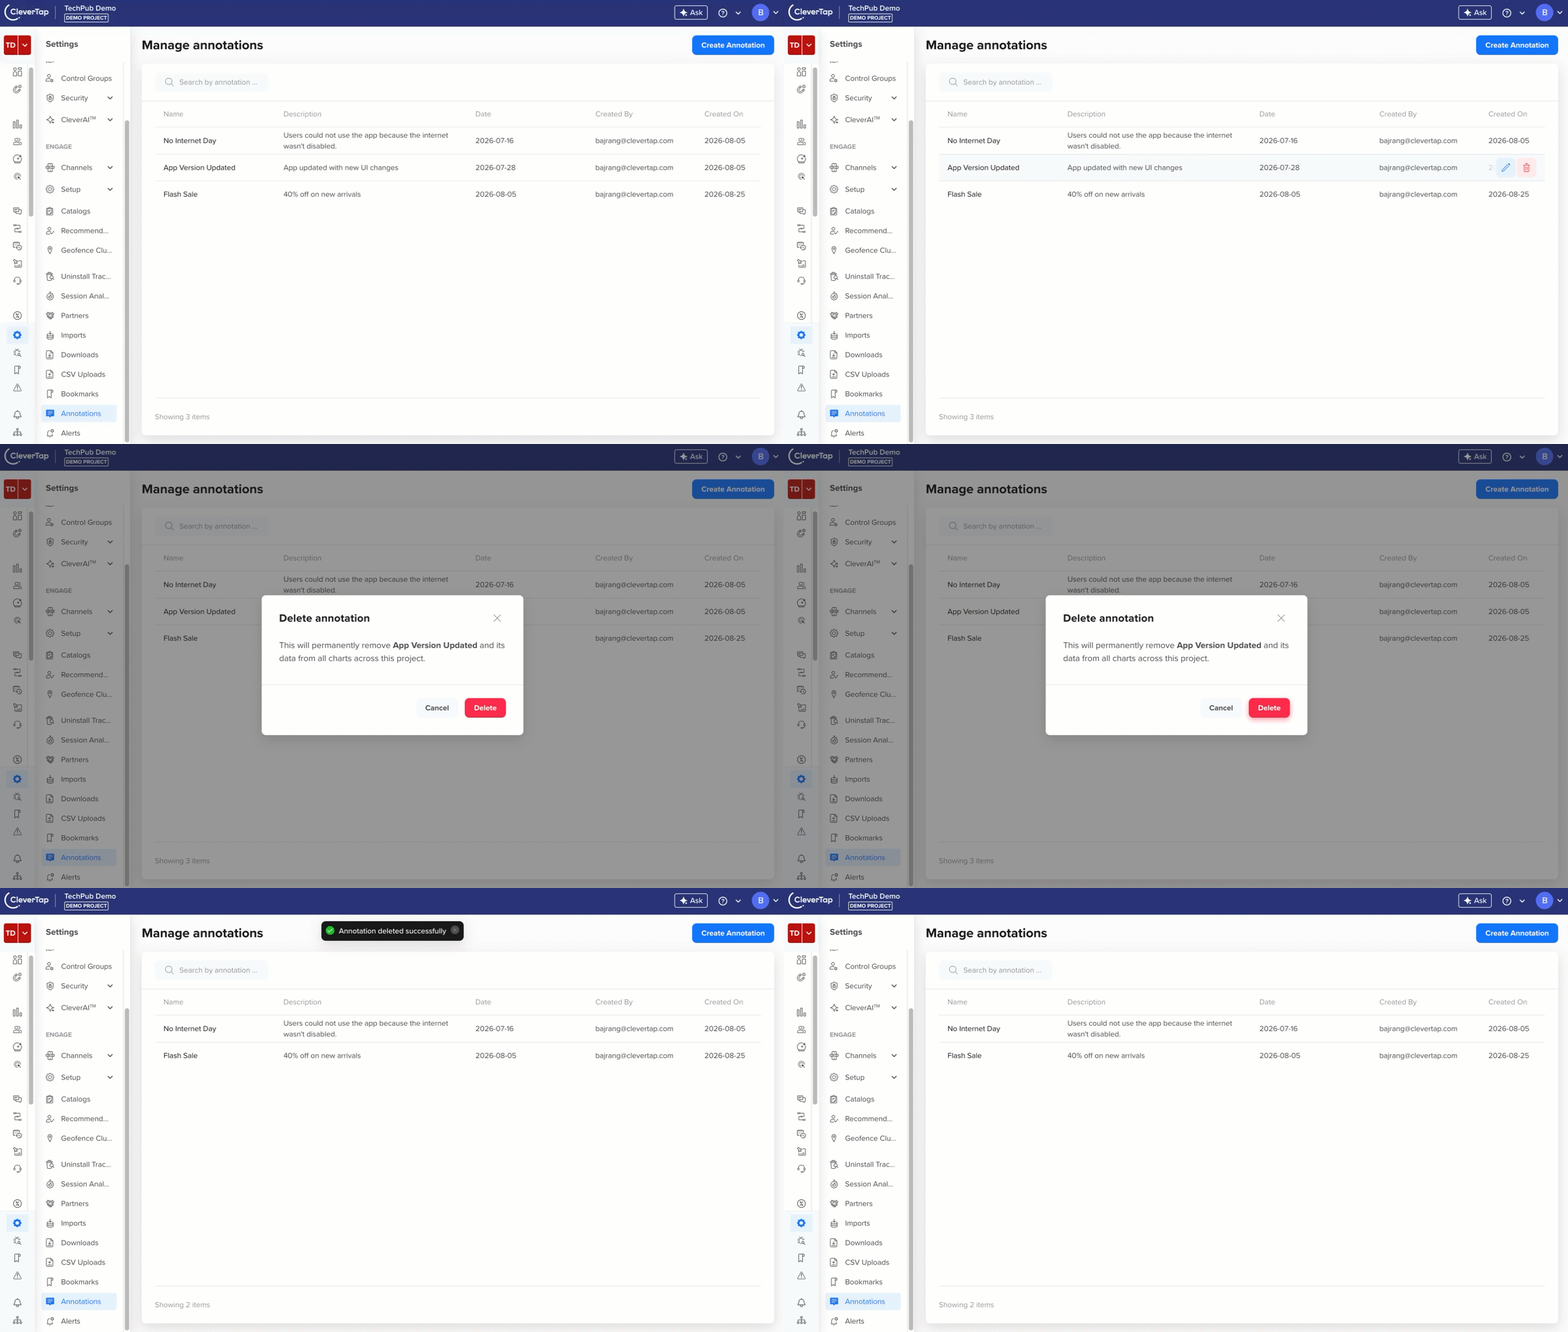
Delete an Annotation
Deleting Cannot Be UndoneDeleting an annotation permanently removes it from every chart, for every user in the account. There is currently no way to recover it. If you only need to correct a detail, edit the annotation instead.
Best Practices
Follow these best practices to keep your annotations useful, easy to scan, and trustworthy for everyone in the account:
- Keep annotation names short and specific. A name such as iOS App v4.2 Release is more useful at a glance than App Update.
- Use the Description field to capture the reason behind the event, not a repeat of the name.
- Choose Specific date unless the event genuinely spans multiple days. A specific date annotation is easier to scan on a busy chart.
- Add annotations as events happen, while the context is fresh, rather than reconstructing them later.
- Prepare a CSV file once for a recurring calendar of campaigns, releases, and holidays, and reuse the same structure every quarter.
- Edit an annotation instead of deleting it if you only need to correct a detail, because deleting removes it from every chart for every user.
Frequently Asked Questions
Find answers to the following common questions that you may have about using Annotations:
Q. Why can I not edit or delete an annotation?
Only the person who created it and Account Admins can edit or delete an annotation. If an annotation needs a correction, contact its creator or your Account Admin.
Q. Why was my CSV upload rejected?
The upload only succeeds if every row passes validation. Select Download error report to view exactly which rows failed and why, correct your file, and upload it again. Common causes are a missing name or start_date, a date not in the YYYY-MM-DD format, and an end_date that falls before the start_date or more than 365 days after it.
Q. Why is an Annotation I expect missing from the chart?
Check that the chart's date filter includes the annotation's date or date range. Annotations only render for dates within the currently selected range.
Q. Why does the chart look cluttered with too many markers?
Switch the chart to Week or Month view to group nearby annotations into a single marker, or open the Annotations tab for a clean list instead of relying on the chart markers.
Q. Who can see the annotations I create?
Anyone with access to Analytics in your account can view any annotation, along with your name and the creation date. There is currently no way to make an annotation private.
Q. What is the difference between Single and Bulk entry types?
The entry type controls how many annotations you create at once. Single creates one annotation using the form. Bulk creates many annotations from a CSV file at once. It is a separate choice from the date selection, which controls whether one annotation covers a single day or a range of days.
Q. What is the difference between a specific date and a date range annotation?
A specific date annotation applies to a single day and appears as a single marker. A date range annotation spans two or more days and renders as two markers, one on the start date and one on the end date, with nothing shown on the days in between.
Q. Is there a limit to how many annotations I can add?
There is no limit for a single date. Your account as a whole can hold up to 10,000 annotations in total, including date range annotations, before you will need to clean up older ones from the Manage Annotations page.
Q. Can I add annotations to Funnels, Cohorts, or other analysis charts?
No. Annotations are currently available on Trends charts only.
Q. Does a Bulk upload check for duplicate annotations?
No. If your CSV file contains the same name and date more than once, all of those rows are added. Review your file before uploading, or clean up duplicates afterward from the Manage Annotations page.
Q. If I delete an annotation, can I get it back?
No. Deleting an annotation is permanent and removes it from every chart for every user. If you are not certain, edit the annotation instead.
Updated about 3 hours ago