Exporting Data for Risk-Ratio Analysis
Learn how to export data from CleverTap to perform a Risk-Ratio Analysis.
Introduction
The Risk-Ratio template was pioneered by data expert Crystal Widjaja at Reforge to help discover valuable insights that can improve your app engagement and increase conversions. It can help you understand the relationship between your user actions. For example, an e-commerce app may want to know the relationship between user behavior actions such as Added to Cart, and a goal such as Charged.
This document guides you through using behavioral data from CleverTap and visualizing the results using the risk-ratio template.
Register for CleverTap AccountIf you are not already a CleverTap subscriber, you can explore CleverTap Pricing Plans or schedule a demo to learn more.
You can also refer to the video tutorial for exporting user profile data for risk ratio analysis using CleverTap.
Create Behavioral Attributes
You can set up CleverTap Journeys to model the data exactly as expected in the Risk-ratio template. A Past Behavior journey with a User Profile Update controller node helps generate each of the attributes as listed in the following table:
| Journey | CleverTap User Event | Risk-ratio Attribute | Description |
|---|---|---|---|
| Journey 1 | Added to cart | Y Behavior | This attribute counts the number of Added to cart actions for a user. |
| Journey 2 | Charged | Z Goal | A successful conversion is represented as 1, while a failed conversion is represented as 0. |
NoteYou can update any existing user property or create one using CSV Upload.
Create Journey for Y Behavior
You can analyze the Added to cart event in CleverTap as Y behavior action in the Risk-ratio template. Create a journey to capture all the segments for the Added to cart event, where the count is zero, one, two, three, four, five, six, seven, and eight or more. The user property y_behavior_count will track the count for each Added to Cart event instance. An Update user profile controller node is used to increment the value from zero to eight for each Added to cart event.
To create a journey for Y Behavior:
-
Navigate to Journeys from the CleverTap dashboard.
-
Set up the Journey using a Past Behavior user segment.
-
Add a Past Behavior node as the Entry Segment to qualify all users who have performed the Added to cart event.
-
Add a Past Behavior segment where users have added to the cart and the count is 0.
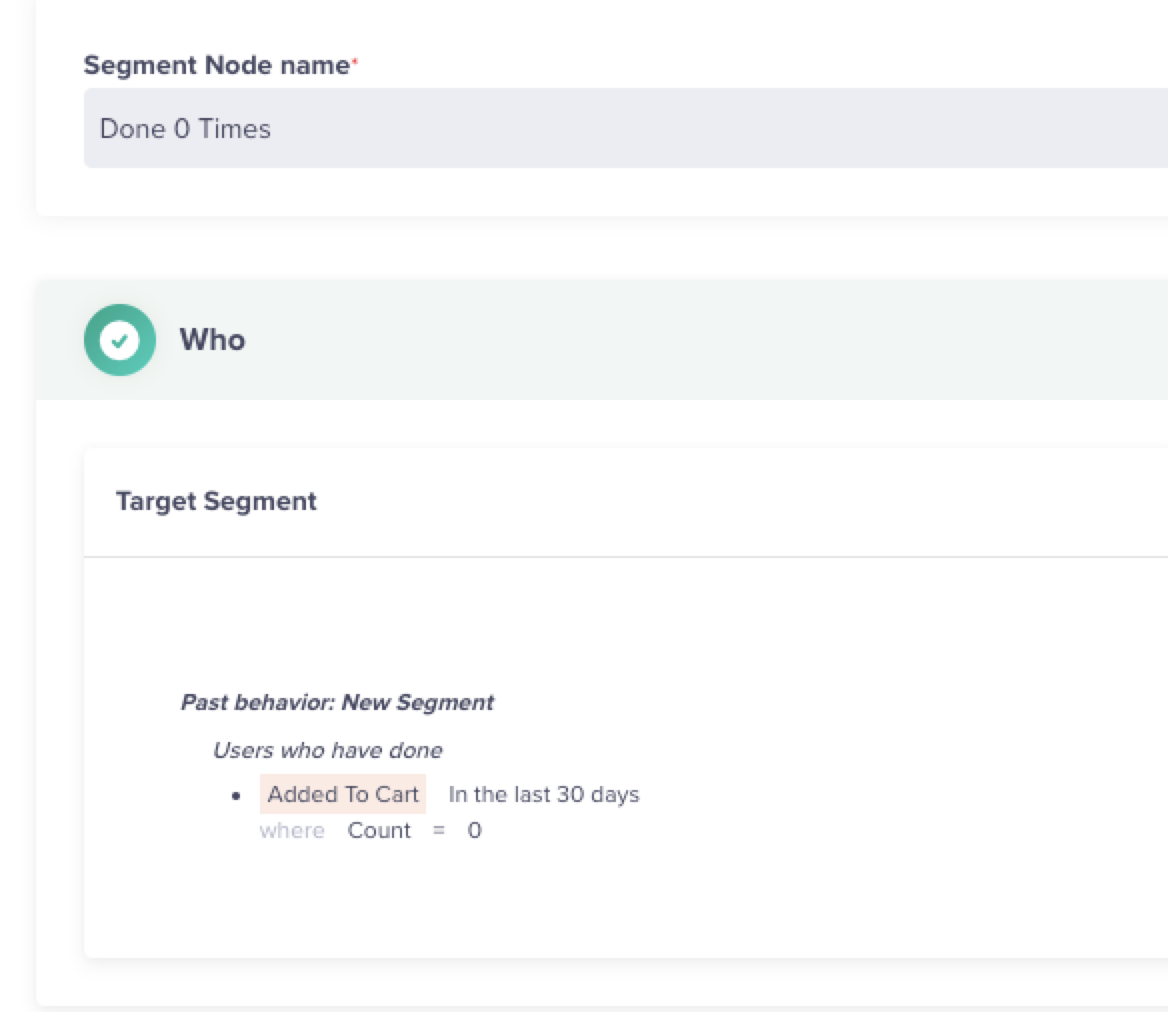
Add a Past Behavior Segment - Y attribute
-
Connect an Update user profile node. Set the y_behavior_count to 0.
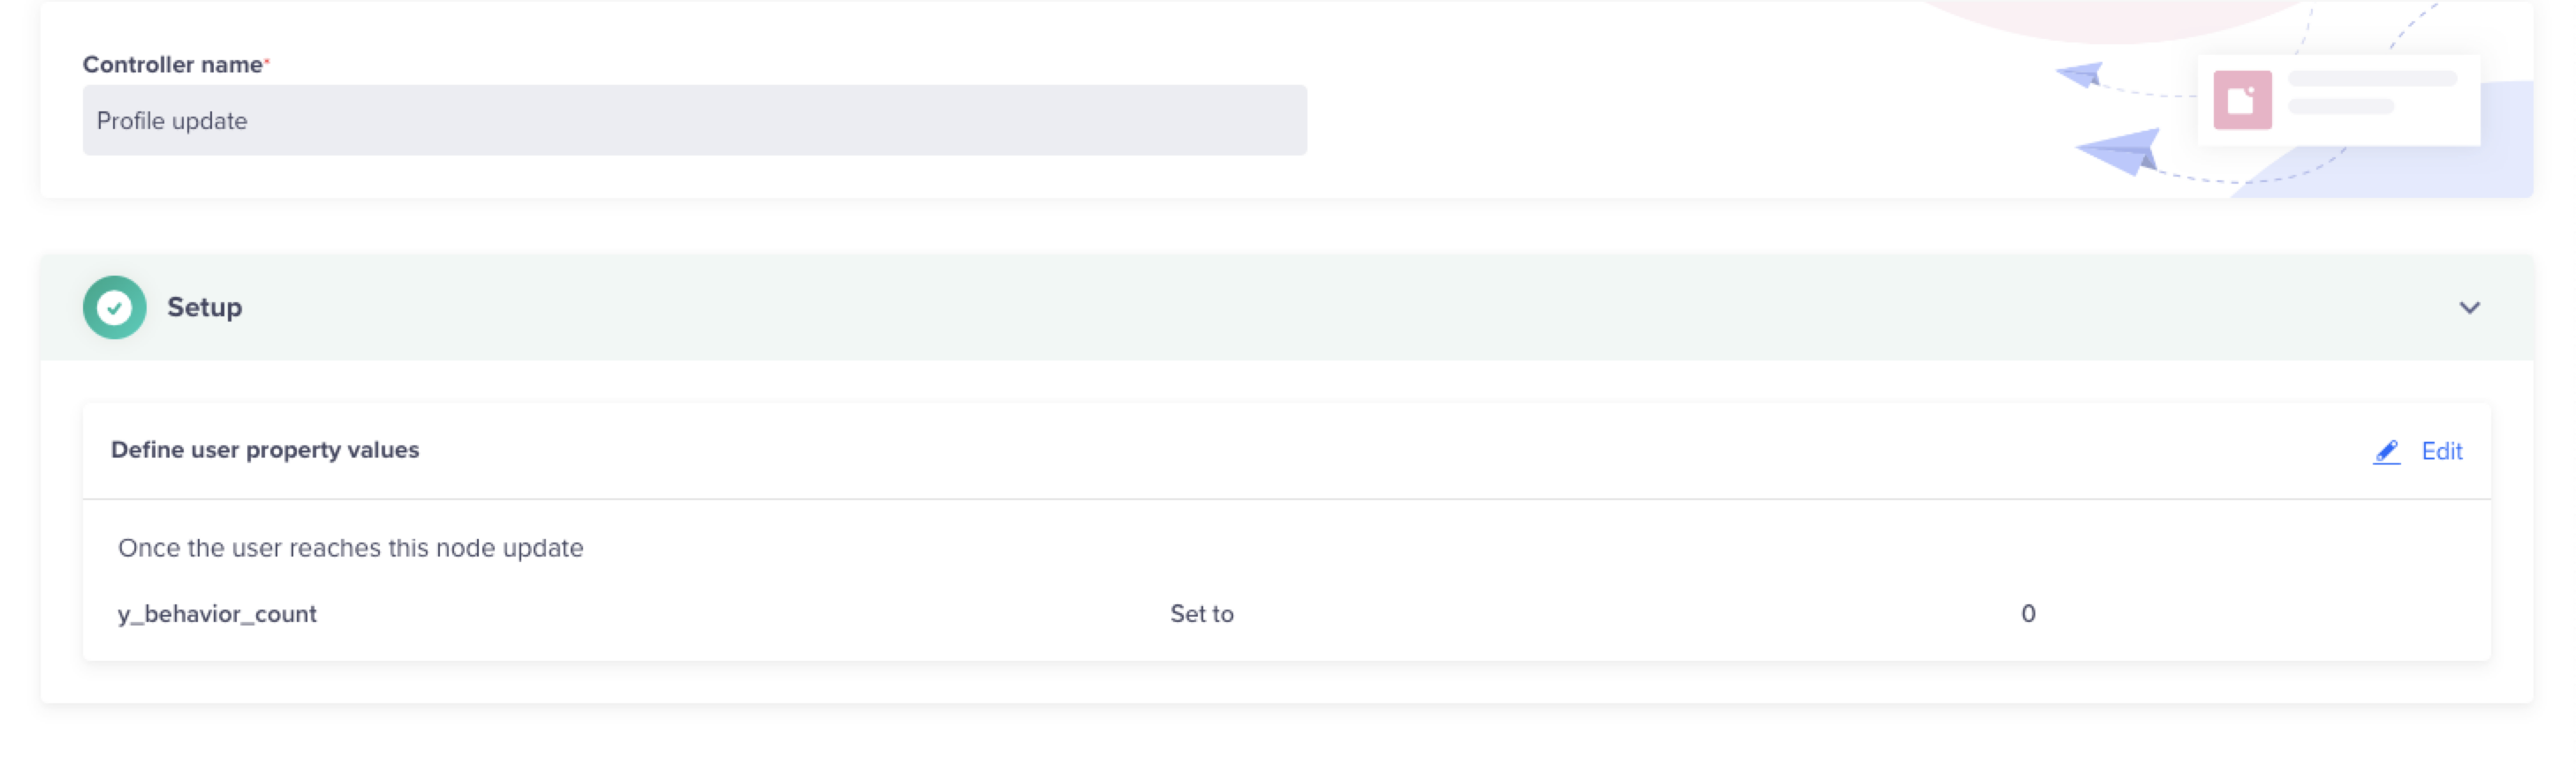
Set count in Profile Update node - Y Behavior
-
-
Add more segment nodes to the journey, incrementing the count for the Added to cart event by 1 each time.
- Connect an Update user profile node to each segment node. Increment the y_behavior_count by 1 subsequently. The following image shows a sample Y Behavior journey:
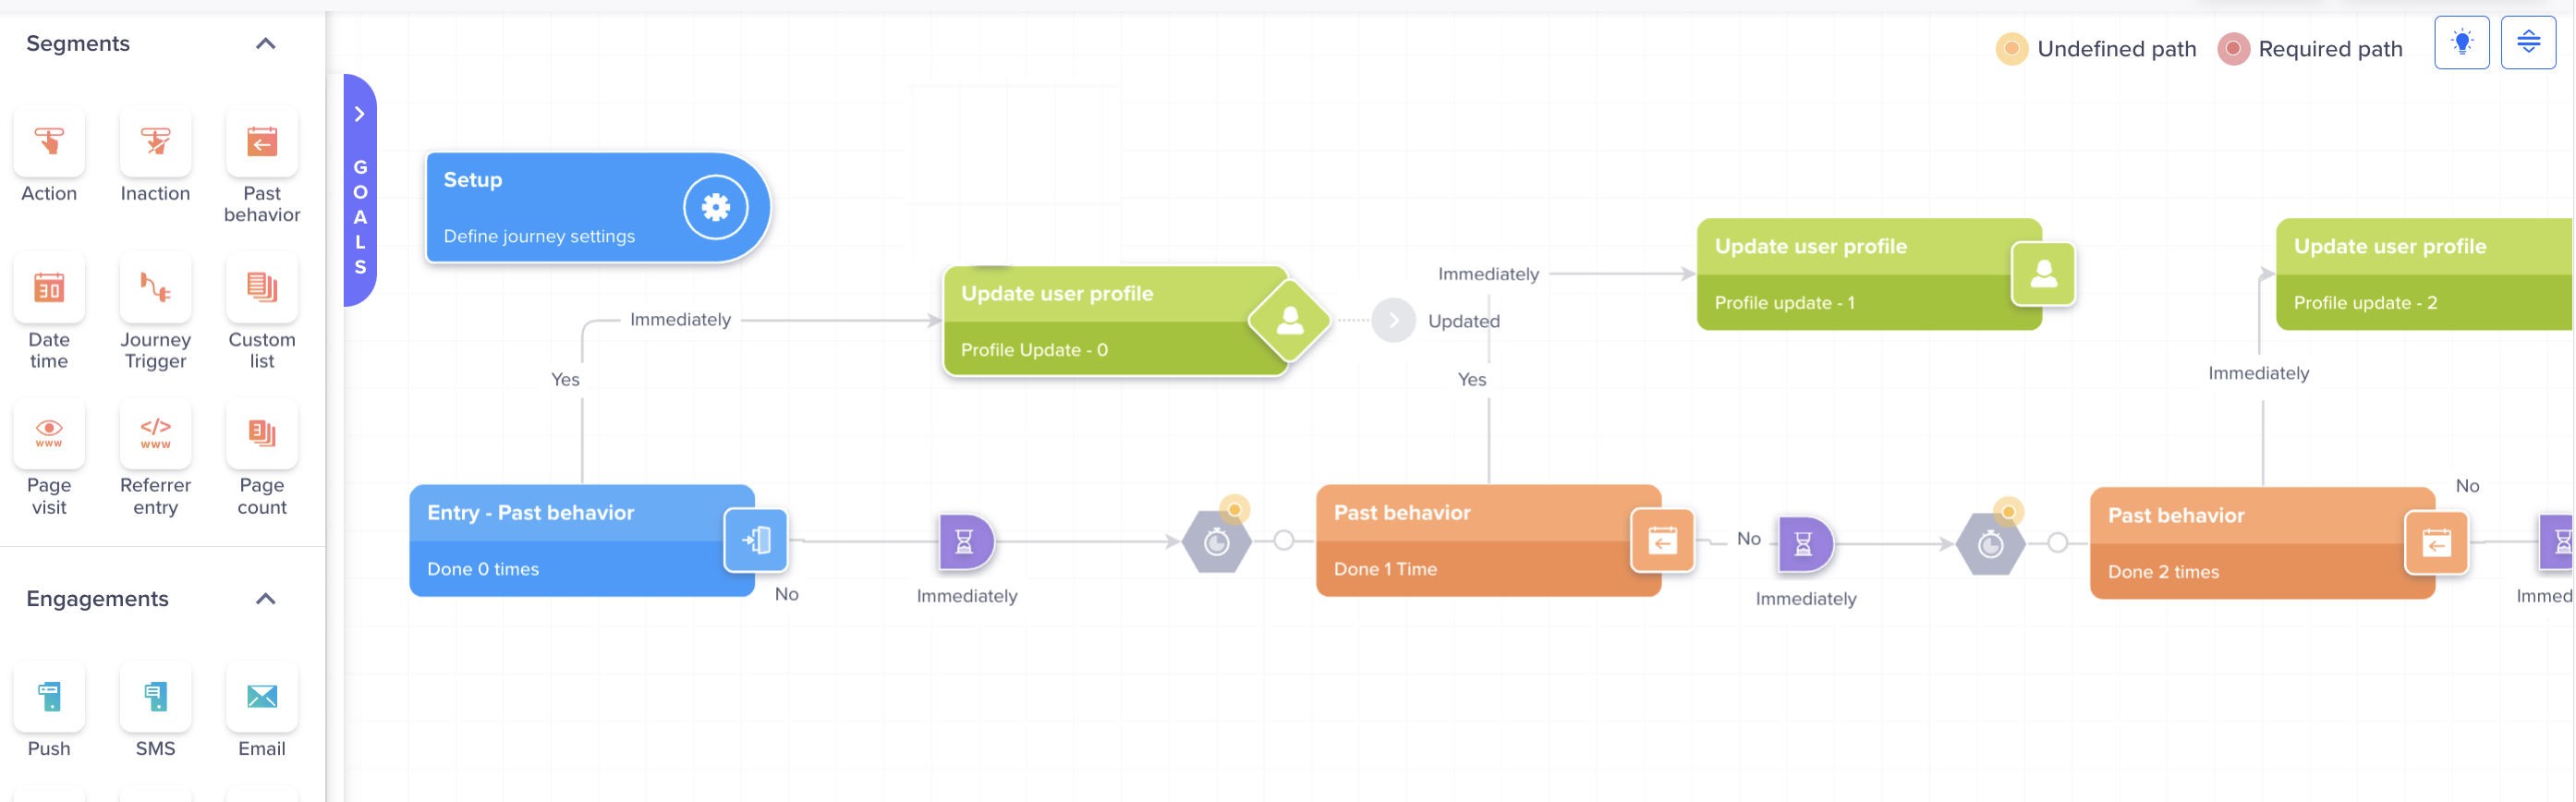
Sample Y Behavior Journey
Connect Segment and Profile Update NodesConnect all Segment nodes via the No path and all the Profile update nodes via the Yes path.
Create Journey for Z Goal
You can now create a similar journey for a Z goal in CleverTap. A Charged event indicates that the user has purchased the item. The value for the Z goal is boolean. If the user purchases the item, Charged is marked as 1; if the user does not purchase, Charged is marked as 0.
The entry criteria for this Journey will be a Past Behavior segment. It includes users who have purchased an item at least once.
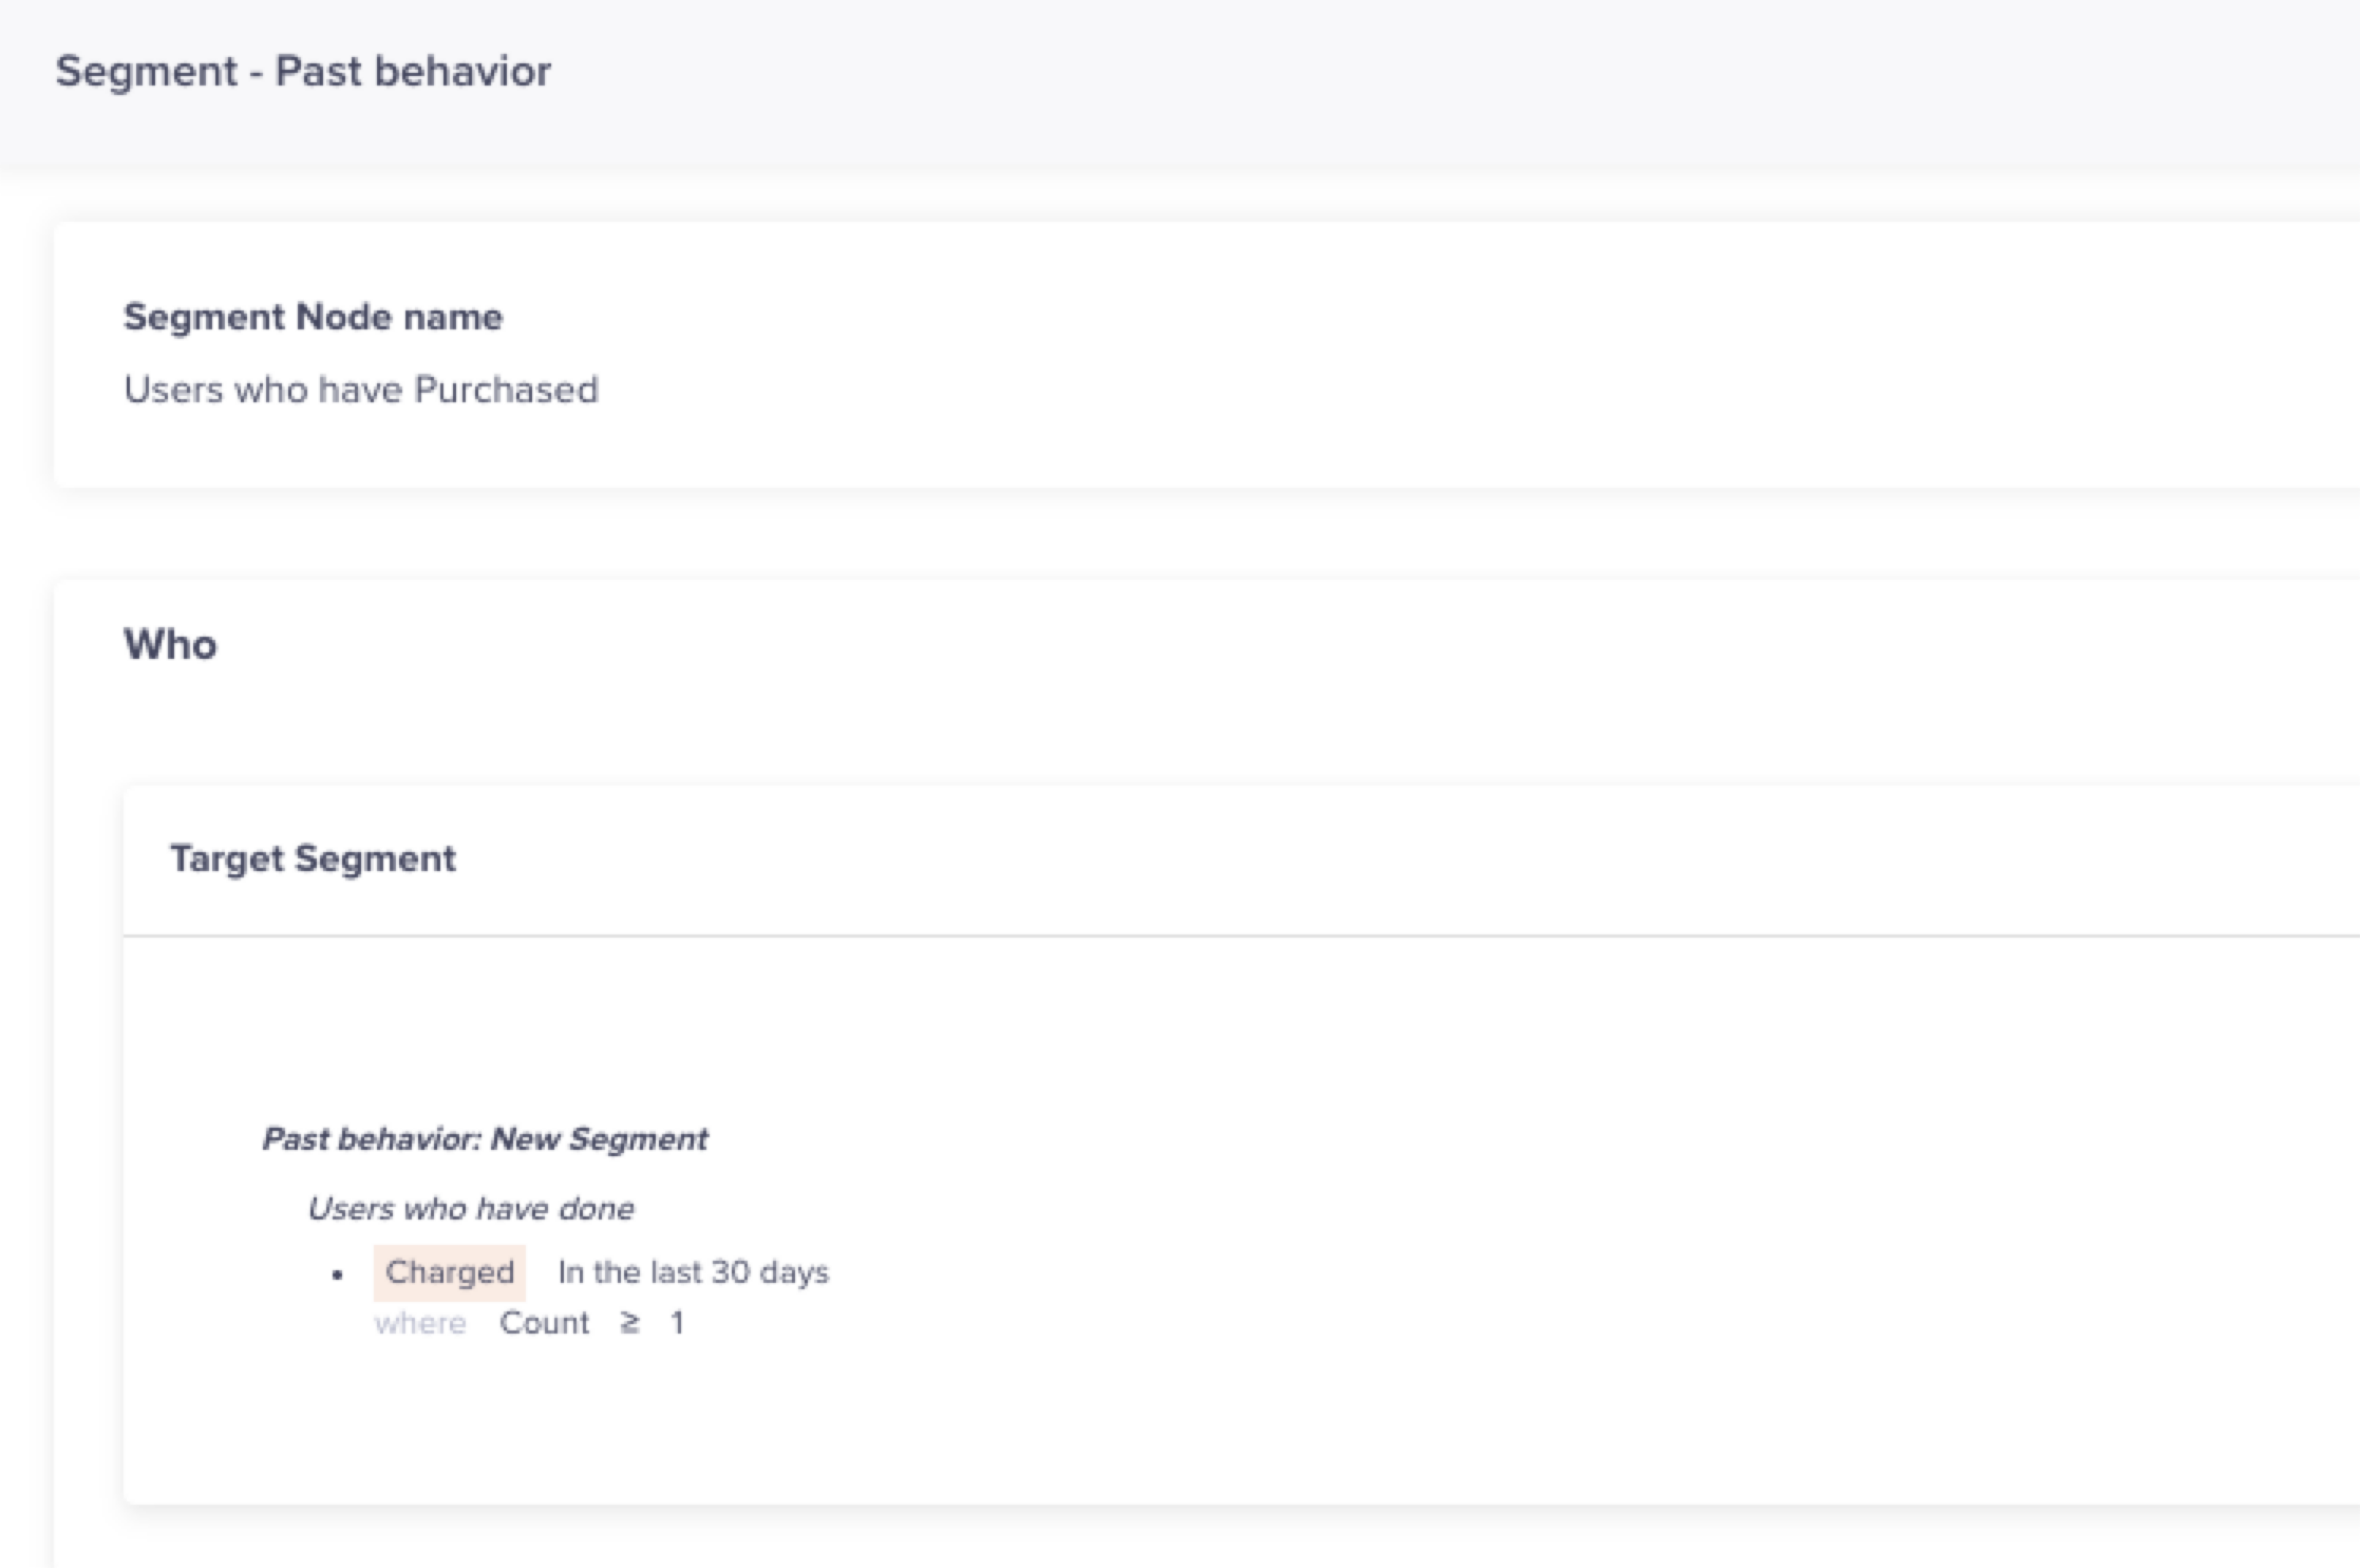
Add a Past Behavior Segment - Z attribute
This journey will have two updated user profile nodes: Z Goal=1 and Z Goal = 2. The Z Goal = 1 node records the count for all the instances where the user performed the Charged event.
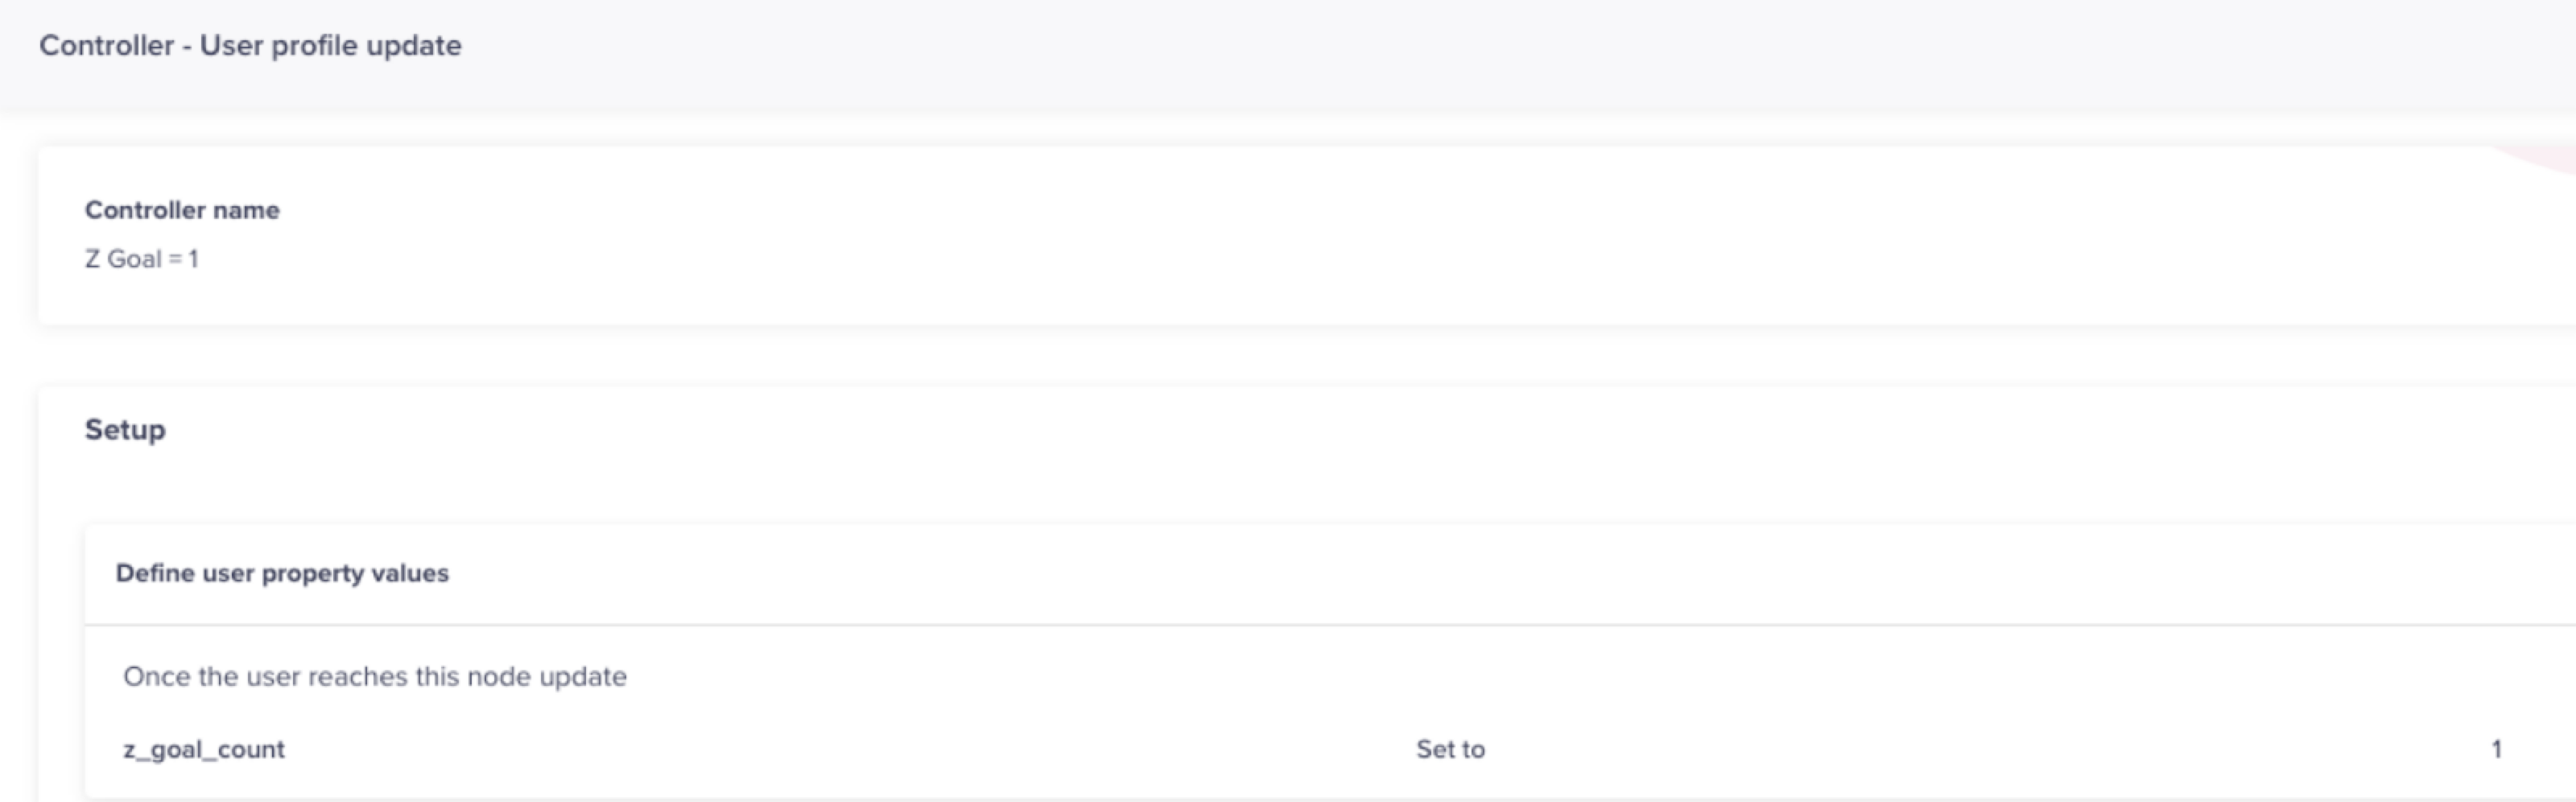
Set count in Profile Update node - Z Goal
The Z Goal = 2 node records the count for all instances where the user did not perform the Charged event. The following image shows a sample Z Goal journey:
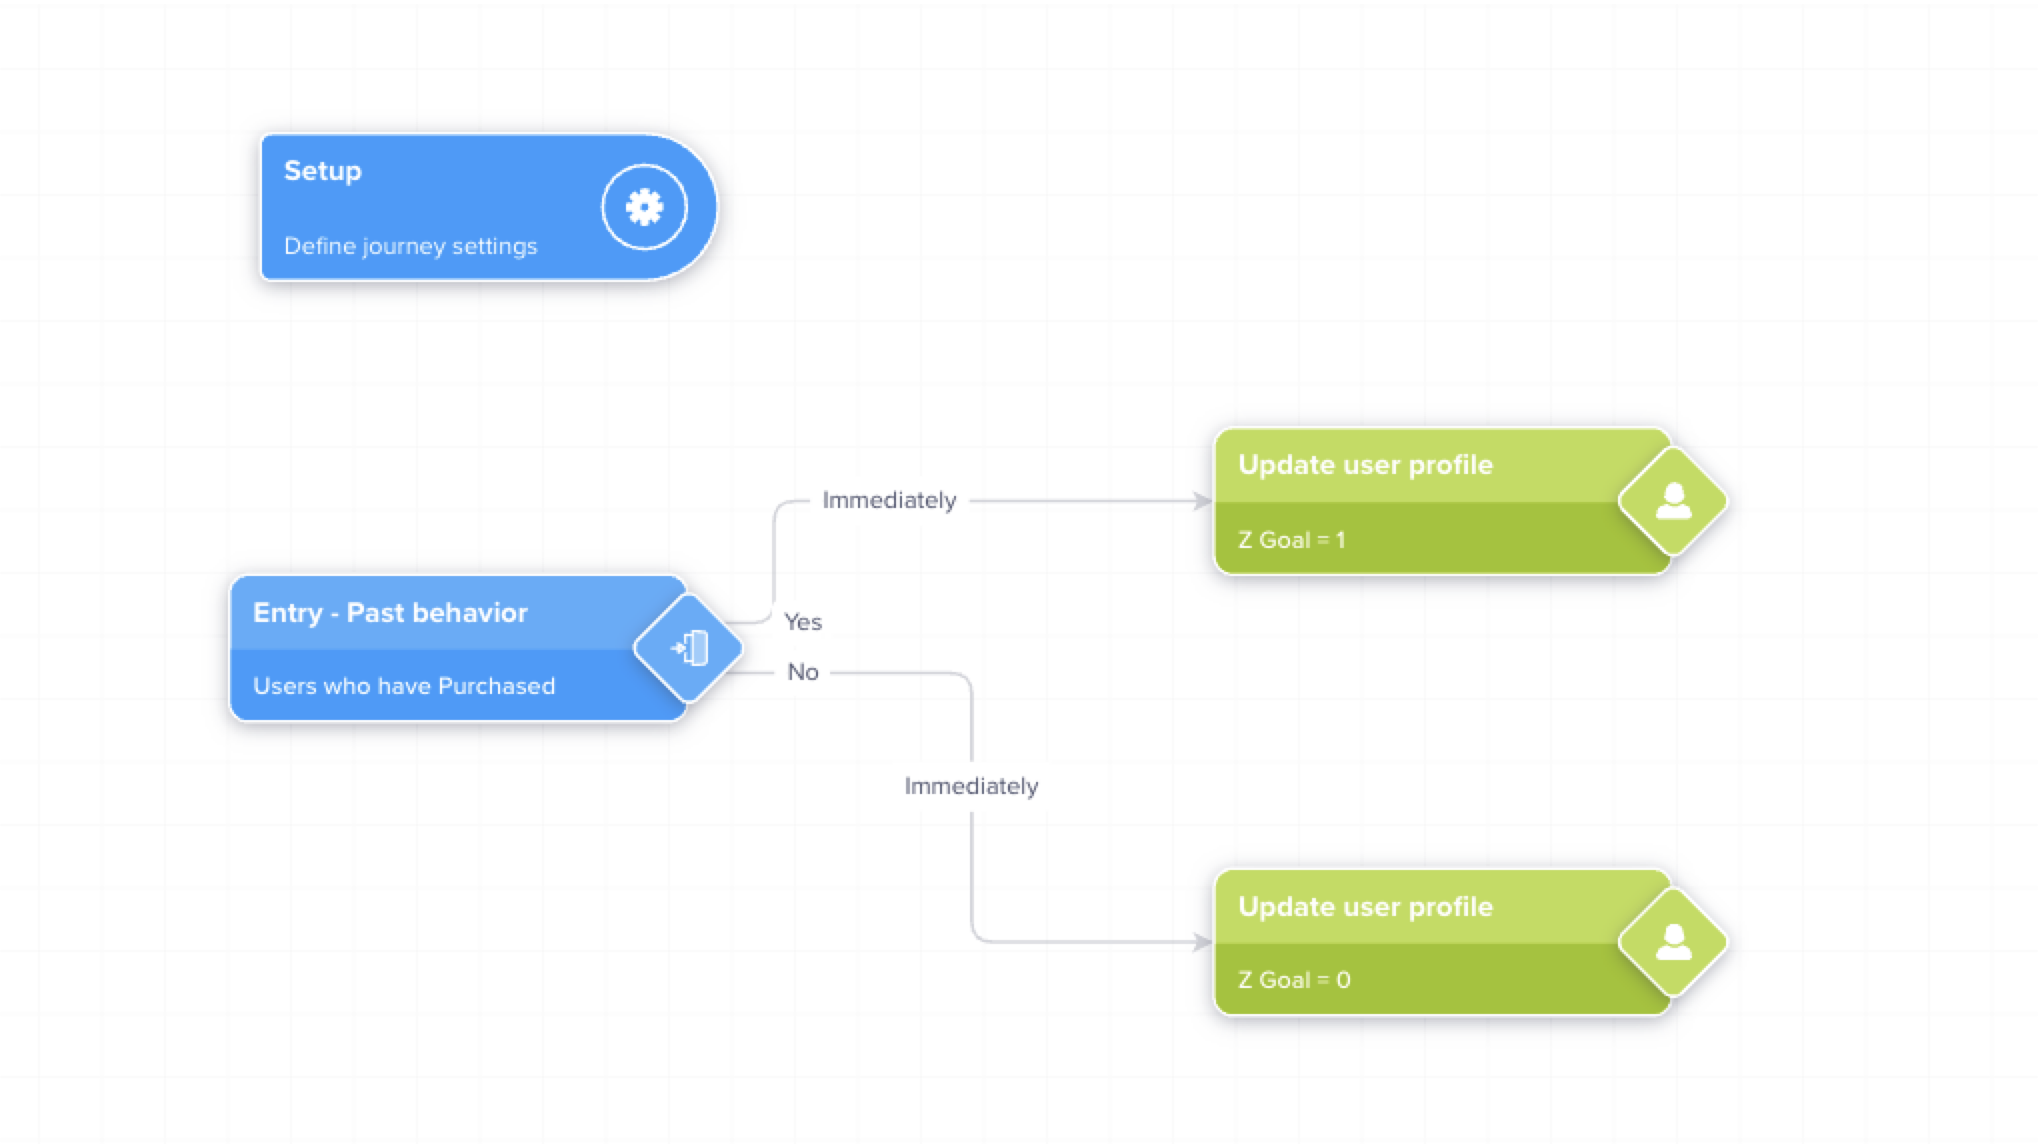
Sample Z Goal Journey
Export Data
Export the Y behavior and Z goal count from the CleverTap dashboard. After the download, you can copy and paste the information from the downloaded CSV file to the Risk-ratio template.
- Go to Segments > Find People.
- Under Display common properties such as section, search for z_goal_count and y_behavior_count properties.
- In the Reachability section, click the
 icon. A window with the user attributes appears.
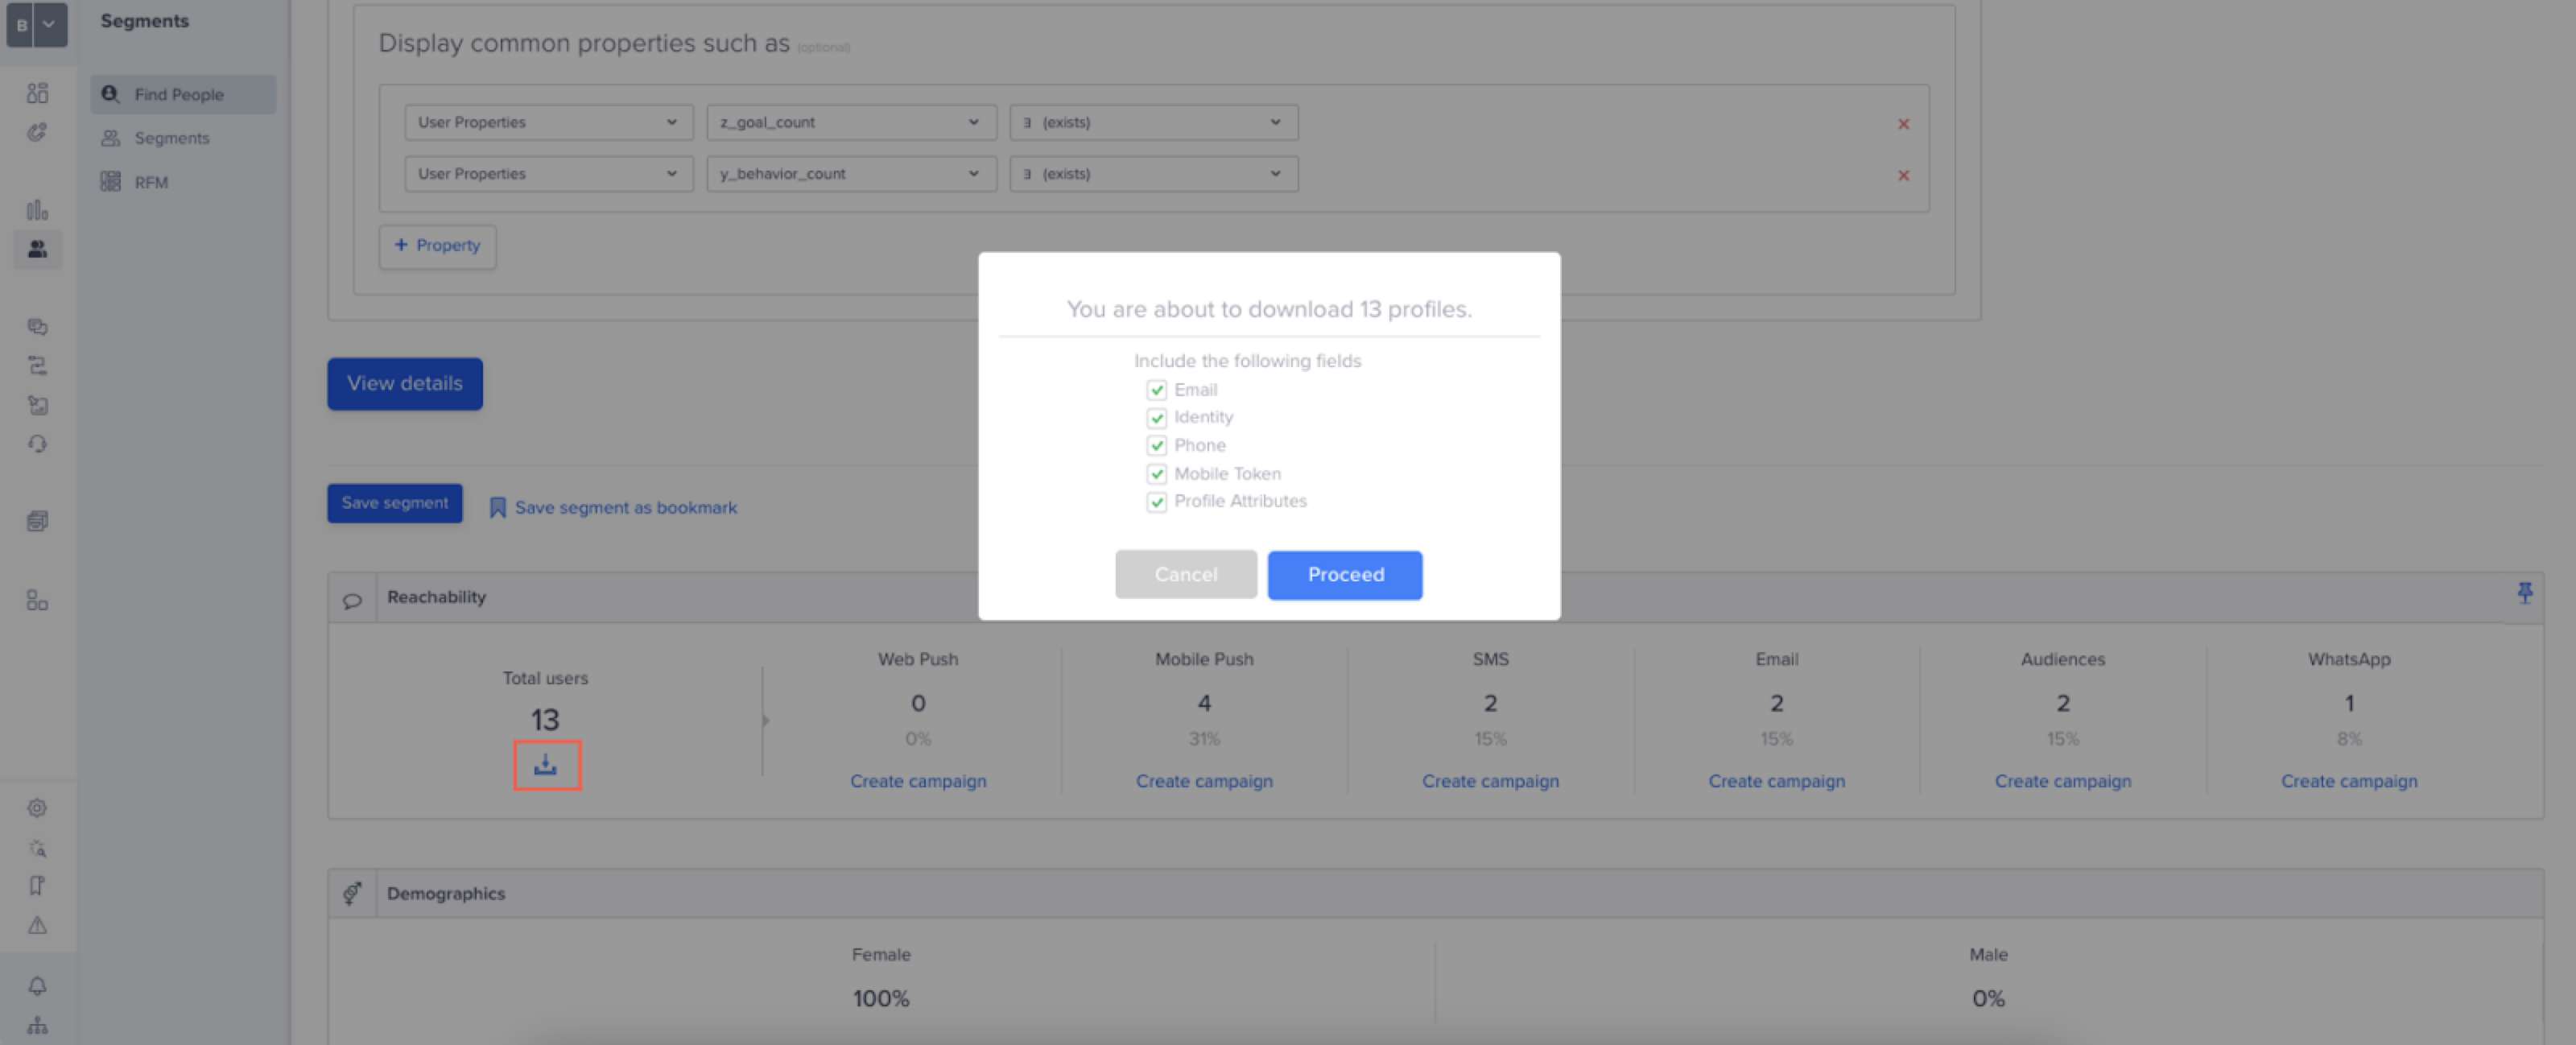
Export Attribute Data
- Select all the attributes.
- Click Proceed. After the download is completed, you will receive an email with a download link for the selected properties. You can also go to Settings > Downloads and access this downloaded file on the CleverTap dashboard.
Analyze Risk Ratio
Once you have the CSV file, you can copy-paste the required data into the risk ratio template. To analyze the risk ratio, copy the CleverTap Id, Y Behavior, and Z Goal columns to the respective Risk Ratio Template columns.
The template will automatically populate with calculations for performing risk ratio analysis.
For further assistance, contact CleverTap Support.
Updated 8 months ago