Funnels 2.0
Learn how to use the new and improved visualization using Funnels to gain deeper insights into your data and make more informed decisions.
Overview
Funnels are a series of actions that a user performs in a particular order. They show users' progress through defined paths in your app and identify where they drop off between steps.
A typical example is a user onboarding sequence, where a user progresses from the app's initial launch through activities such as registration, profile completion, and orientation. Another example is a purchase sequence, where a user progresses through a shopping cart experience to complete a purchase.
Public BetaThis feature is released in Public Beta. For more information about this feature or any queries, contact your Customer Success Manager or the CleverTap Support.
Creating a Funnel
To analyze how users progress through a defined sequence of events, you can create a funnel using the Funnels feature in CleverTap.
To create a funnel, go to Analytics > Funnels Beta and perform the following steps:
Select Events
Select the events in the desired order to create a funnel with up to eight steps. You can also select event properties for each event to limit the analysis to users who performed the selected event with those properties.
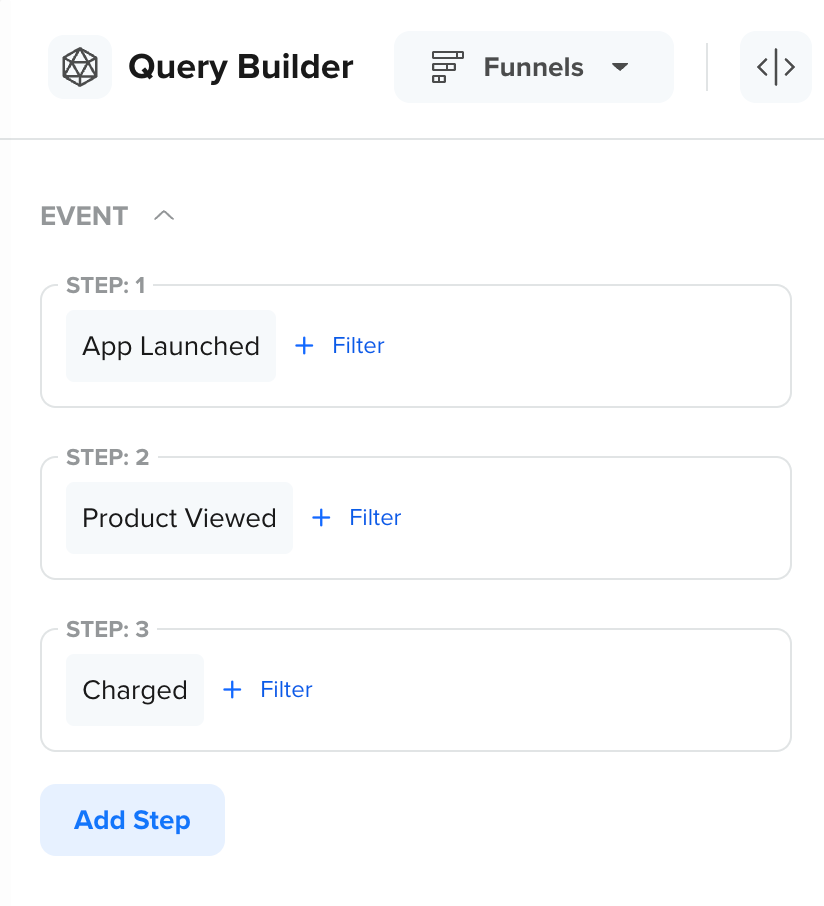
Select Events for Funnel Analysis
You can add multiple events (up to four) within a single funnel step using an OR condition. This is useful when the same user action can be represented by different events but should be treated as a single step in the funnel.
For example, if users can log in through either a mobile app or a website, you can group the Mobile Login and Web Login events into a single funnel step using OR condition. This ensures that users are counted as having completed the step regardless of the platform they used, providing a more accurate view of user progression.
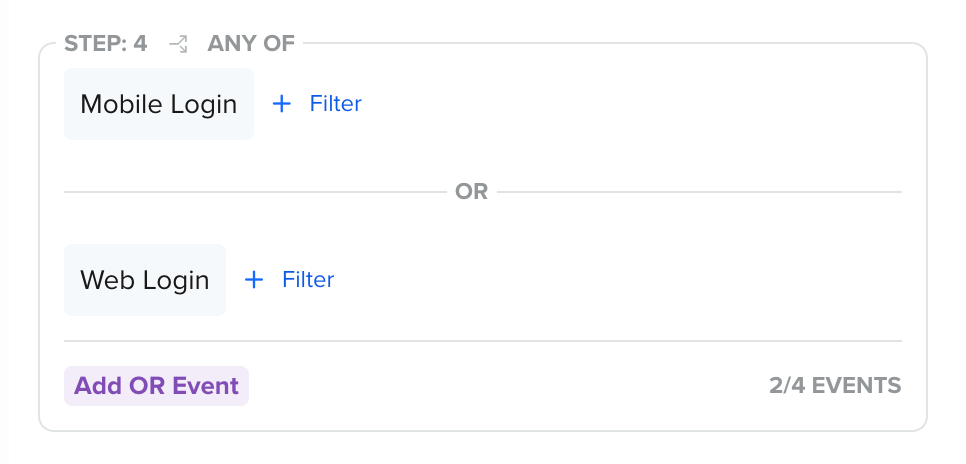
Add Multiple Events with an OR Condition
Select Segments
You can compare funnel conversions across different user segments to analyze how behavior varies between user groups. For example, compare the funnel for App Launched > Product Viewed > Charged across the All Users and the Engaged Users segments. Differences in conversion trends could reveal variations in your users' behavior across segments and yield invaluable insights.
Click Add Segment to include additional user segments in the same funnel analysis. This allows you to compare funnel analysis across multiple segments within a single view. You can also create a new segment directly from the Query Builder.
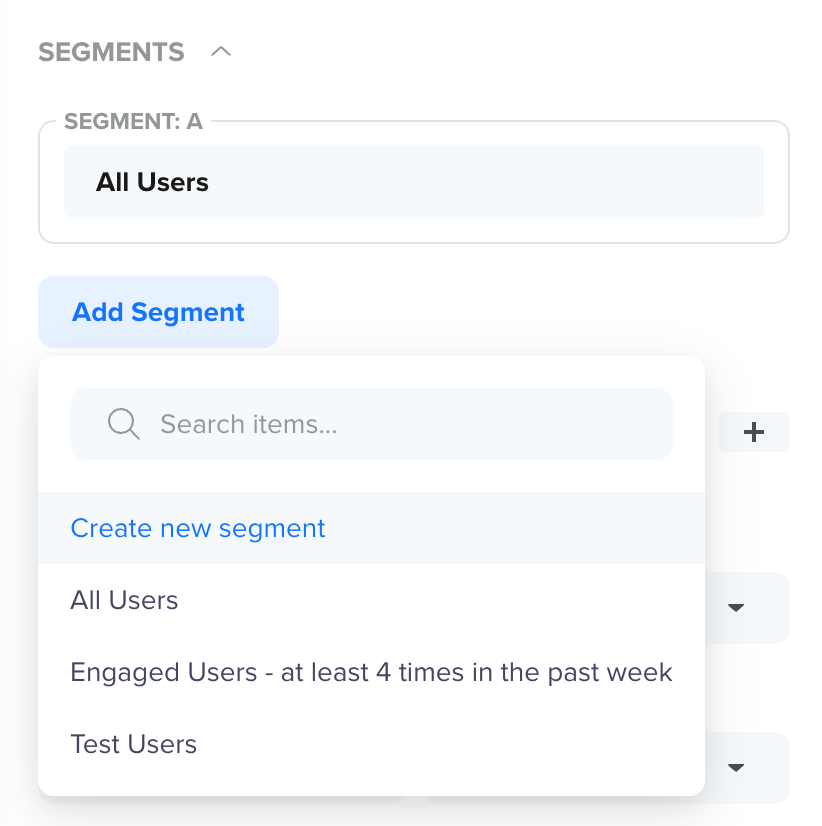
Select Segment for Funnel Analysis
You can compare funnel conversions across different user segments to analyze how behavior varies between user groups. For example, you can compare the funnel App Launched > Product Viewed > Charged across the All Users and Engaged Users - at least 4 times in the past week segments to understand how engagement level impacts conversion.
In the following example, the Engaged Users segment shows a higher conversion rate at each funnel step compared to All Users. This indicates that users who are already engaged with the app are more likely to progress through the funnel and complete a purchase. Insights such as these can help you prioritize high-value segments, refine your targeting strategies, and identify where less-engaged users tend to drop off.
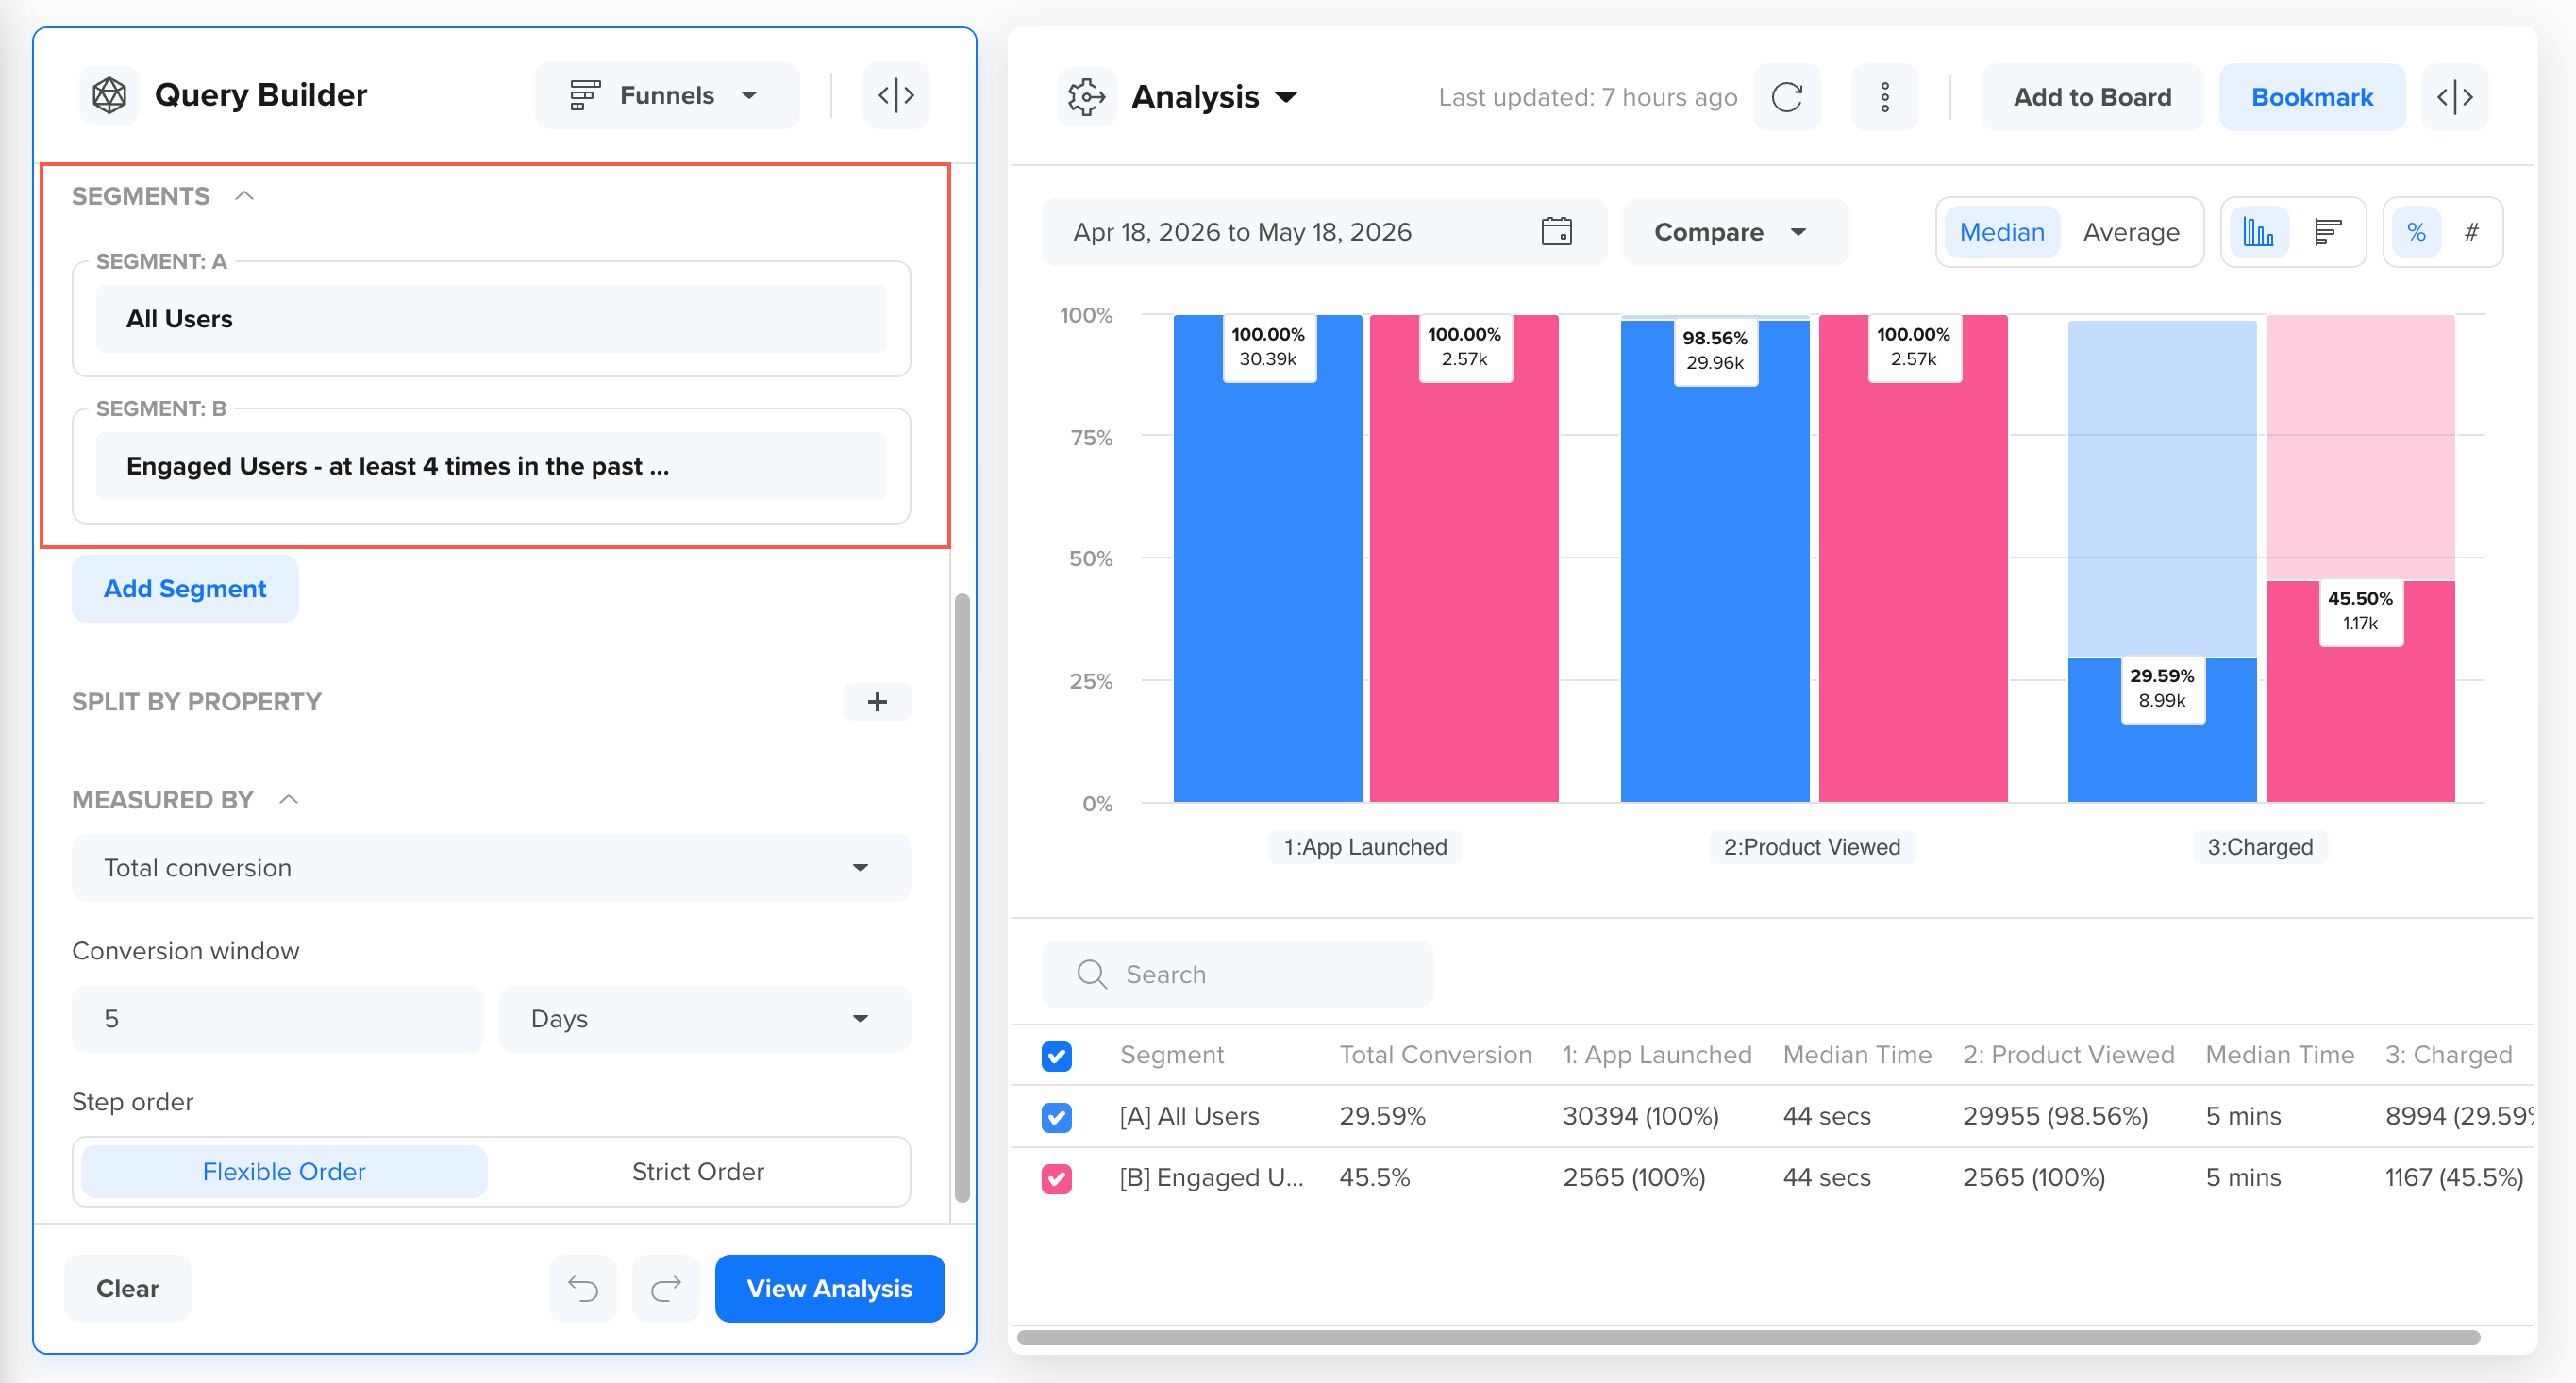
Segment Comparison Results
Split by Property
You can split a funnel by event properties, user profile properties, or custom attributes, such as sessions, geographies, technographics, or any other custom attributes. This allows you to compare how different attributes influence user progression and conversion across the same funnel.
Splitting funnels helps you answer questions such as:
- Which products convert better?
- Which languages, regions, or devices show higher drop-offs?
- Where should optimization efforts be focused?
Split by Event Property
In the following example, the funnel is split by the product event property. Each row represents a different product, allowing you to compare how users progress through the funnel for each product variant.
Here, the analysis shows that some products have higher overall conversion rates than others. This indicates which products are more effective in driving users toward conversion and which may require improvements in discovery, pricing, or user experience.
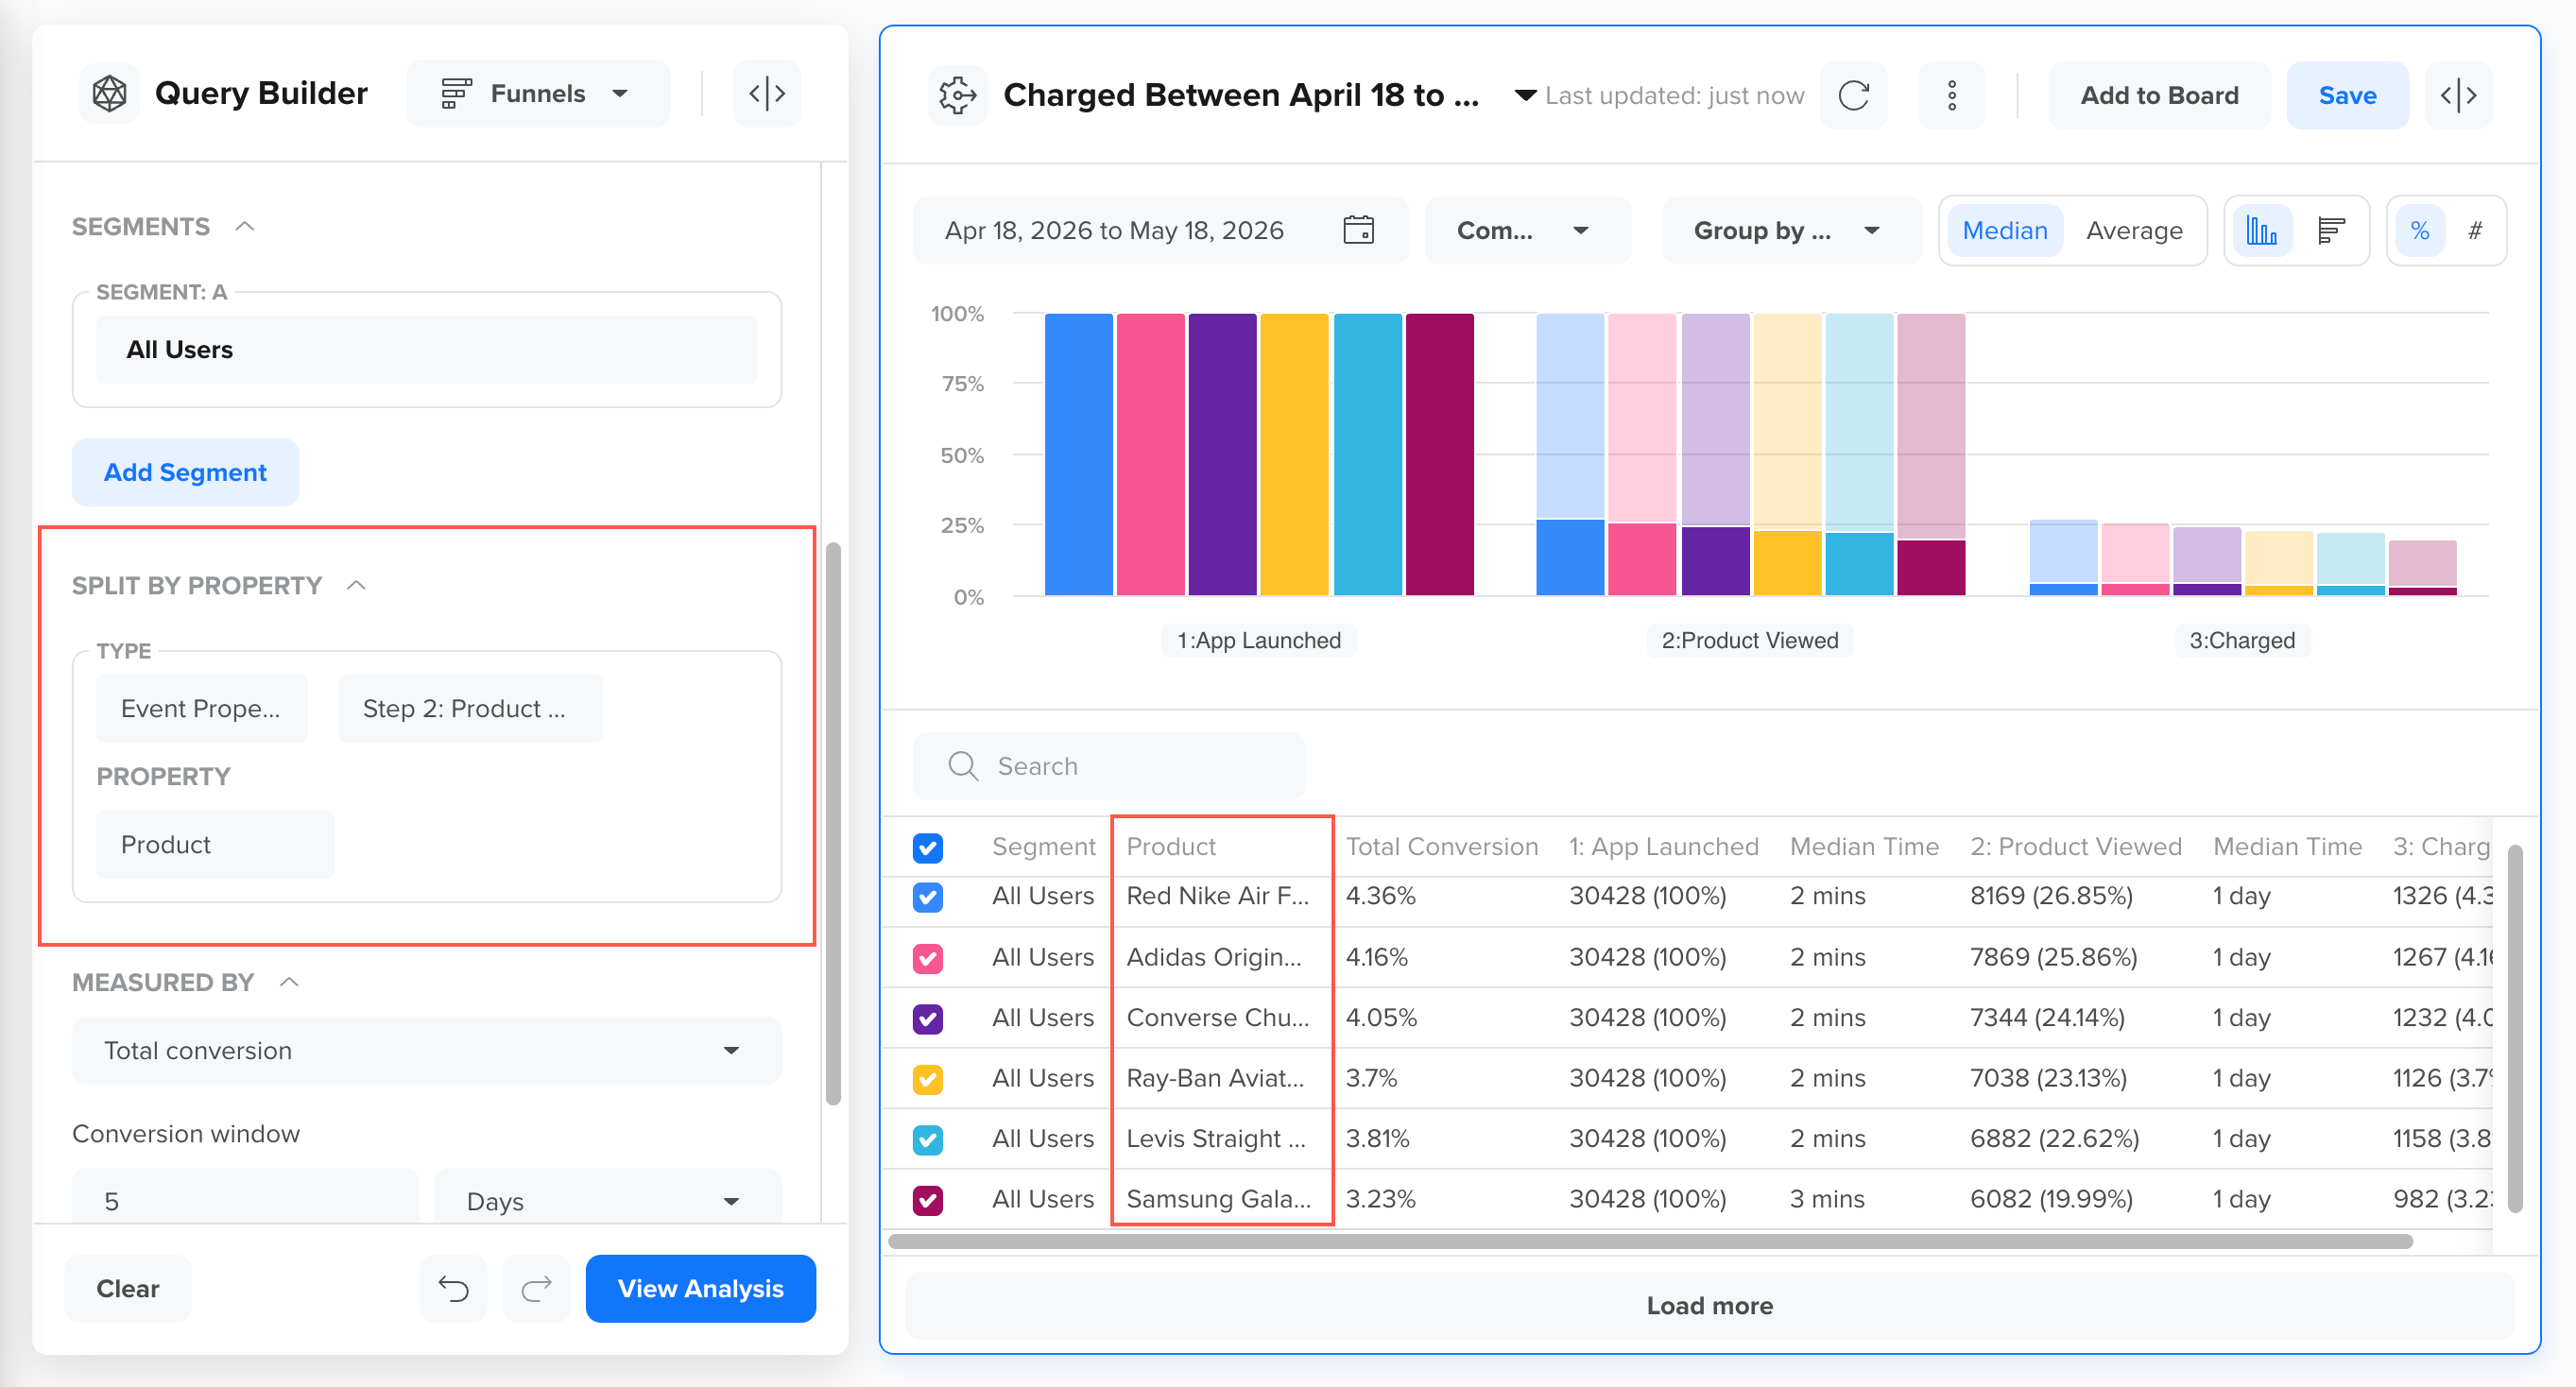
Split Funnel by Event Property
Split by User Property
In the following example, the funnel is split by the Language user property. Each row represents a language group, enabling you to compare conversion behavior across different user demographics.
Here, the analysis shows that users with different language preferences convert at different rates. These insights can help identify which language segments are performing well and which may benefit from localized content, messaging, or onboarding improvements.
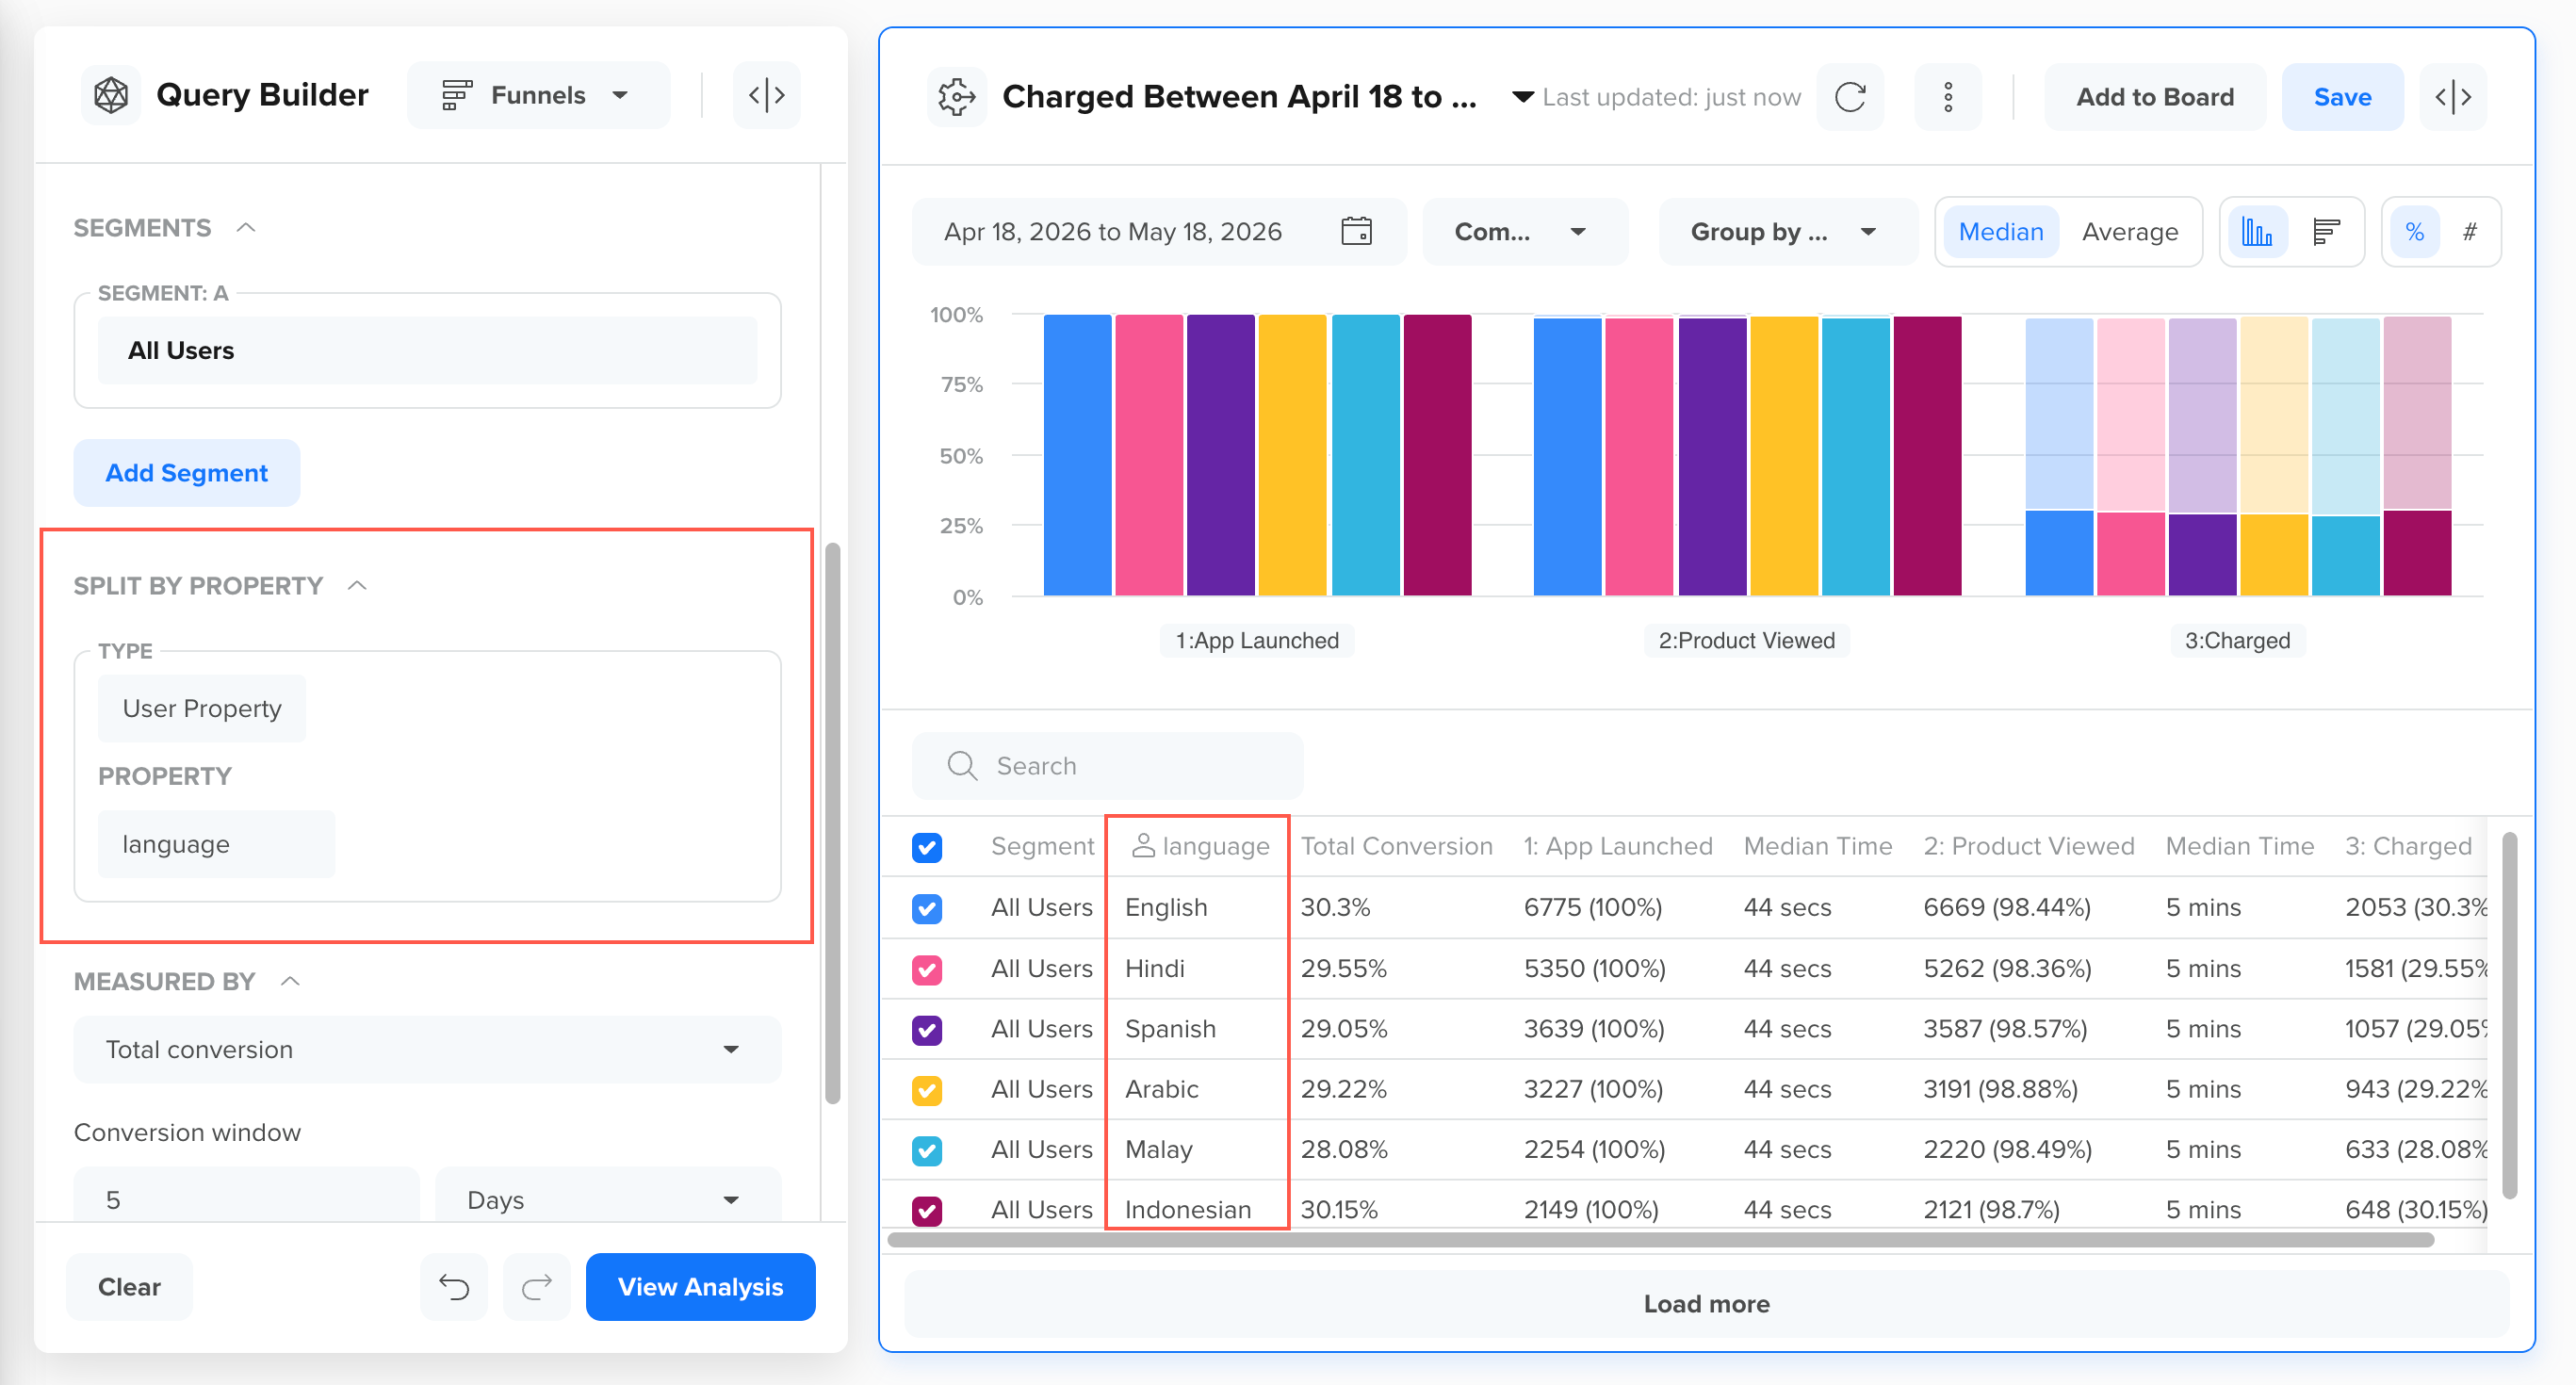
Split Funnel by User Property
Select Measured By Options
The MEASURED BY options control how funnel conversions are calculated, grouped, and evaluated. These settings directly impact how users are counted and how funnel results are displayed.
From the MEASURED BY options, you can query:
Measurement Mode
The measurement mode determines whether funnel performance is displayed as a single aggregated value or as a trend over time.
You can choose one of the following measurement modes:
Total Conversion
Selecting Total Conversion displays the aggregate conversion count or conversion rate for the selected time range. Results are shown as a single value and are not broken down by time.
For example, selecting total conversion for the funnel App Installed > App Launched > Added to Cart over the last 30 days shows the overall percentage and number of users who completed the entire funnel during that period. This provides a quick snapshot of how effectively users convert from the first step to the final step, without focusing on daily or weekly fluctuations.
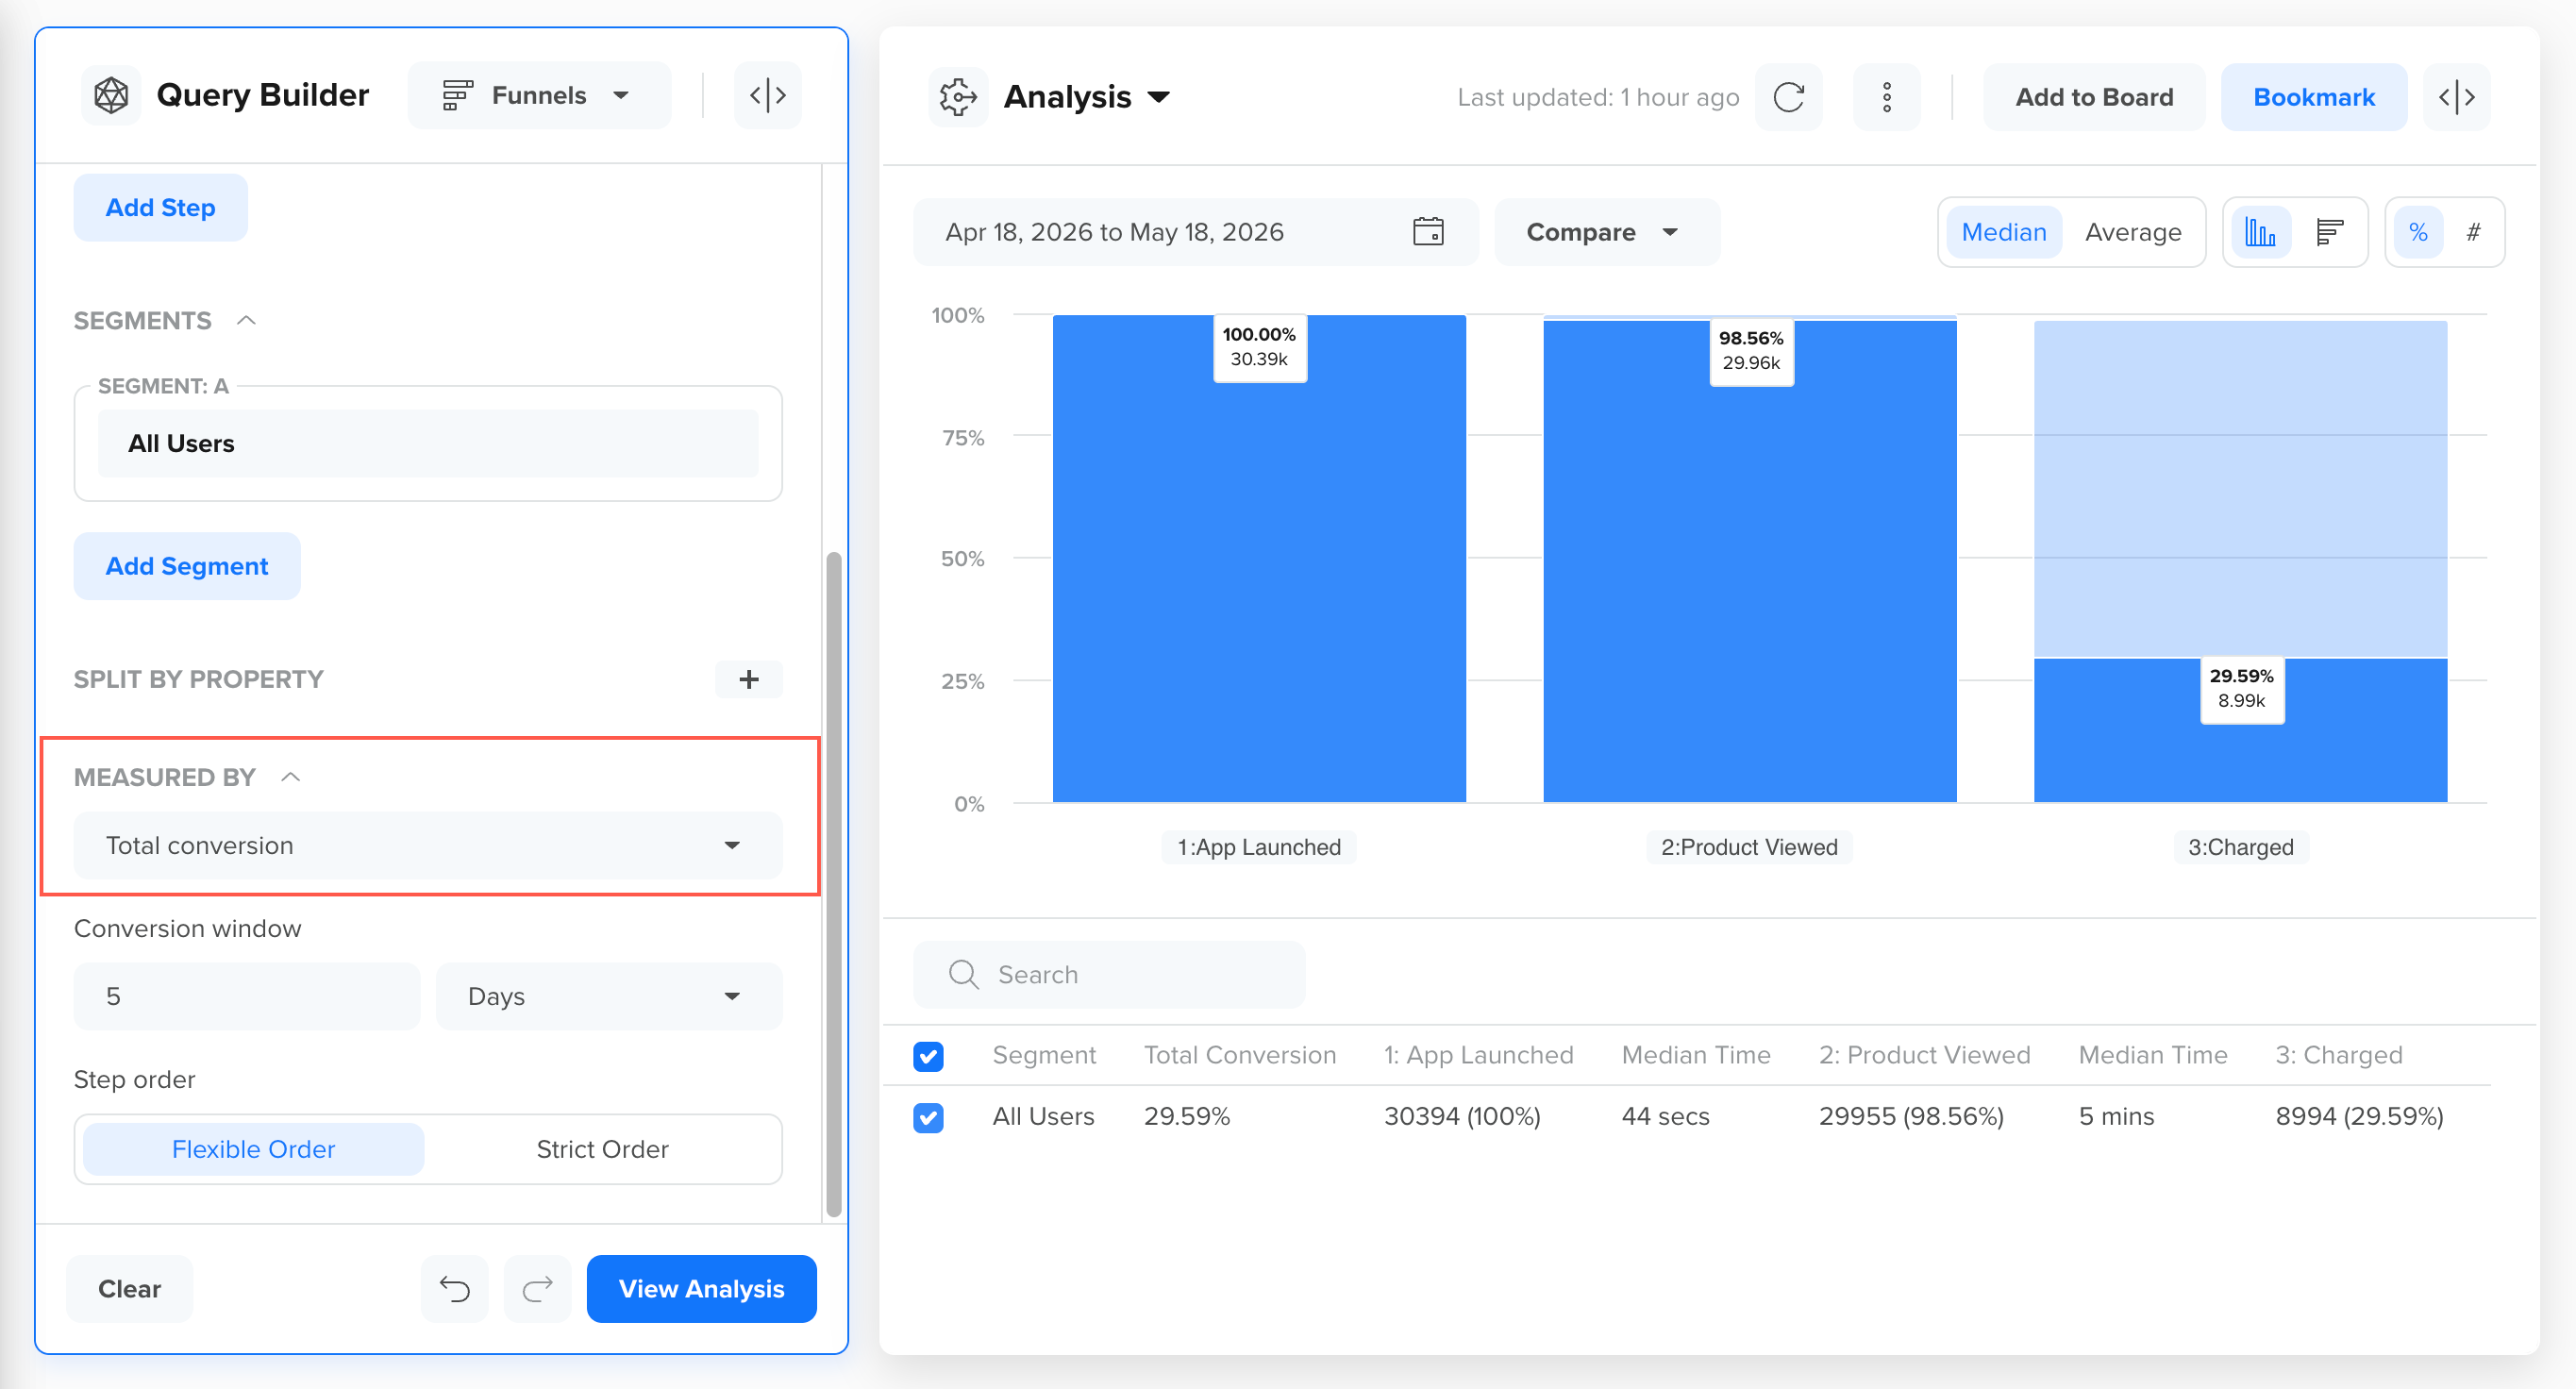
Measured by Total Conversion
Use the Total Conversion option when you want to:
- Get a high-level summary of funnel performance
- Compare overall conversion rates across segments
- Report a single conversion metric for a given period
Trends
Selecting Trends allows you to analyze how funnel conversions change over time. When Trends is selected, you must also choose a time granularity, that is, Day, Week, or Month, to view the trend.
For example, analyzing daily conversion trends for the funnel App Installed > App Launched > Added to Cart over the last 30 days can help you identify when conversions increase or decline. These patterns may correlate with product releases, marketing campaigns, or external factors, enabling you to understand what influences user progression through the funnel and take timely action.
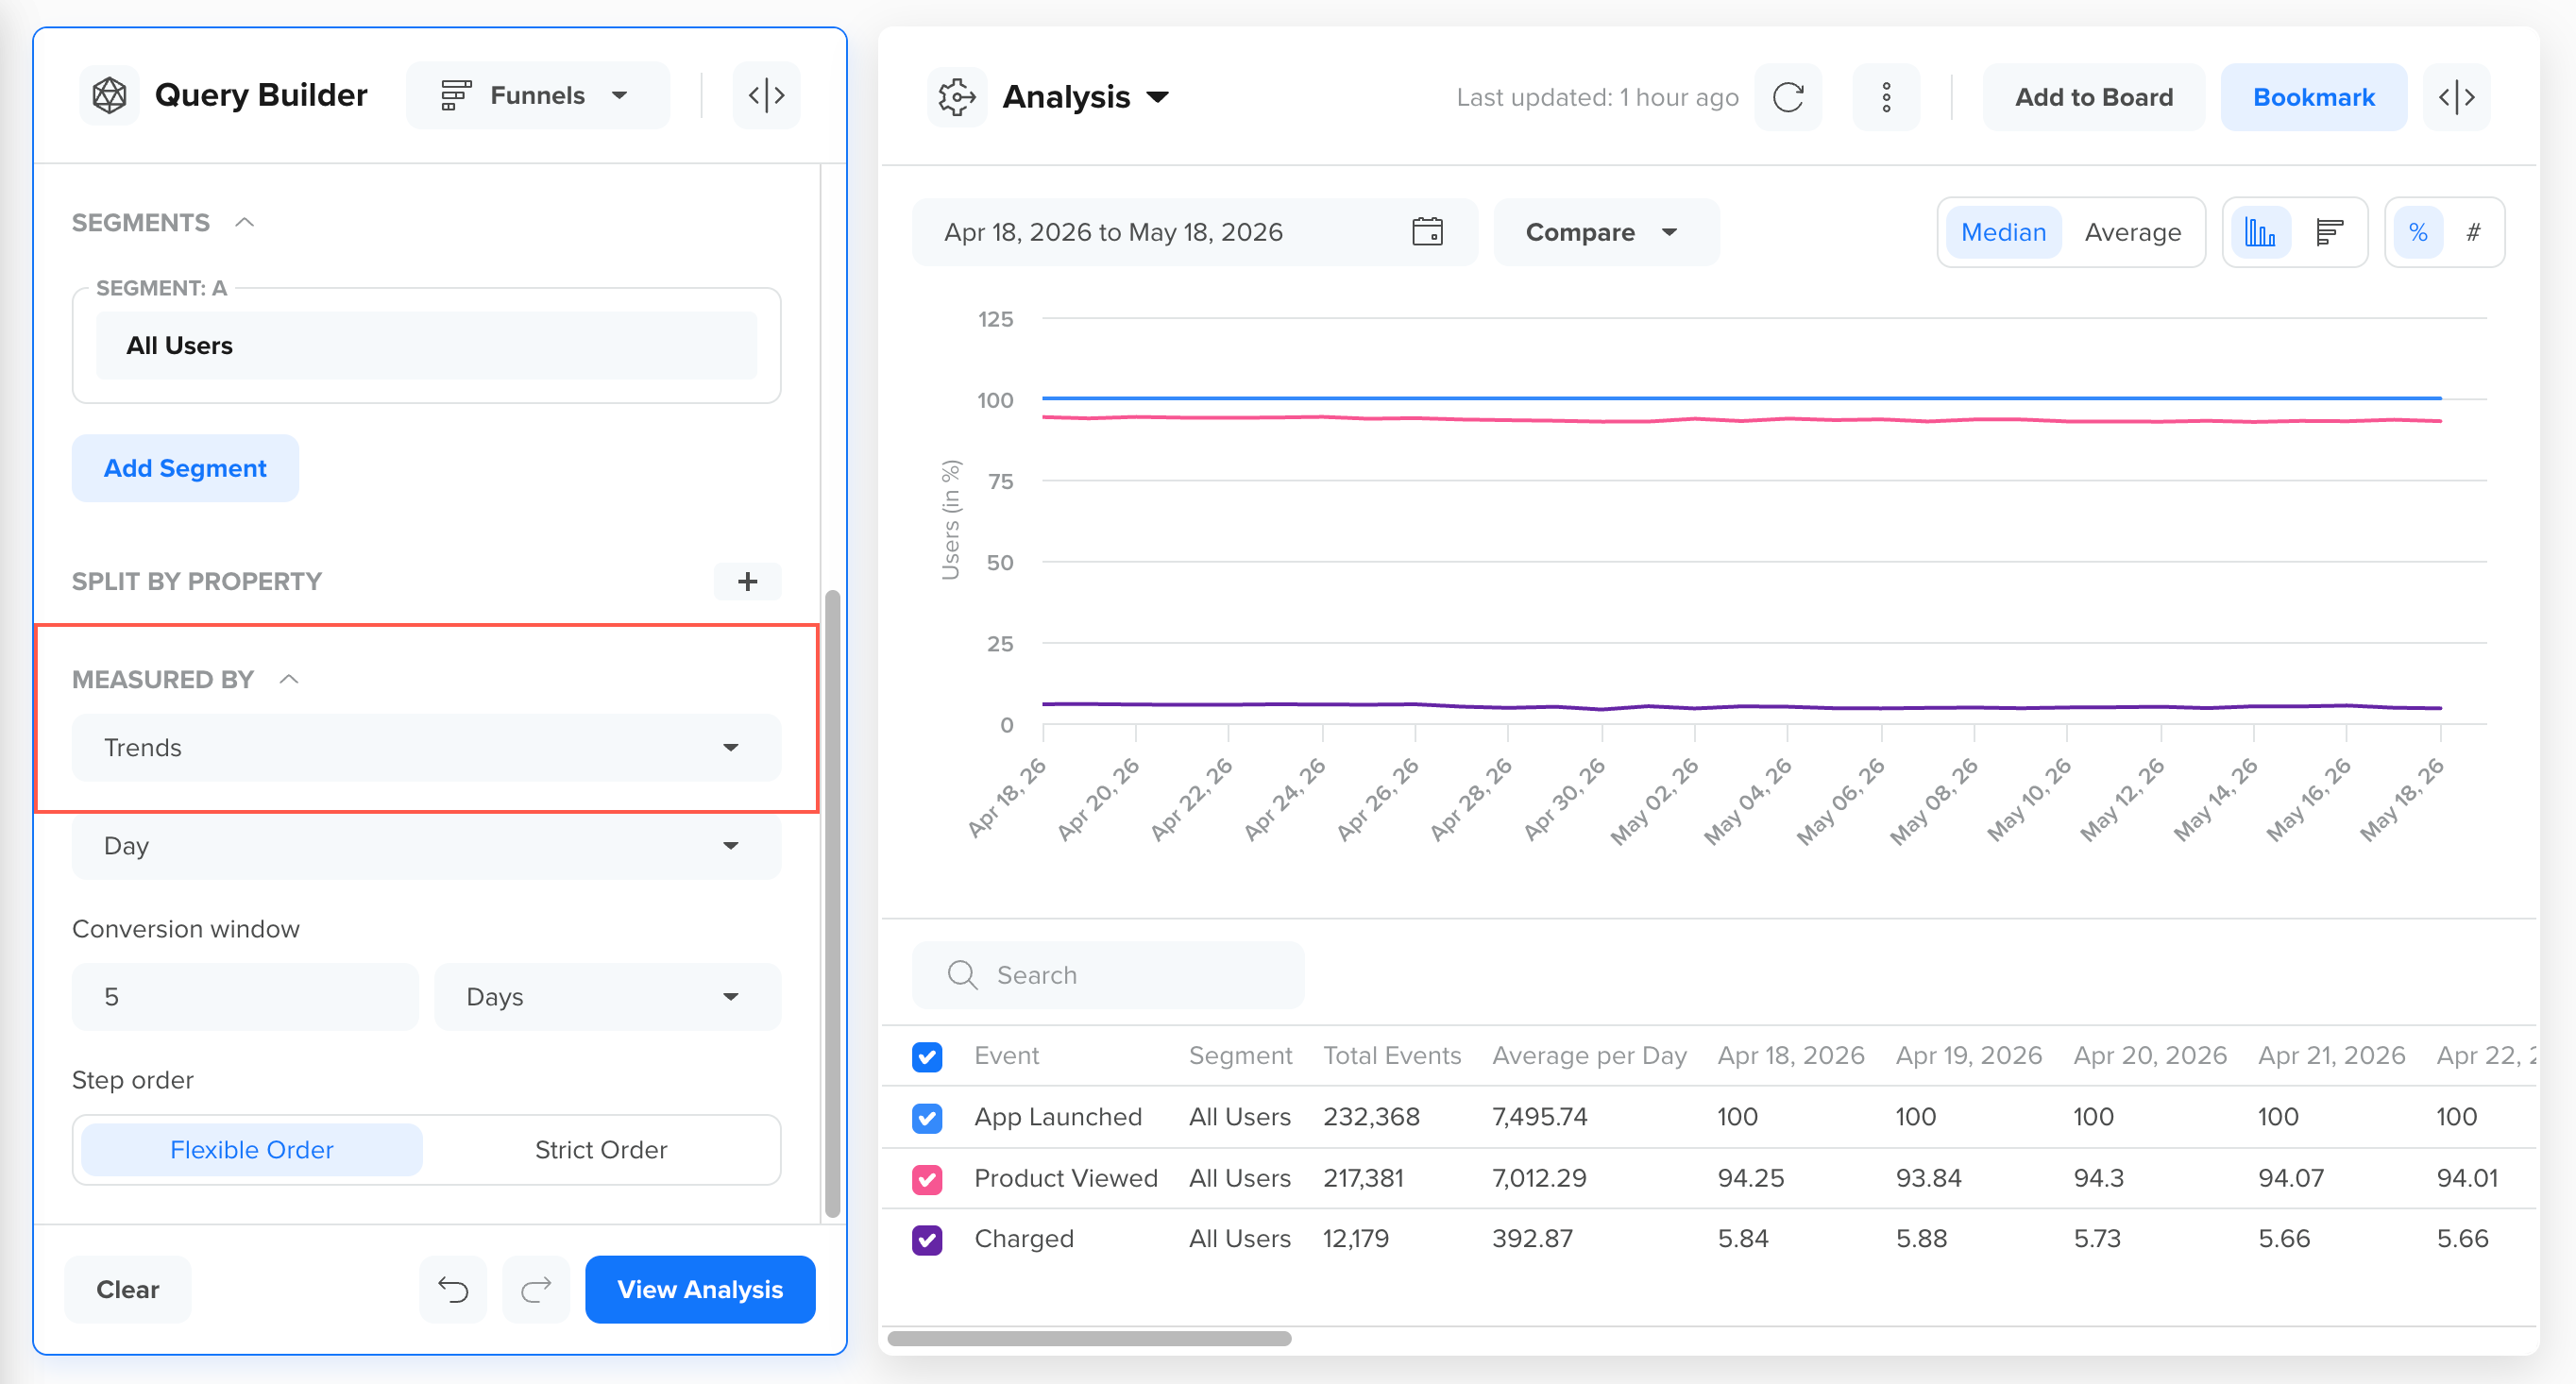
Measured by Trends
Use the Trends option when you want to:
- Track conversion performance over time
- Identify spikes, drops, or seasonality in funnel conversions
- Compare trends across segments or properties
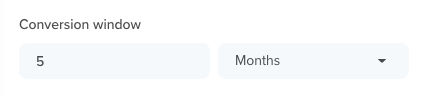
Conversion Window
Funnels are calculated using a conversion window, which defines the maximum time you allow users to complete all funnel steps. The conversion window is set to 5 days by default, but you can adjust it based on the type of analysis you want to perform.
A shorter conversion window applies stricter criteria and includes only users who complete the funnel within a shorter timeframe. A longer conversion window gives users more time to complete all steps, resulting in more users qualifying for the analysis, not necessarily more conversions.
Choose the conversion window based on how long your typical user journey takes. For example, fast actions, such as onboarding, may require shorter windows, while high-consideration flows, such as purchases, may require longer ones.
Set Conversion Window
Time Interval for Conversion WindowCleverTap recommends setting the Conversion Window to a duration shorter than the selected date range of the analysis. This helps ensure consistent and reliable funnel results by avoiding partial or overlapping conversions.
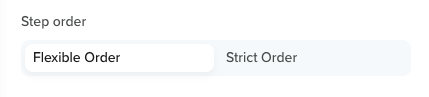
Step Order
The Step Order setting determines whether users must follow the predefined funnel step sequence to be counted as converted. This order determines how users are counted as they progress through funnel steps, primarily when steps are repeated or performed out of sequence.
Funnel Step Order
You can select one of the following options:
Flexible Order
By default, funnels count users who complete all defined steps in the specified sequence. Users may repeat earlier steps, but they must still complete every funnel step to be counted as converted. If a user skips a required step and completes it later, the funnel does not count that user as a conversion.
For example, a funnel's steps are defined in the following sequence:
Step A > Step B > Step C > Step D
The following table explains how different users are counted based on their progress through the funnel steps:
| User | Step Sequence | Counted in Funnel? | Reason |
|---|---|---|---|
| User 1 | Step A > Step B > Step C > Step D | Yes | Completes all funnel steps in the correct order. |
| User 2 | Step A > Step C > Step D | No | Skips Step B, which is required in the funnel. |
| User 3 | Step A > Step C > Step B > Step D | No | Performs funnel steps out of sequence. |
| User 4 | Step A > Step B > Step A > Step C > Step D | Yes | Repeats Step A but still completes all steps in the correct sequence. |
Why Use Flexible Order?
Flexible ordering is useful when you want to measure overall funnel completion without ignoring users for repeated or exploratory behavior.
In many user journeys, users may repeat steps, navigate back and forth between screens, or perform actions multiple times before progressing. Flexible Order ensures that these natural behaviors do not prevent users from being counted as converted, provided they eventually complete all required steps in the correct sequence.
For example, consider the following conversion sequence of two users in an app:
User A: App Launched > Viewed Product > Viewed Product > Added to Cart > Viewed Product > Purchased
User B: App Launched > Viewed Product > Added to Cart > Purchased
With Flexible Order enabled, both users are counted as converted because they complete all funnel steps in the defined order, even though User A repeats some steps.
Strict Order
When Strict Order is selected, funnels count users only if they complete every step exactly in the defined sequence. Any repetition of a funnel step or deviation from the specified order disqualifies the user from being counted as converted.
For example, a funnel's steps are defined as follows:
Step A > Step B > Step C > Step D
The following table explains how different users are counted based on how they progress through the funnel steps:
| User | Step Sequence | Counted in Funnel? | Reason |
|---|---|---|---|
| User 1 | Step A > Step B > Step C > Step D | Yes | Completes all funnel steps exactly in the specified order. |
| User 2 | Step A > Step C > Step D | No | Skips Step B, breaking the required step sequence. |
| User 3 | Step A > Step C > Step B > Step D | No | Performs funnel steps out of order. |
| User 4 | Step A > Step B > Step A > Step C > Step D | No | Repeats Step A, which violates strict ordering rules. |
Why Use Strict Order?
Strict ordering is useful for identifying friction or unexpected behavior within a process.
For example, consider the following Login sequence of two users in an app:
- User A: App Launched > Login Attempted > Login Attempted > Login Attempted > Logged In
- User B: App Launched > Login Attempted > Logged In
With strict order enabled, User A is not counted as a clean conversion, highlighting repeated login attempts and potential user friction. This makes strict order particularly valuable for diagnosing issues in critical sequences such as authentication, onboarding, or payments.
Reading Funnel Analysis
CleverTap offers multiple views to help you effectively interpret funnel performance. Based on whether you want a visual overview or a detailed comparison, you can analyze funnel data using Chart View or Table View. Each view highlights different aspects of user progression and conversion behavior.
Chart View
Chart View provides a visual representation of how users progress through each step of the funnel, enabling easy identification of drop-offs and overall conversion trends at a glance.
The chart shows cumulative conversions per step for the selected time range. You can view the data either as an absolute count of users completing each step or as a percentage.
Vertical Chart
The default chart orientation is vertical, displaying funnel steps from left to right. This layout supports funnels with up to 8 steps and split-by property values without visual crowding.
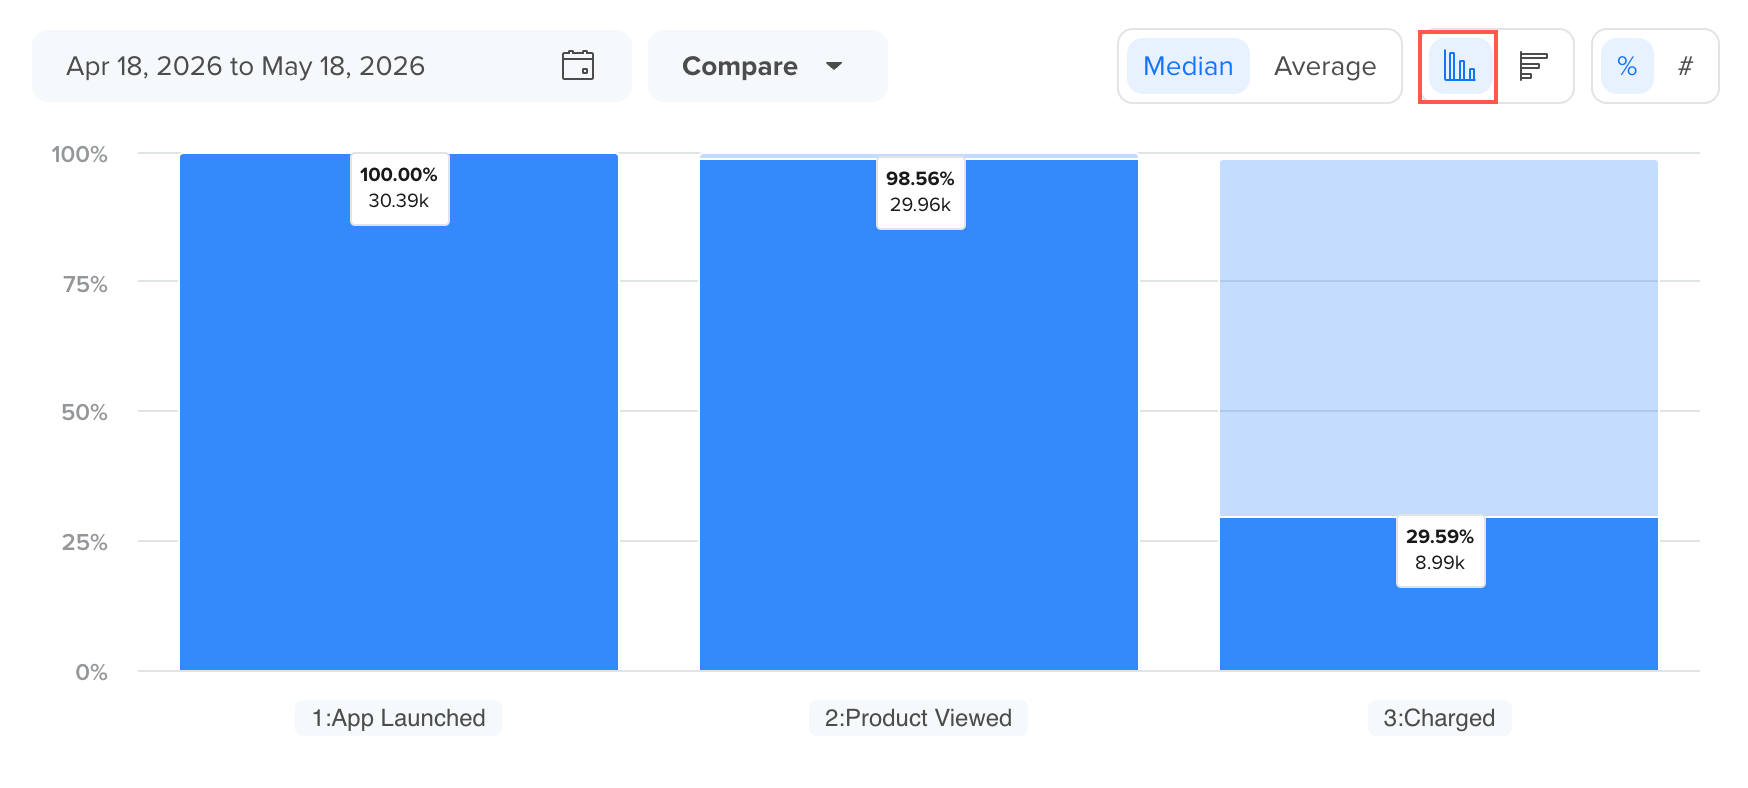
Vertical Chart View of a Funnel Analysis
Horizontal Chart
To switch to a horizontal layout, click the orientation toggle in the chart toolbar. The selected orientation persists throughout the analysis session.
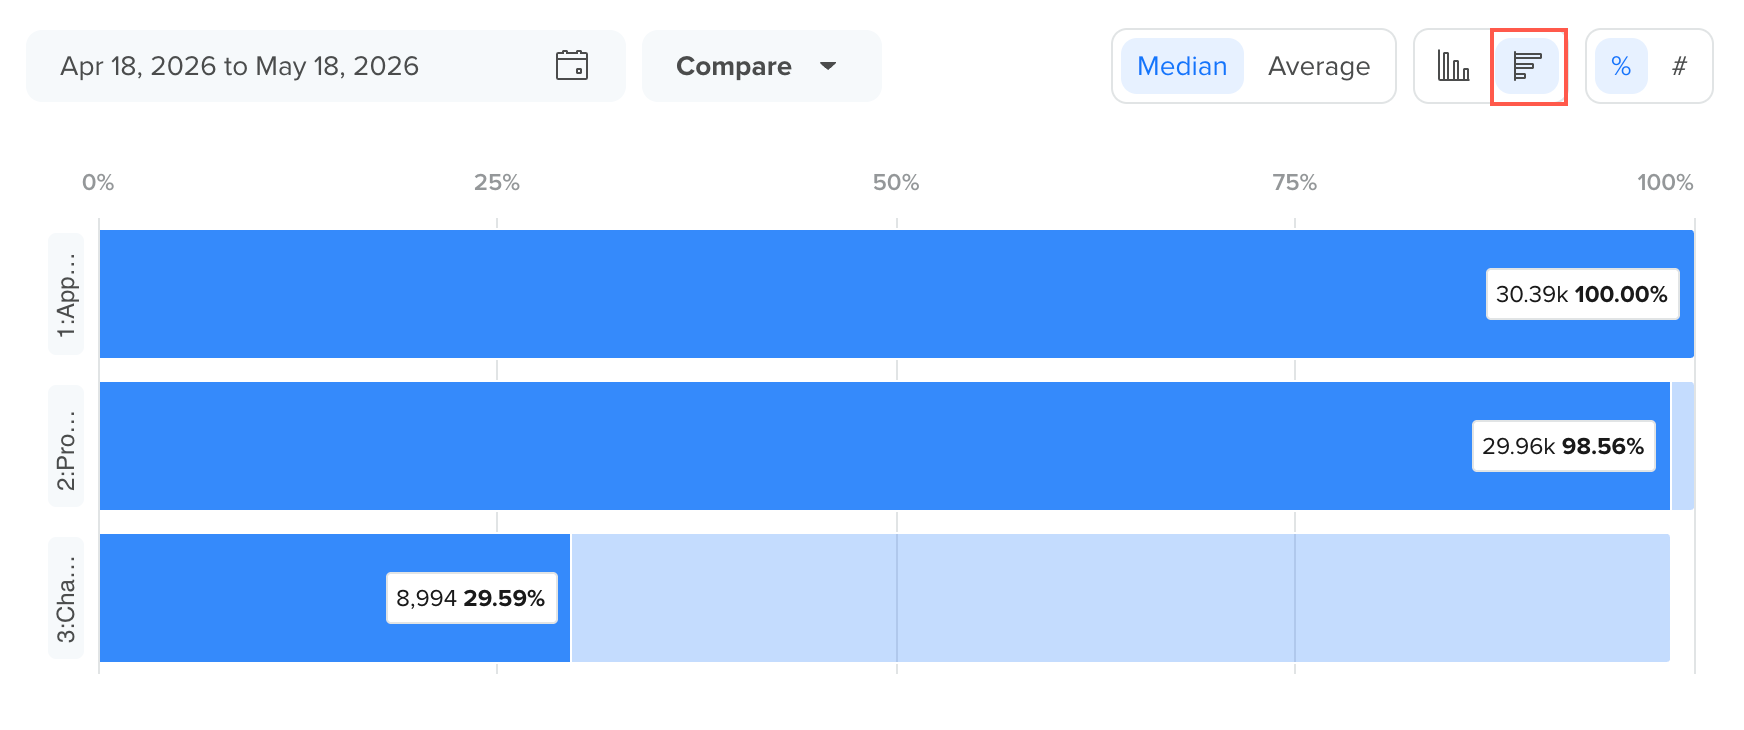
Horizontal Chart View of a Funnel Analysis
Table View
Table View presents the funnel results in a structured tabular format, allowing you to inspect detailed step-level metrics alongside the visual funnel chart.
Each row in the table represents a funnel breakdown, such as a selected segment or a property-based split used in the funnel analysis. The table helps you compare conversion performance across segments and understand where users drop off at each step.
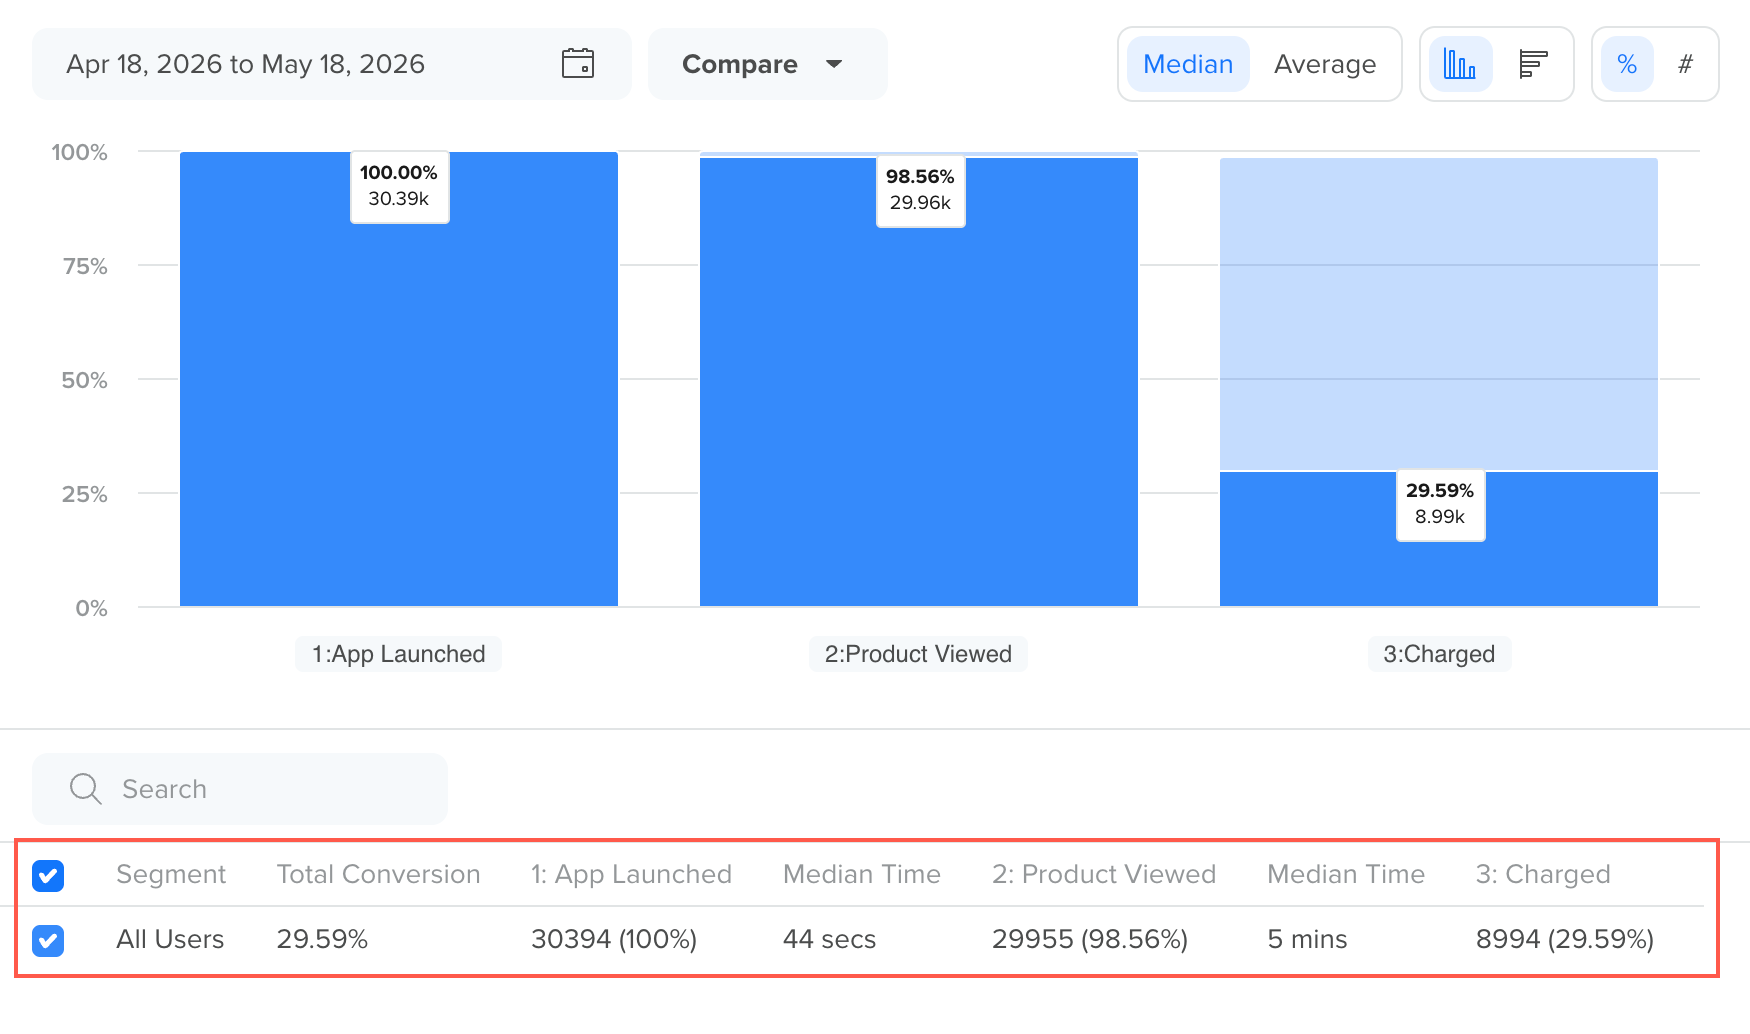
Table View of a Funnel Analysis
The table includes the following columns:
- Segment: The segment or split value used in the funnel analysis. For example, All Users or different property-based groups when the funnel is split by a property.
- Total Conversion: The overall conversion rate from the first step to the final step of the funnel.
- Step Conversion Columns: Each funnel step shows the number of users who reached that step, along with the corresponding percentage relative to the first step.
- Median/Average Time Between Steps: Displays the elapsed time between consecutive funnel steps. The metric shown depends on the selection in the time metric dropdown, either Median Time (default) or Average Time. The selected metric updates elapsed time values in both the table and the chart labels simultaneously. Elapsed time values are displayed in the following format:
- Values under 60 seconds display as seconds.
- Values of 60 seconds or more display as minutes and seconds.
You can also use the Search field in the table to quickly find specific segments or split values in large funnel analyses.
Switch Display Controls
You can always switch between display controls to view how funnel results are displayed in the chart.
Depending on the analysis, you can view results as:
Percentage
Use percentage (%) to understand relative conversion performance across steps.
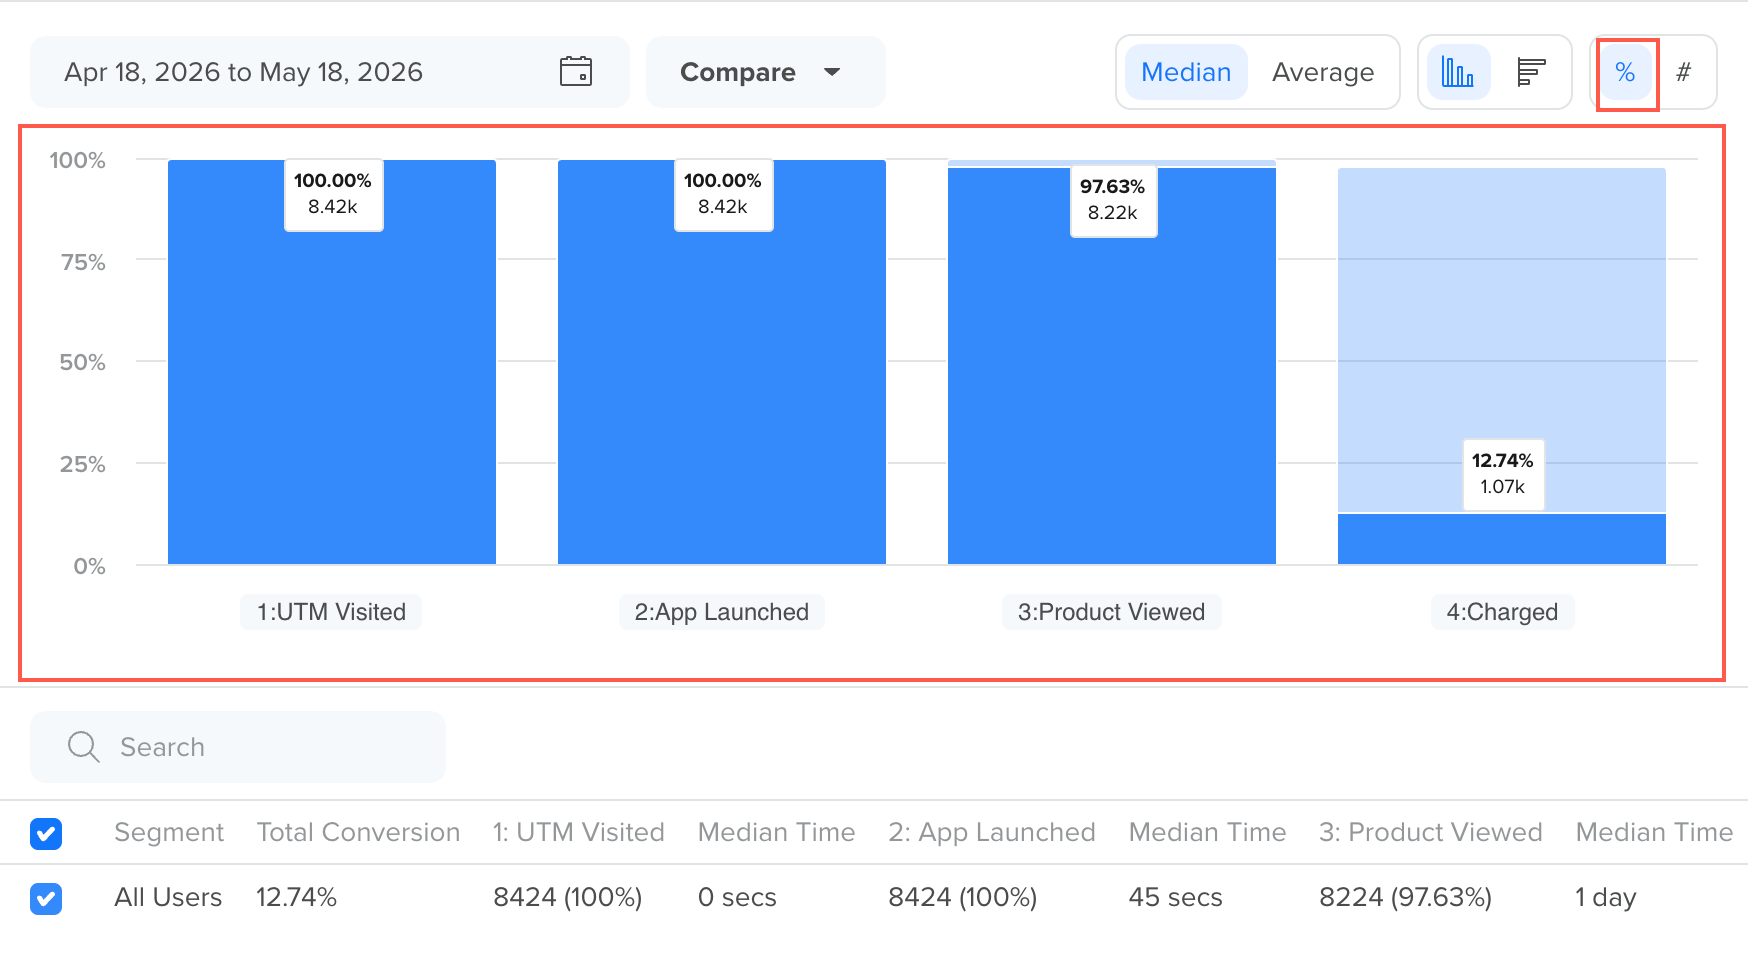
View Funnel Analysis in Percentage
Count
Use count (#) to inspect the actual number of users progressing through each step.
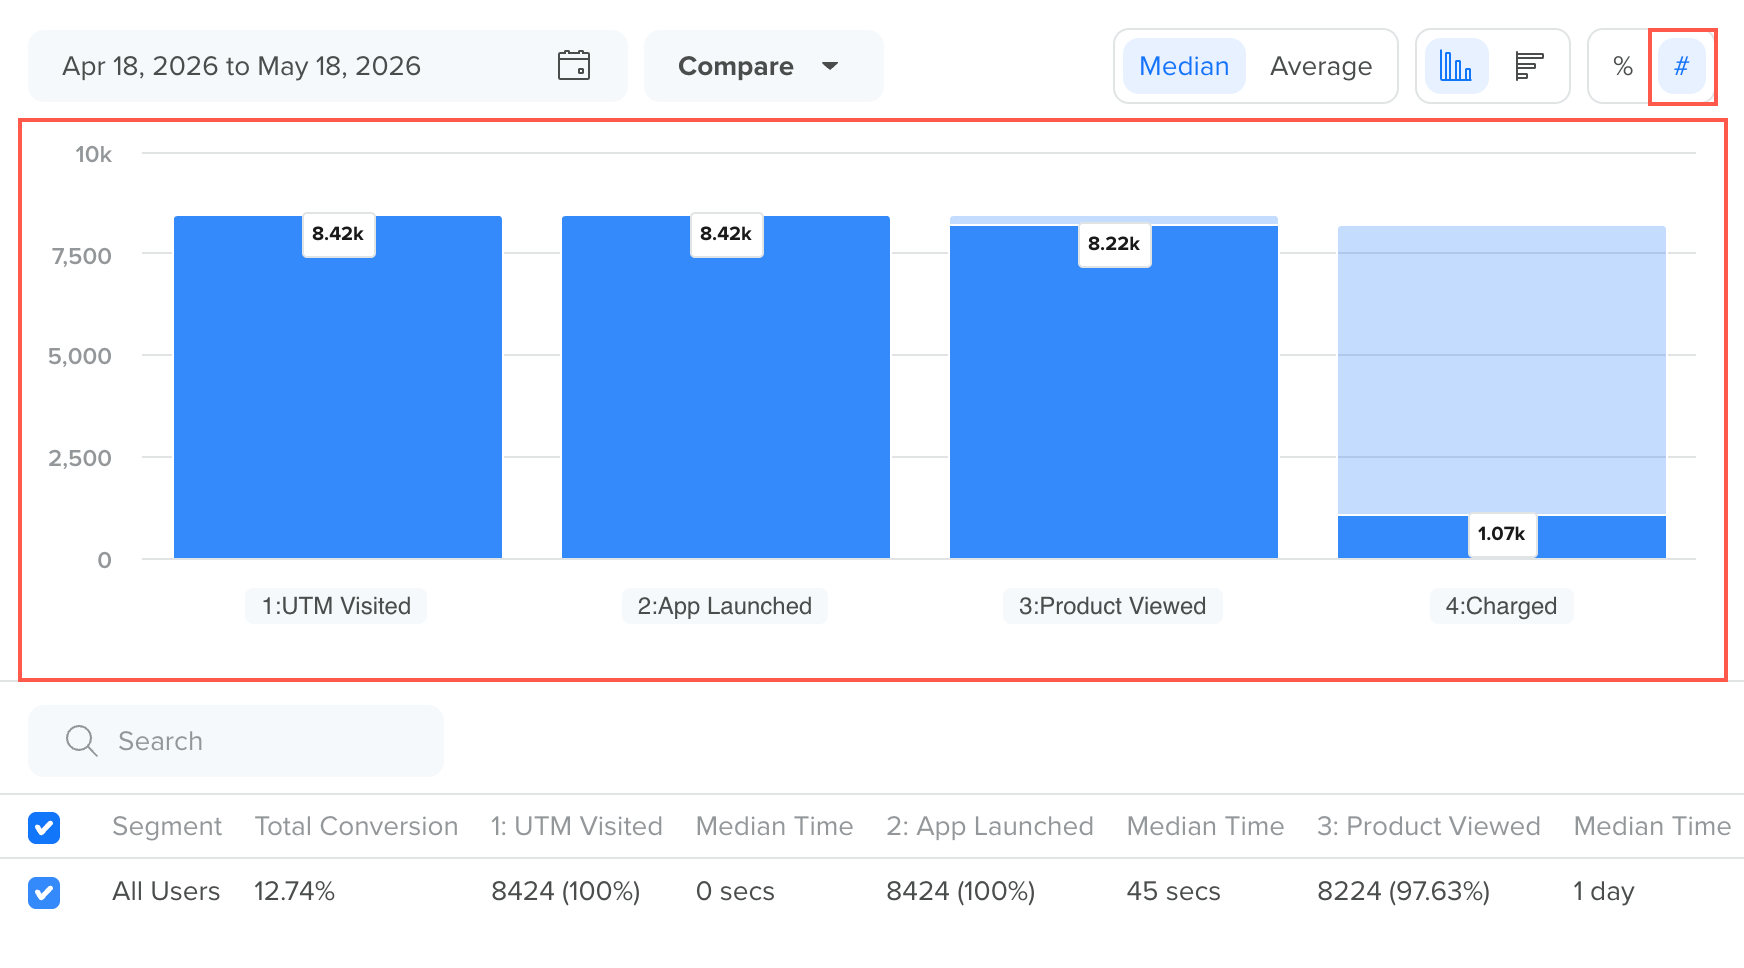
View Funnel Analysis in Count
Time Metric
Use the time metric dropdown in the chart toolbar to switch between elapsed time display options. You can select one of the following options:
- Median Time: Displays the median elapsed time between steps. This is the default selection.
- Average Time: Displays the average elapsed time between steps.
The selected metric updates elapsed time values in the table, chart labels, and tooltips.
View Median/Average Time Metric in a Funnel Analysis
Use the time metric option when you want to:
- View the most representative elapsed time for typical users (Median Time).
- Understand the overall average time across all users, including outliers (Average Time).
Operations
Once you generate a funnel analysis, you can perform several actions from the Analysis pane to compare results, switch views, save the analysis, and take follow-up actions based on the funnel data.
The available operations help you move from analysis to action without having to rebuild the query.
Inspect Funnel Data
Hover over any bar, step, or chart element in the funnel view to inspect detailed values for that stage of the funnel. This helps you inspect conversion values and drop-offs without switching to the table view.
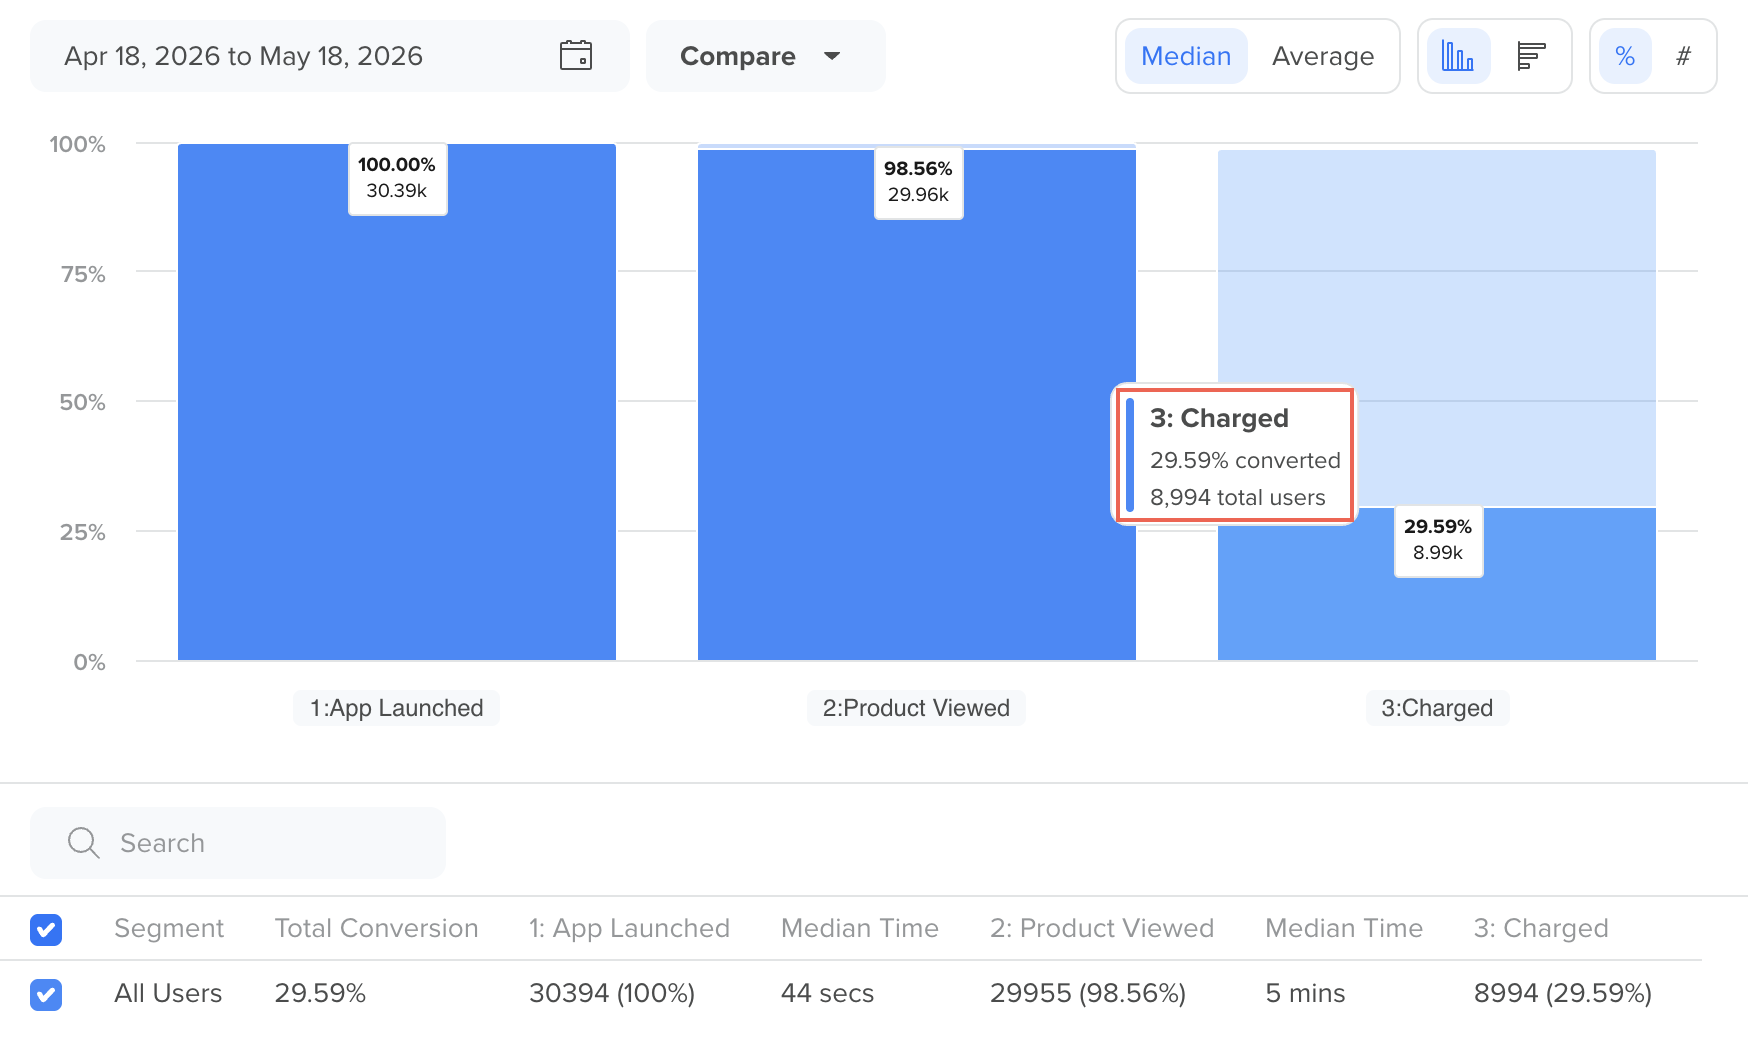
Inspect Data for a Funnel Step
The tooltip can show information such as:
- Step name
- User count
- Conversion percentage
- Segment or split-by value, if applicable
Add to Board
You can add a Funnel analysis to a Board to monitor it alongside other saved analyses.
To add a funnel to a board:
- Click Add to Board from the top-right corner of the dashboard after generating the funnel analysis.
- Enter the name of the current analysis in Chart name. For example, Charged Between April 18 to May 18.
- Select Chart to add the funnel visualization as a chart tile, or select Table to add the funnel analysis in a tabular format to the board.
- Select an existing board or create a new one where you want the chart to be added.
- Click Add to board.

Add a Funnel Analysis to a Board
Use boards when you want to:
- Track the same funnel regularly
- Combine Funnels with Trends, Flows, Cohorts, or Pivots
- Share a monitoring dashboard with your team
Bookmark a Funnel Analysis
You can bookmark any Funnel analysis to quickly revisit it later. Bookmarks are user-specific, meaning only the logged-in user can view their saved funnel analyses on the CleverTap dashboard.
Bookmarks are especially useful for tracking frequently accessed conversion journeys. For example, if you regularly monitor a funnel such as App Launched > Product Viewed > Added to Card > Charged, bookmarking it lets you instantly return to the same setup without recreating the analysis each time.
To bookmark a Funnel:
- Click Bookmark in the top-right corner of the dashboard after generating the funnel analysis.
- Enter a descriptive name to help you identify the analysis later.
- Click Bookmark.
Bookmark a Funnel Analysis
Bookmark LimitYou can save up to 50 bookmarks and access all your saved bookmarks from the bookmark list under the Funnels section.
Export Funnel Analysis
You can export the generated funnel analysis for reporting or offline analysis.
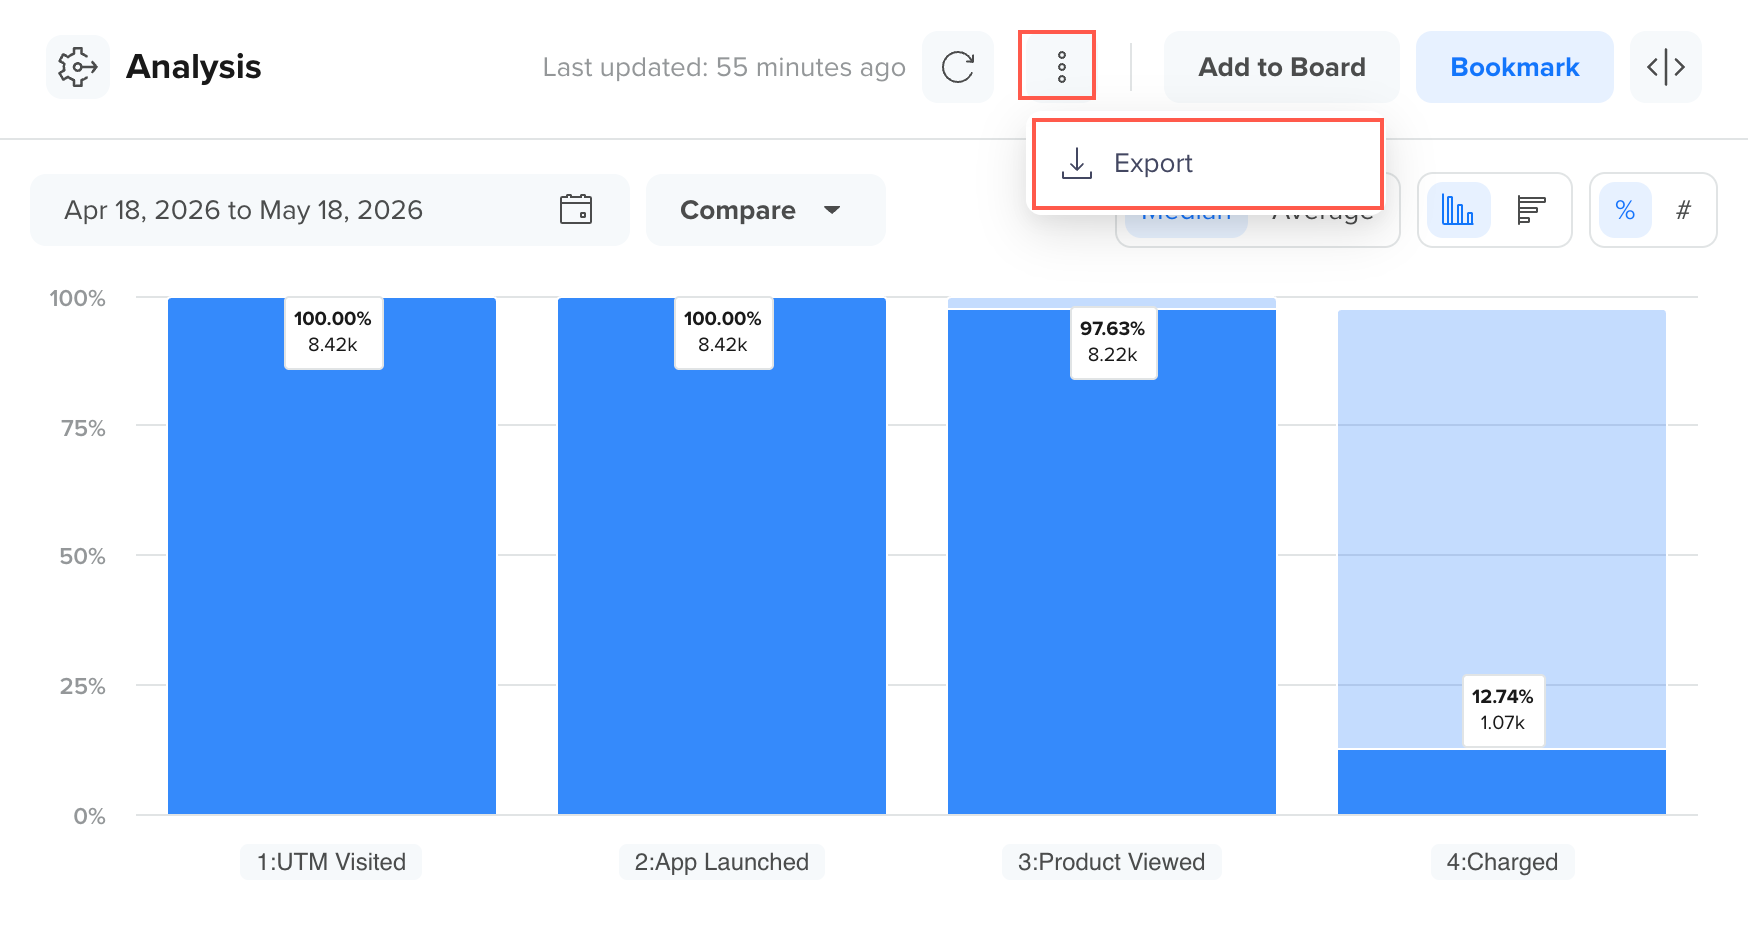
Export a Funnel Analysis
Depending on the selected view, Funnels supports export options such as:
- PNG image
- PDF document
- CSV file
Use exports when you want to:
- Share the chart in presentations or documents
- Download the raw tabular values for further analysis
- Archive analysis snapshots for reporting
Save as Segment
You can create a user segment directly from a funnel step to analyze or engage users who reached that stage.
Click on a funnel step in the chart, and an action menu with Save as Segment appears. Selecting Save as Segment opens the Segment Builder, where the system automatically generates a segment query for users who qualified for the selected funnel step.
For example, if you click the Added to Cart step in the funnel, the segment builder will pre-populate a query for users who reached that step within the selected time range.
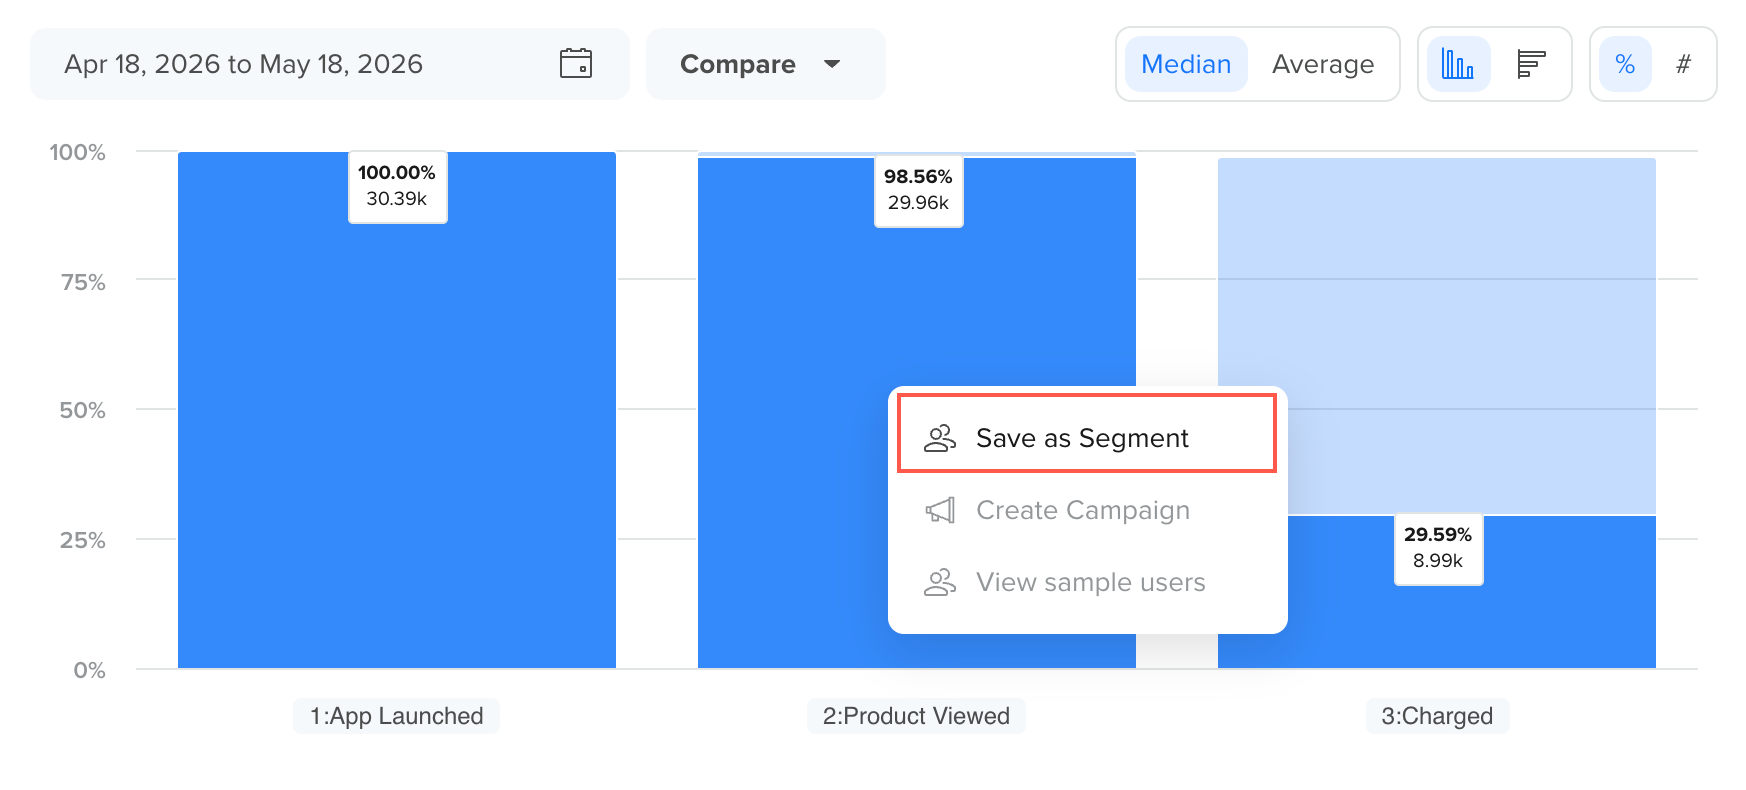
Save a Funnel Step Users as a Segment
You can then:
- Review or refine the generated segment conditions
- Add additional filters or rules
- Save the segment for future analysis or campaign targeting
This feature is useful when you want to:
- Retarget users who dropped off at a specific funnel step
- Build campaigns for users who completed or partially completed a funnel
- Perform a deeper analysis of users who reached a particular stage of a journey
Once you save a segment from a Funnel Analysis, it becomes available across the CleverTap dashboard and can be used in campaign targeting, analytics, or further segmentation analysis.
FAQs
Find answers to the following common questions about using ̉Funnels:
How Are Users Counted?
Each user is counted once per funnel evaluation period.
What Happens If a User Completes the Funnel Multiple Times?
If a user completes the funnel multiple times within the selected date range, only the first valid conversion within the conversion window is counted. Subsequent completions by the same user are ignored for that analysis.
What If a User Does Not Complete All Funnel Steps?
Users who do not complete all defined funnel steps within the specified conversion window are not considered converted. They are included only in the steps they completed, which helps identify drop-off points in the funnel.
How Does the Conversion Window Affect Funnel Results?
The conversion window defines the maximum time a user has to complete all funnel steps. If a user exceeds this time, the funnel does not count them as converted, even if they eventually complete all steps. A shorter window results in stricter conversion criteria, while a longer window allows more users to qualify.
Can I Change Funnel Settings After Viewing Results?
Yes. You can modify funnel settings such as events, segments, measurement mode, conversion window, or step order at any time. However, changing these settings triggers a new funnel calculation, and previously generated results are not retained.
Are Funnel Results Calculated in Real Time?
Funnel results are near real-time, but may experience a short processing delay due to varying data volumes and query complexities. Recently ingested events may take a few minutes to appear in funnel analysis.
Can I Compare Funnels Across Different Date Ranges?
Yes. You can change the date range and re-run the same funnel configuration to compare performance across different periods. For trend-based analysis, using the Trends measurement mode is recommended.