Analyze Predictions
Discover how to analyze predictions right from the CleverTap dashboard and unlock valuable insights to elevate your engagement strategy.
Overview
Once a prediction model is set up in CleverTap, CleverAI processes user data to provide insights into their likelihood of performing specific goal events within a set timeframe. These insights, presented through various metrics and visualizations, help you take targeted actions to boost user engagement and drive higher conversions.
View Prediction Insights
The CleverTap dashboard provides a detailed overview of all your predictions, including performance metrics and segmented user insights. When a prediction is initiated for the first time, the state changes to Processing. Opening a prediction while it is still in the Processing state does not show any insights. Once processing is completed, the prediction status changes to Active, and you can access the detailed analysis results.
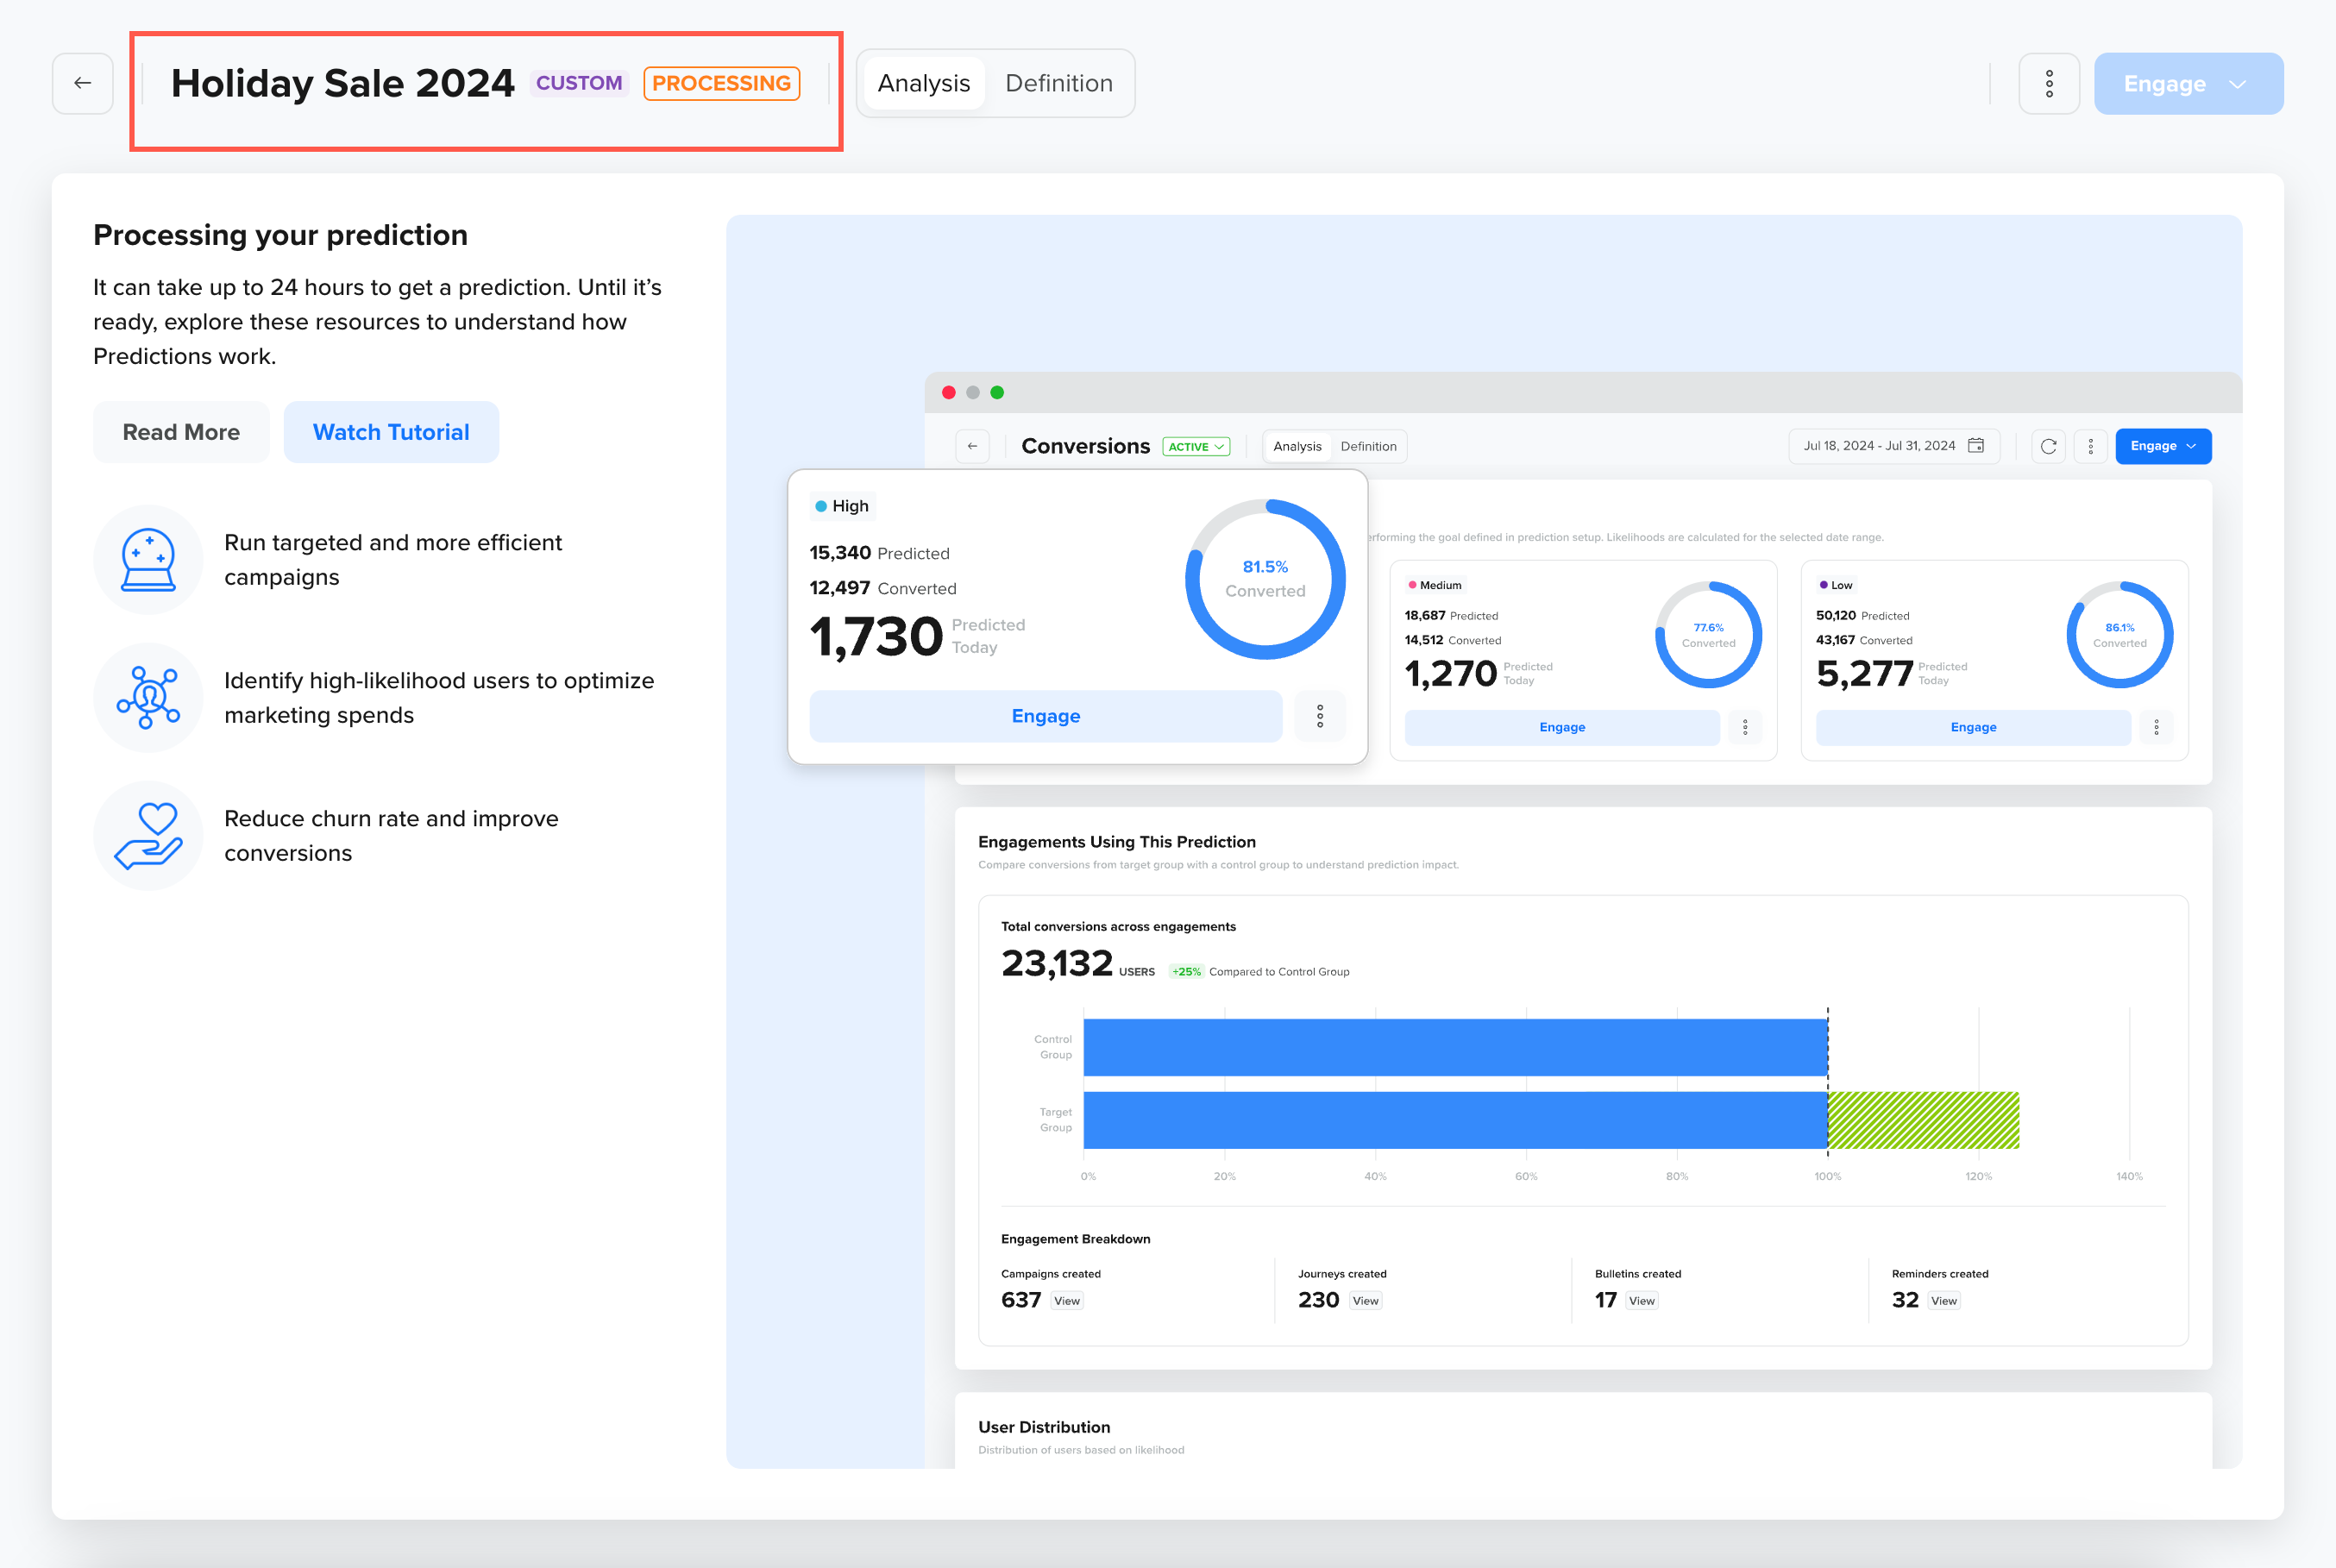
Viewing a Prediction in Processing State
During the Processing state, the system calculates the likelihood of your target users achieving the defined goal and assigns a custom user property in CleverTap. This property is named after the Prediction itself (For example, if your Prediction is named Purchase Likelihood, the custom user property will be Purchase Likelihood.
Each user is then categorized based on their likelihood of achieving the goal, with values set to High, Medium, or Low. These values help you quickly identify users who are more or less likely to complete the desired action, as shown in the illustration below.
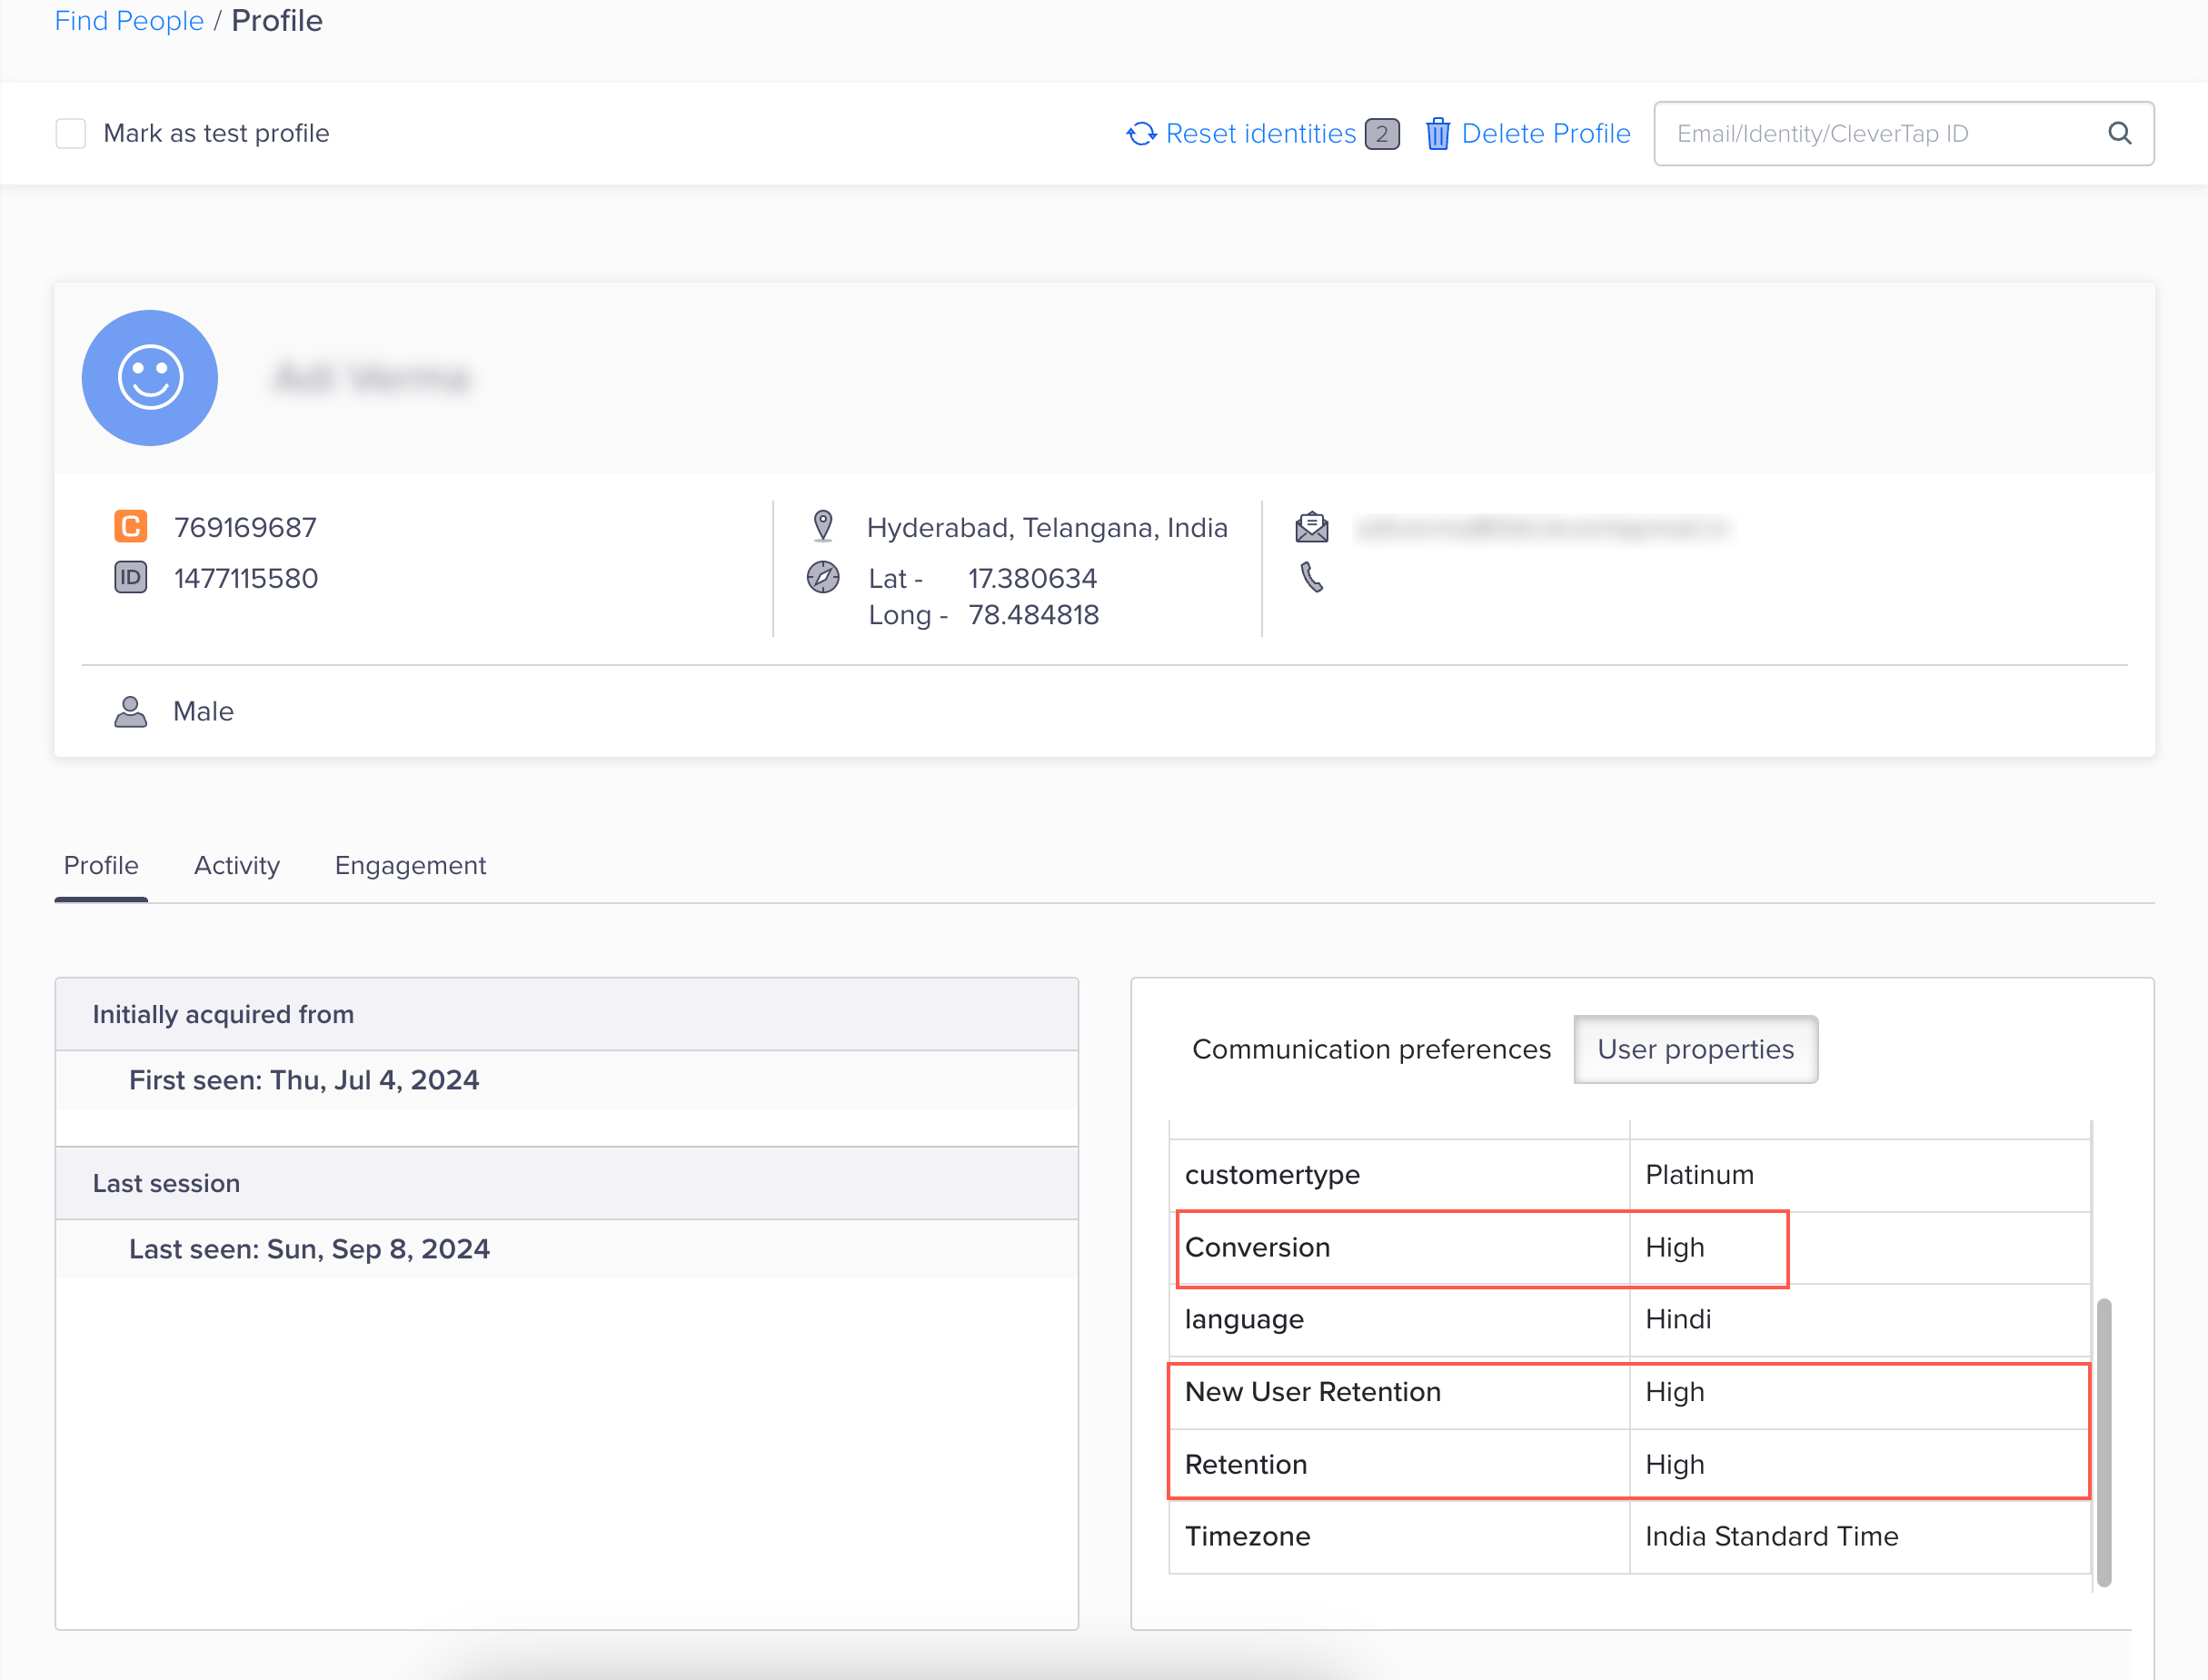
Custom User Property to Denote Likelihood of User
CleverAI processes and refreshes the entire Prediction model every 15 days and the likelihood for your target users every 24 hours. When a user's likelihood changes, an event called Likelihood Change is triggered, capturing the transition.
The Likelihood Change event includes the following properties:
- New Prediction Value
- Old Prediction Value
- Prediction ID
- Prediction Name
You can use CleverTap's Event Analysis feature to view users whose likelihood values have changed.
Analyze a Prediction
By examining the valuable insights generated by the prediction model, you can understand how likely your users are to engage, convert, or churn.
Click the prediction of your interest. A new window displaying the following details opens:
Definition
The Definition tab offers comprehensive details about prediction scope and setup, helping you understand the context of the results.
- Model Accuracy: Displays the accuracy score of the prediction model, such as the AUC score, which indicates how effectively the model predicts user behavior. The accuracy is displayed based on the data available on the last model refresh. You can also view the underlying logic and rationale behind the predictions and edit the prediction directly from this section.
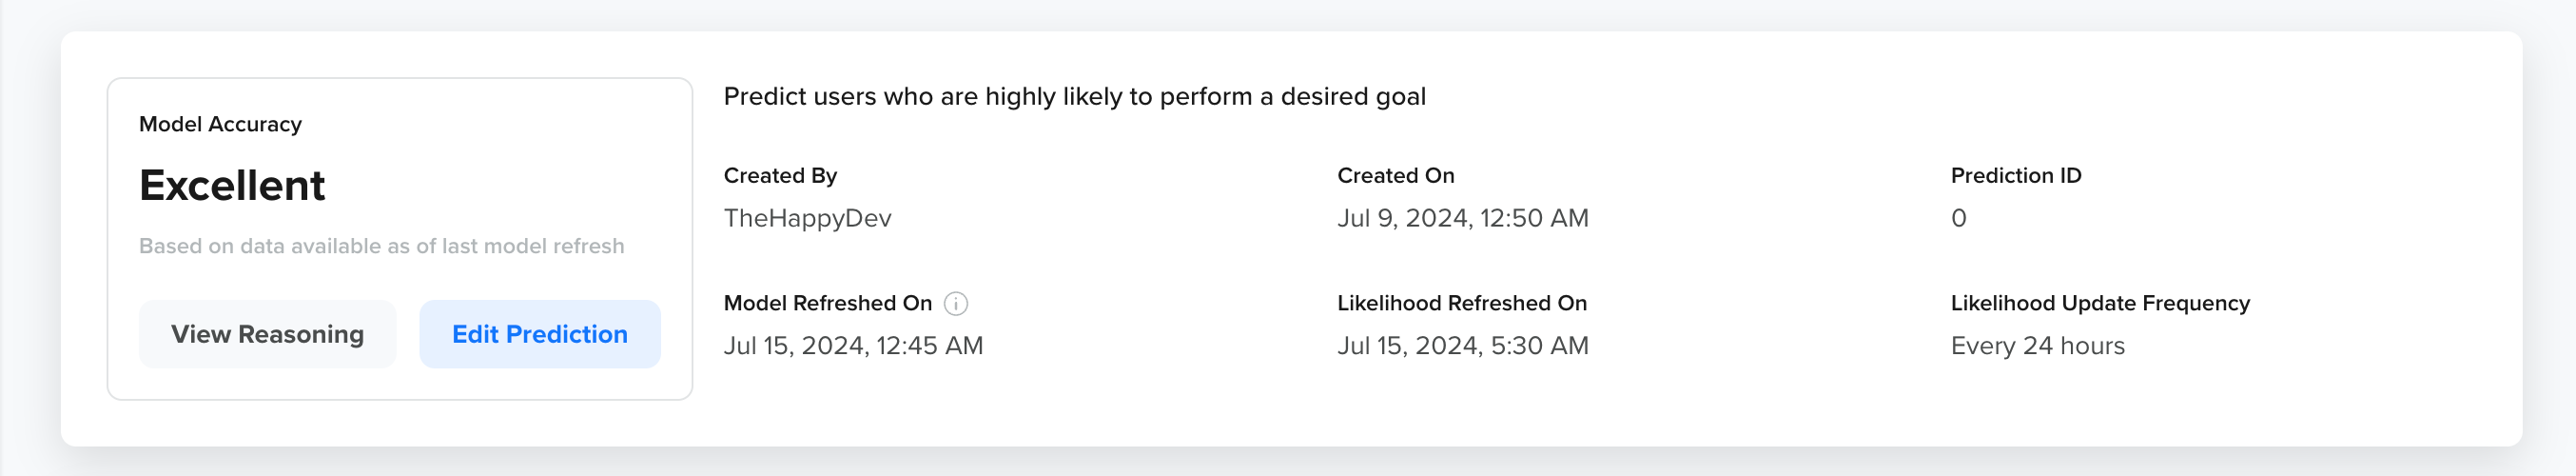
View Model Accuracy and Prediction Details
- Prediction Setup: Provides an overview of the initial prediction setup, including the goal event, additional intelligence added to enhance the model's accuracy, and the target segment.
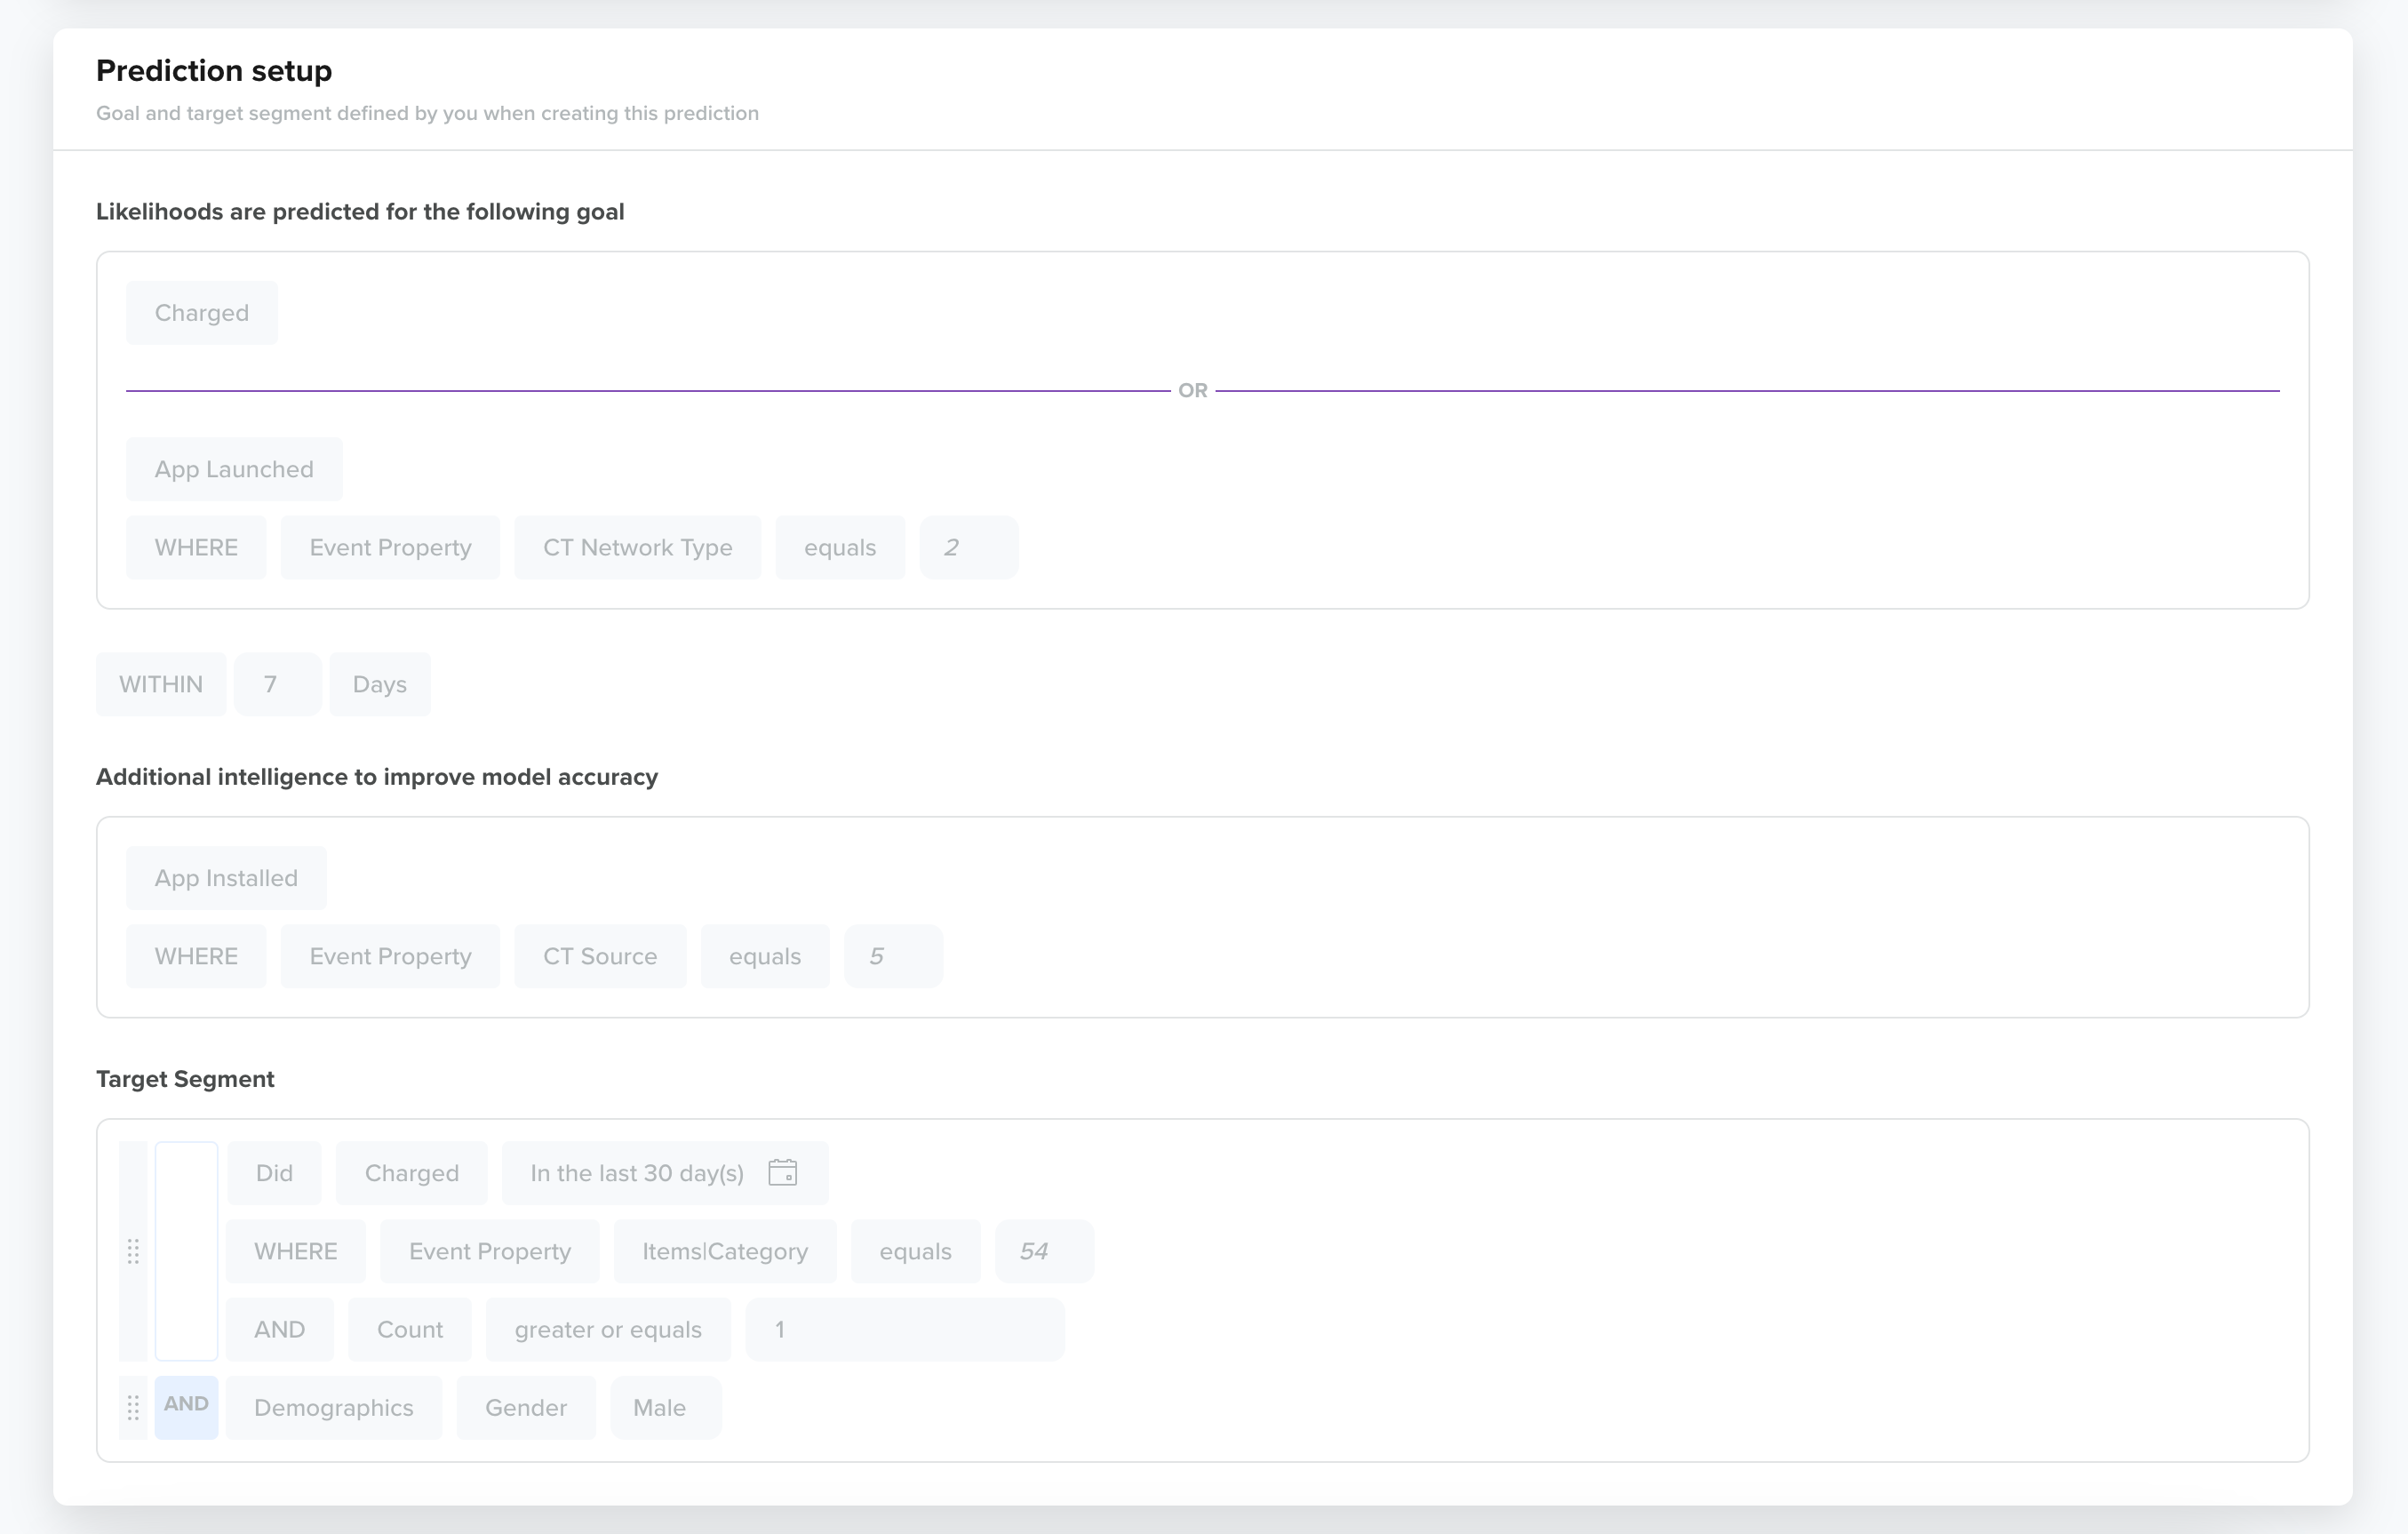
Prediction Setup
View Reasoning
This section shows how the prediction model arrived at its conclusions, detailing the key factors and logic behind the results. It provides transparency into the model’s decision-making process, helping you understand the basis of the predictions.
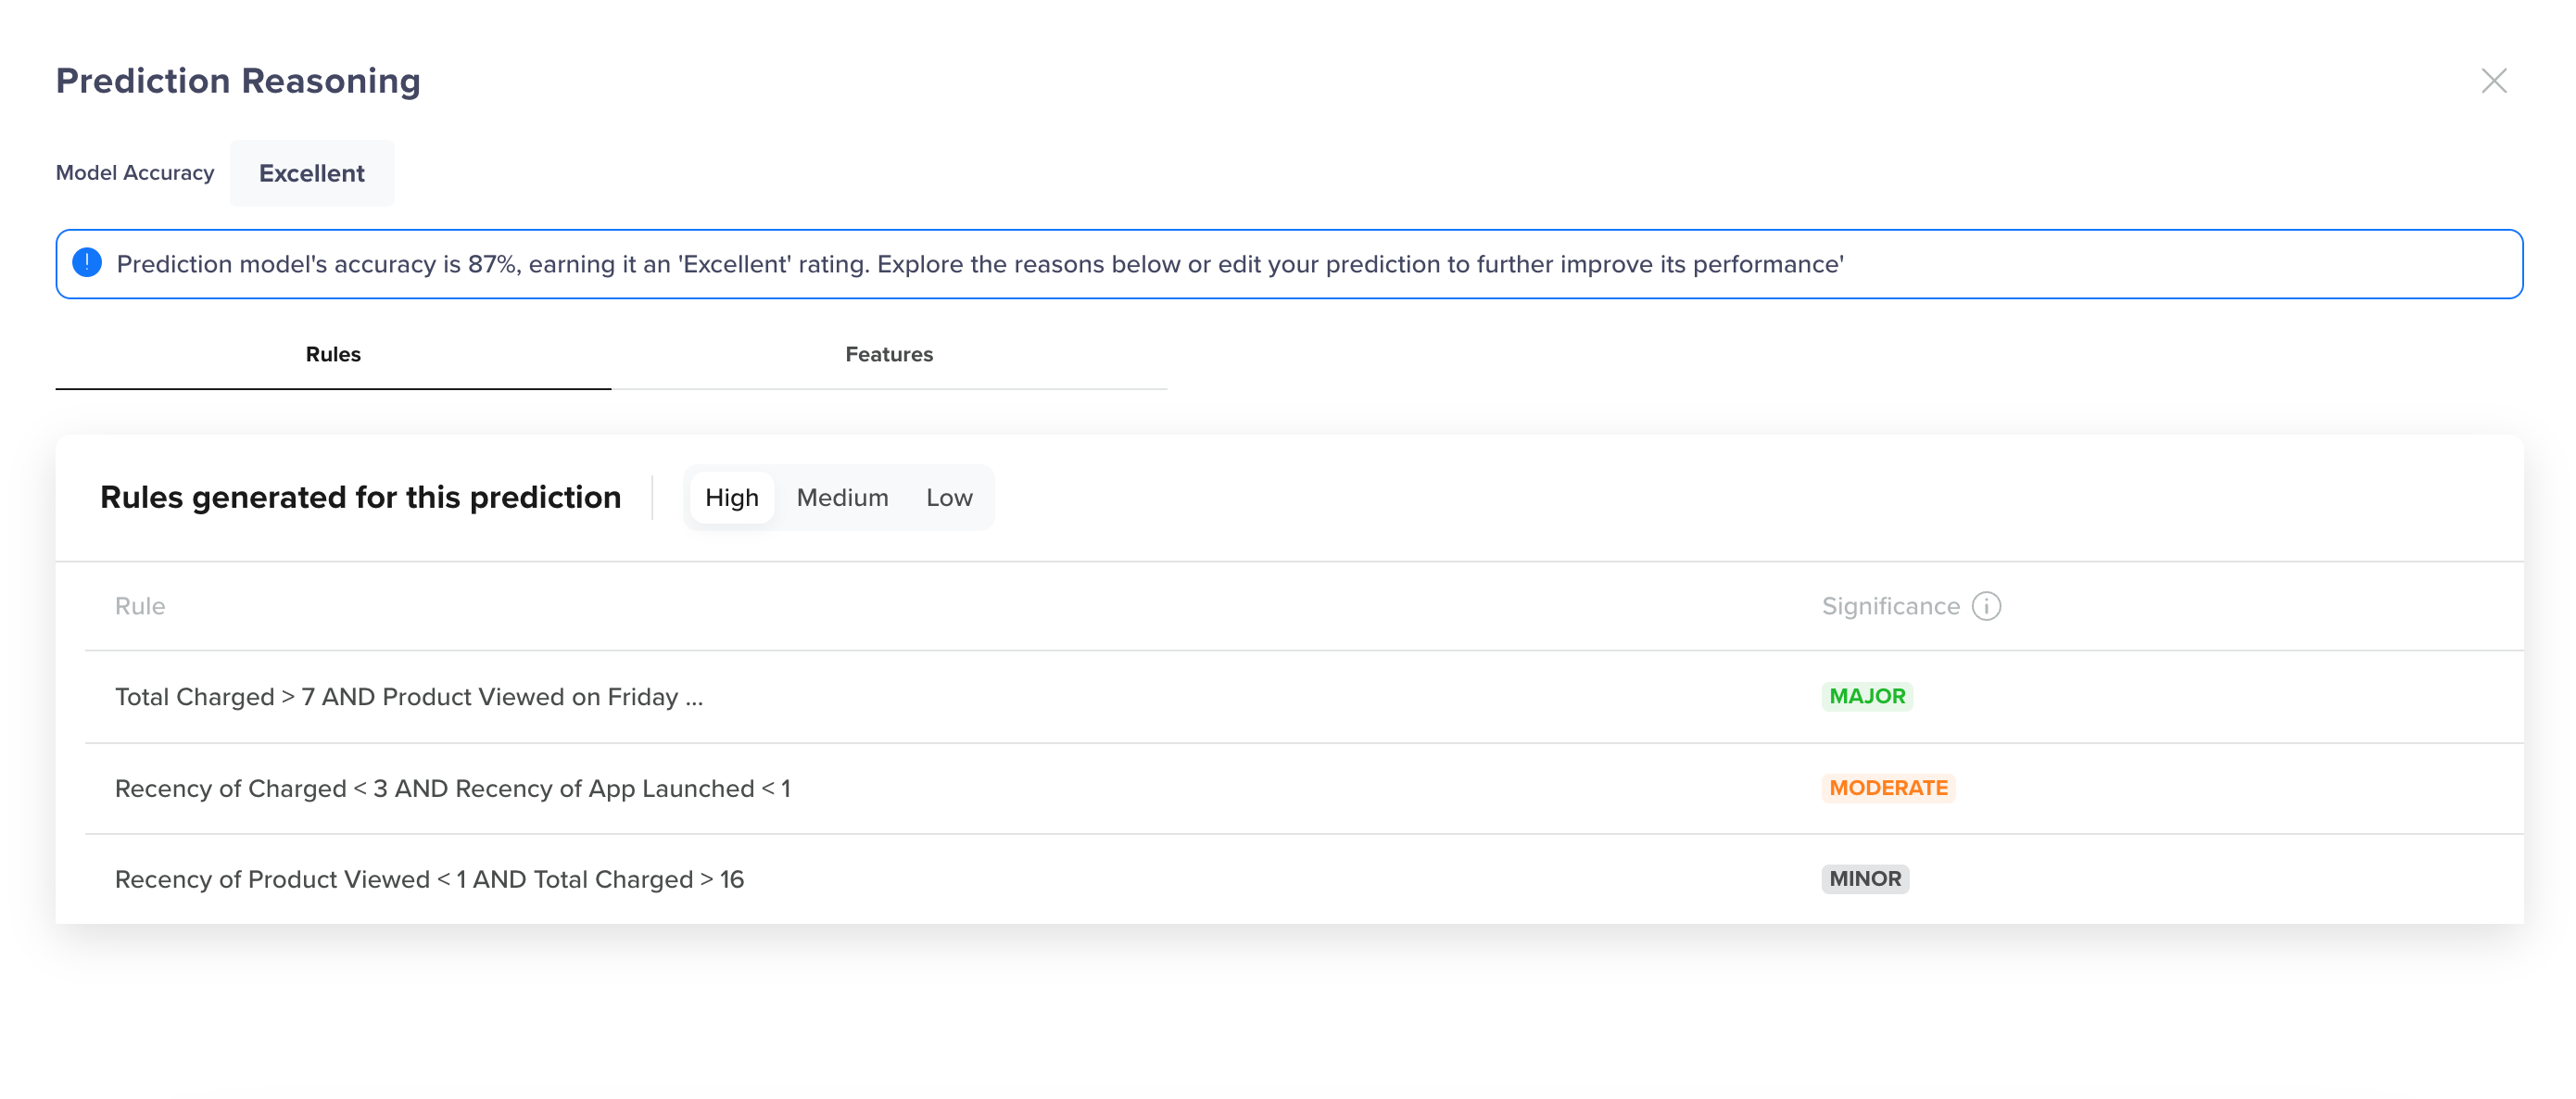
View Prediction Reasoning
The Prediction Reasoning modal displays the following:
- Rules: Lists the top rules used by the prediction model, ranked in the descending order of significance (for example, Major, Moderate, Minor). The significance displayed next to each rule indicates the importance of each rule in the prediction, helping you understand the factors that influence the user behavior most. You can either engage with a rule or view the rule.
- Features: Displays insights into the recency and frequency of user events that contribute to the prediction model. It highlights how recently and how often specific events have occurred, giving you a better understanding of the factors influencing the prediction.
Analysis
The Analysis tab provides key metrics that help you understand the prediction's effectiveness:
User Likelihoods
Users in the target segment are categorized into High, Medium, and Low likelihood groups based on their probability of performing the goal event. These likelihoods are calculated for the selected date range, offering a clear view of user behavior.
- High Likelihood: Users most likely to perform the goal event.
- Medium Likelihood: Users with a moderate chance of performing the goal event.
- Low Likelihood: Users least likely to perform the goal event.
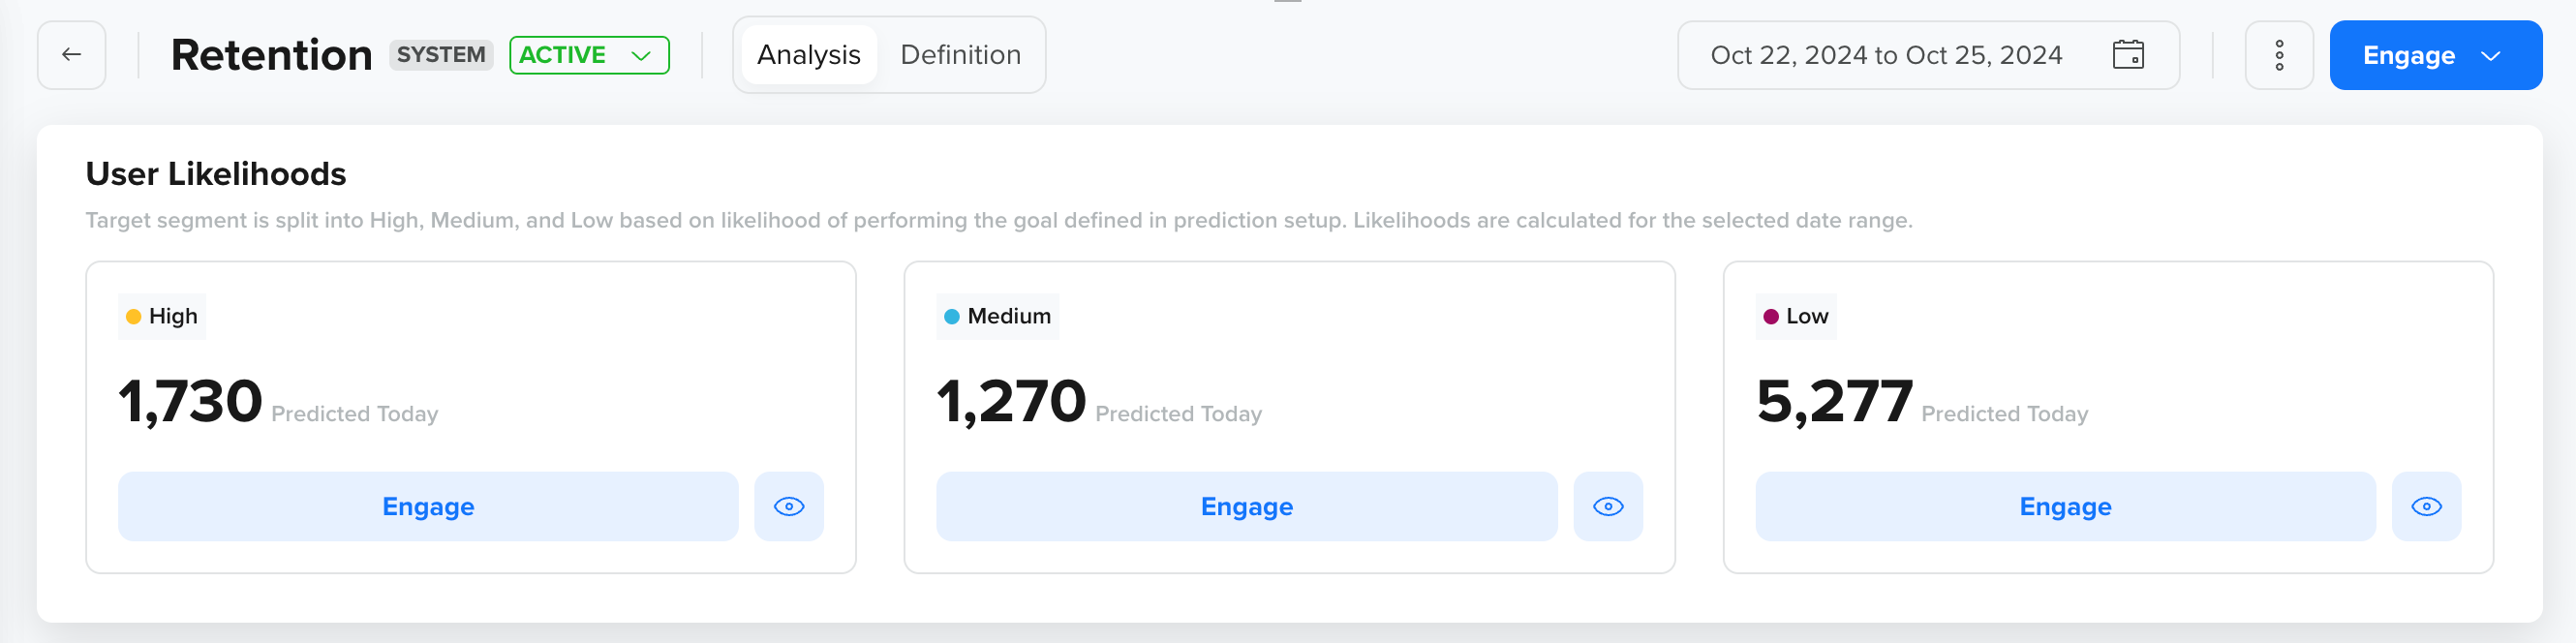
View User Likelihoods
For each likelihood category, the data for the Predicted Today metric, which represents the number of users predicted to perform the goal event, is shown.
Engagements Using This Prediction
This section shows the performance comparison of the target group with a control group to evaluate the prediction's impact on conversions. It always includes the engagement that has used the Prediction in their segmentation.
- Conversion Count: Shows the number of users converted due to these engagements within the selected date range.
- Performance Comparison: Provides a horizontal bar chart comparing the control group's performance against the target group, helping you understand whether the target group performed better, worse, or the same as the control group.
- Engagement Breakdown: Shows the number of Campaigns and Journeys created using the prediction.
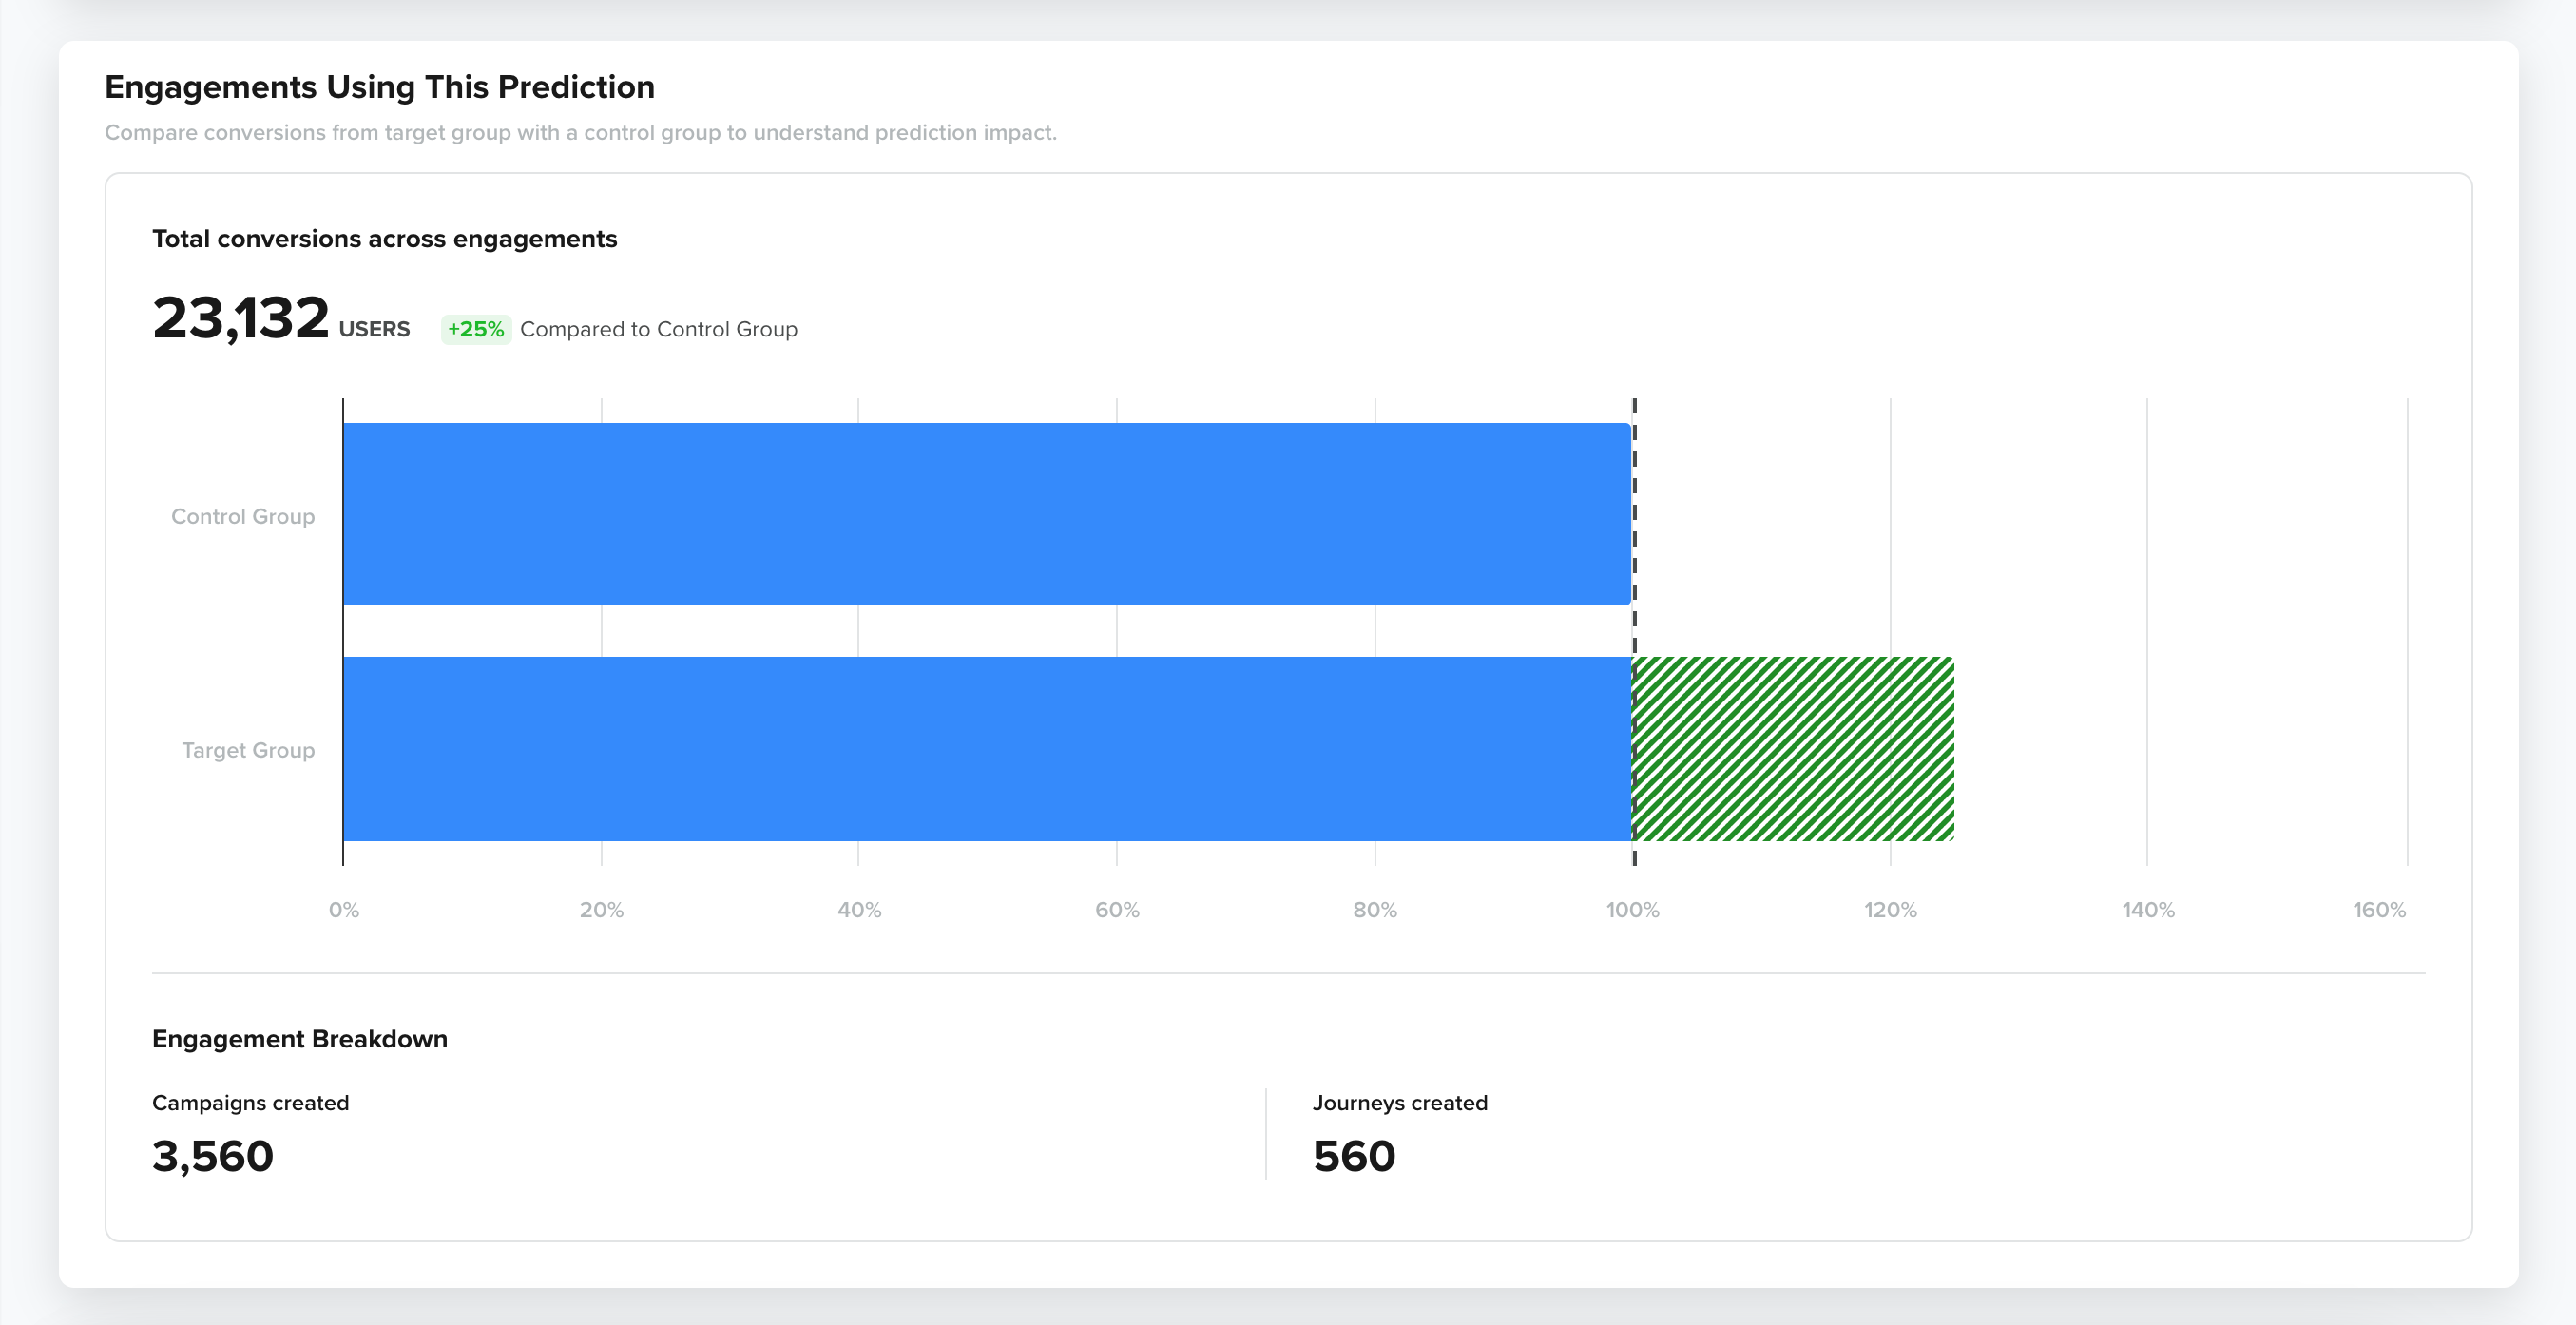
View Engagement Data of a Prediction
User Distribution Trend
This section presents line graphs illustrating the distribution of users in the target segment over time, shown as follows:
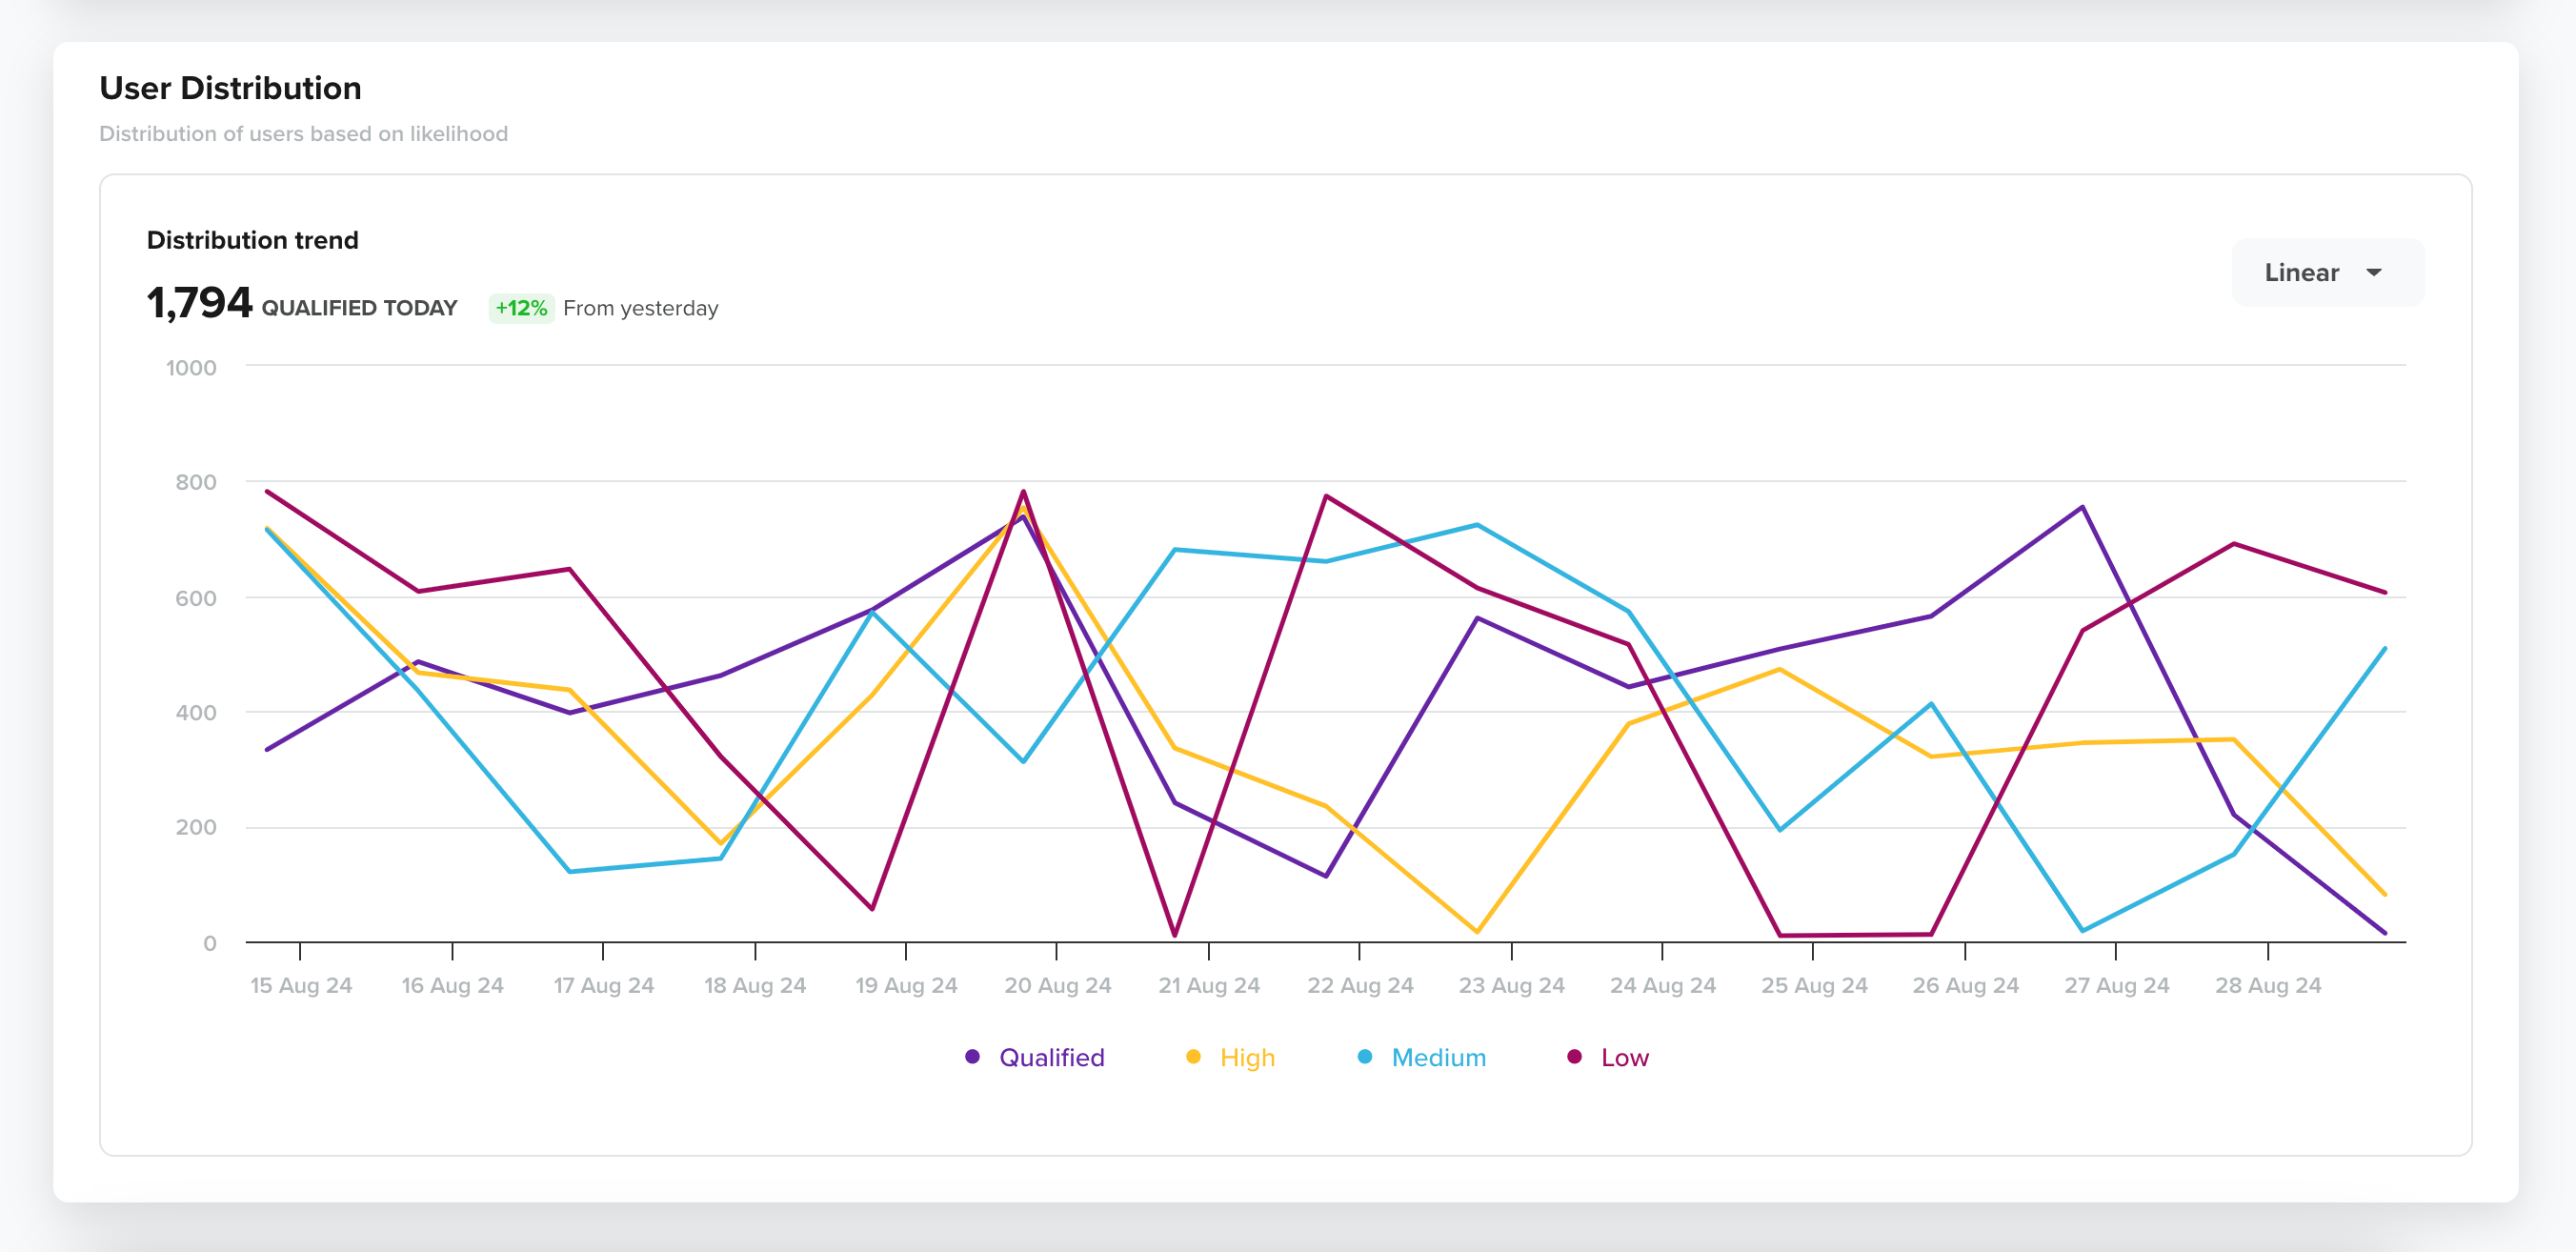
Linear User Distribution Trend
Clicking a particular data point on the line graph displays the following information:
- Likelihood Group
- Date for which the information is displayed
- Number of users with the likelihood to perform a goal event.
- Percentage change in the number of users compared to the previous day.
When you switch the trend to Relative, it displays the data in terms of percentage change or proportion relative to previous days rather than showing absolute values. This provides a clearer view of how user segments are changing over time relative to previous days, allowing for easier comparison across different time periods or segments.
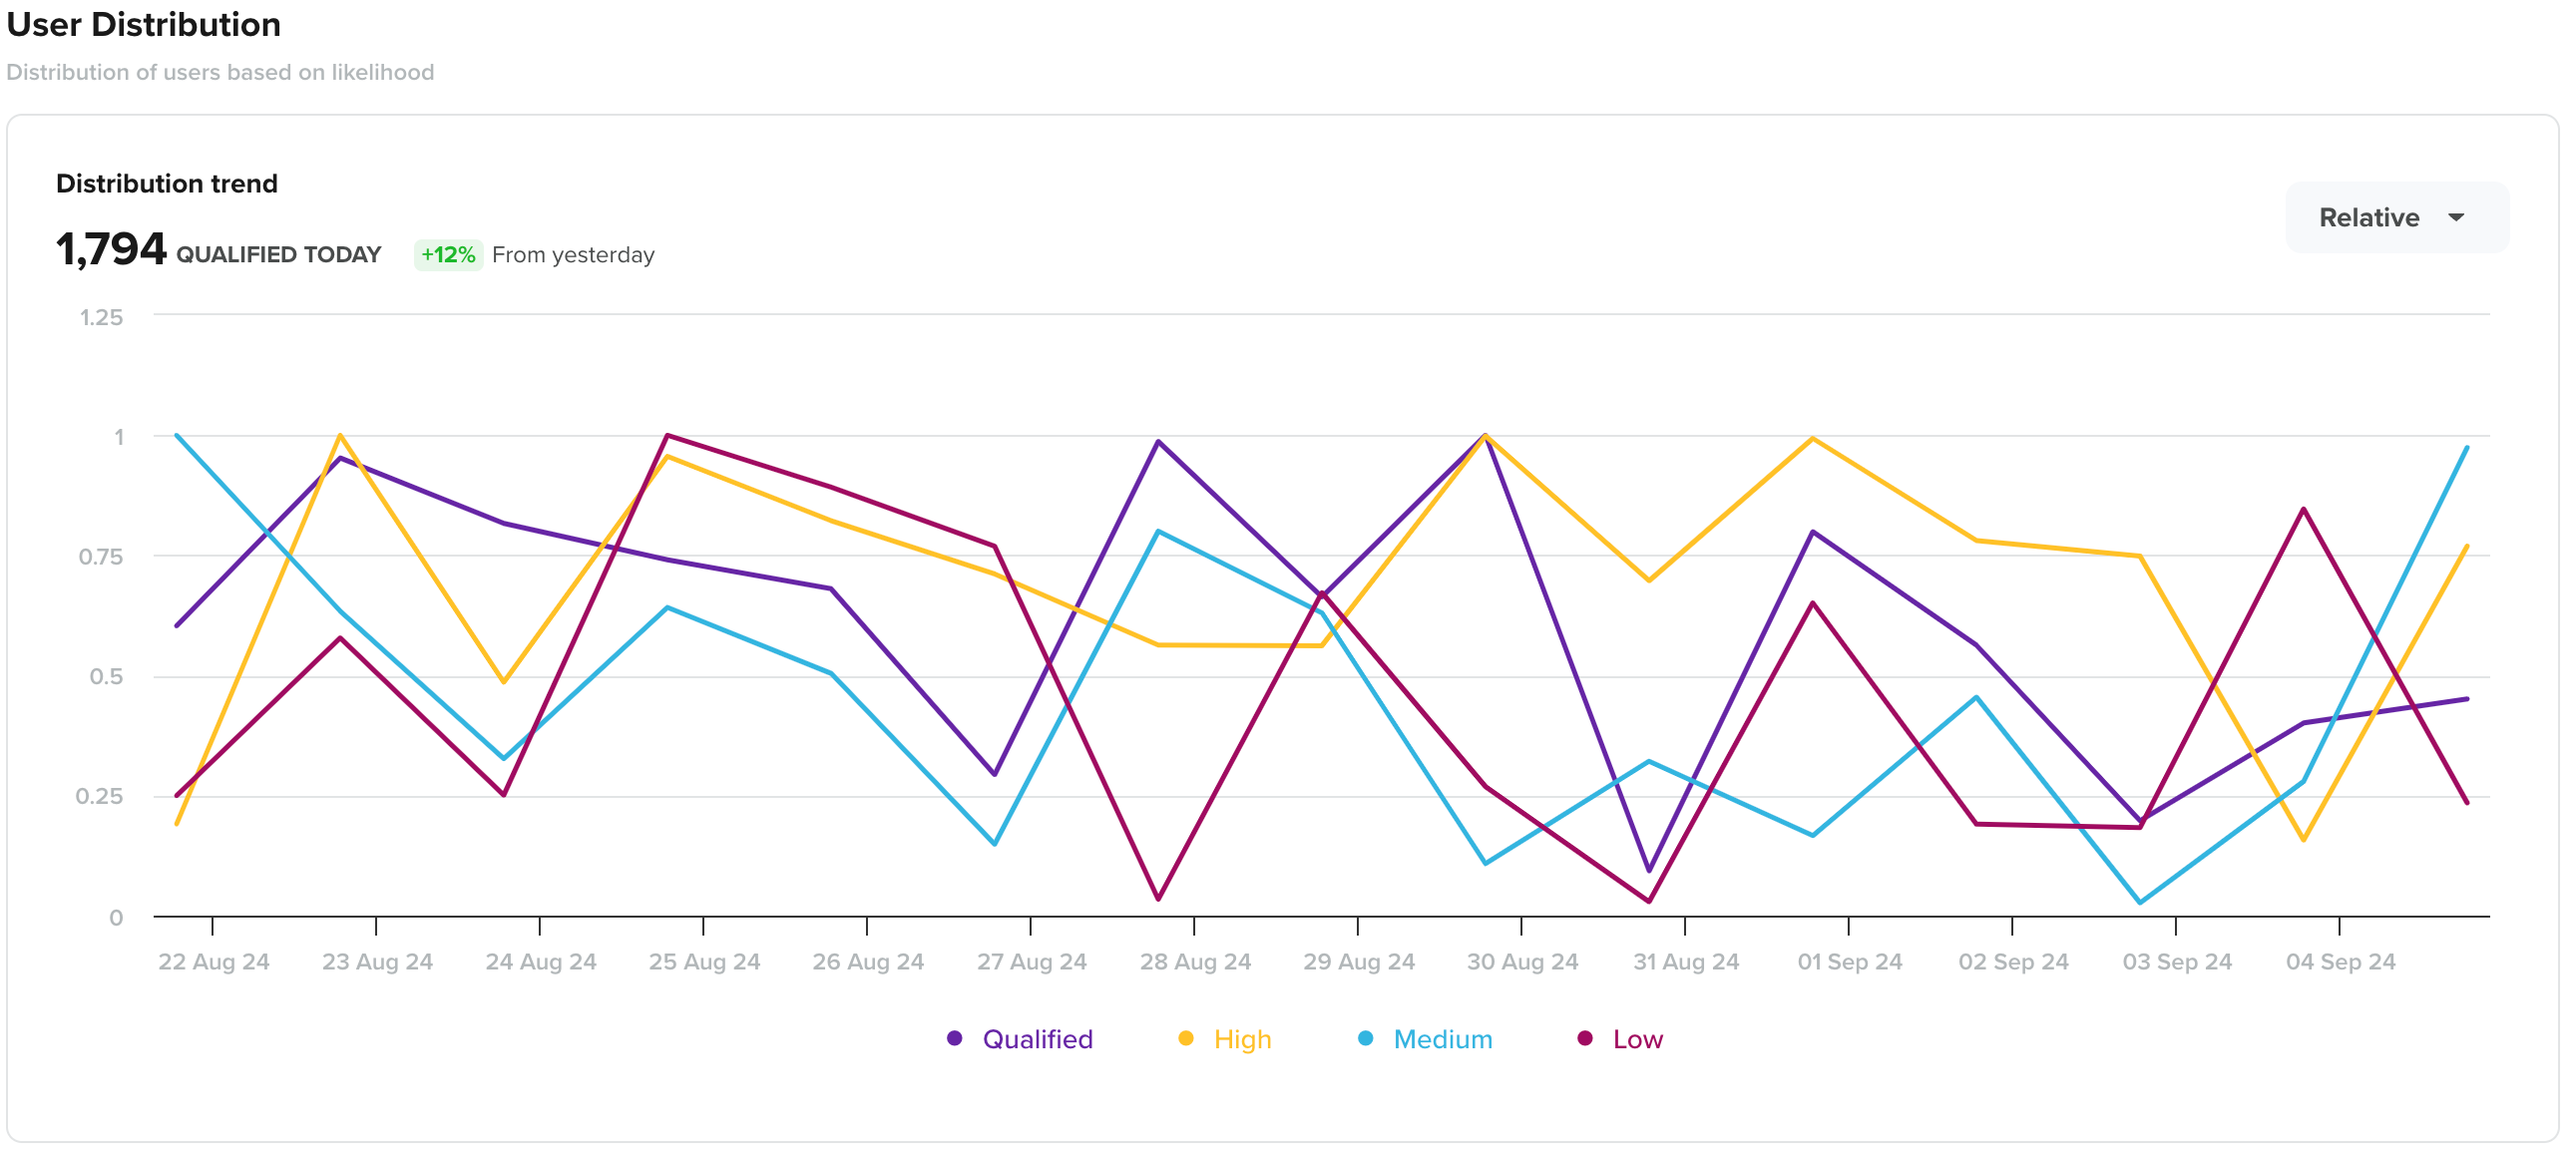
Relative User Distribution Trend
In this way, you gain valuable insights into user behavior, allowing you to improve your marketing strategies. With clear metrics, visualizations, and reasoning, you can effectively target users at the right time, boosting engagement and conversions. Keep monitoring and adjusting your approach with CleverTap's prediction models to make the most of your data, optimize your engagements, and achieve better results.
Updated 4 months ago