Lifecycle Optimizer
Understand how to optimize lifecycle using frameworks, stages, and engagements.
Overview
Mobile marketing platforms often focus on the campaign and journey-level engagement. CleverTap developed the Lifecycle Optimizer to create a view of the entire user base. As the name suggests, CleverTap Lifecycle Optimizer provides you with a guided and end-to-end solution for your retention flow.
Lifecycle optimizer enables you to :
- Define lifecycle stages to understand users.
- Connect with users to influence movement into the next stage.
To move users forward, you can run engagement experiments, measure their impact, and apply the winning variation to all users in a stage to optimize the lifecycle.
The stages for Lifecycle Optimizer are:
- Map users to lifecycle stages based on qualifying actions to understand the entire user base.
- Experiment and iterate with different approaches and roll out the winning Journey.
- Engage users with relevant, timely messages to move them to the next stage
You can choose from two frameworks to achieve your retention goals: AIC or AARRR.
Lifecycle Optimizer Steps
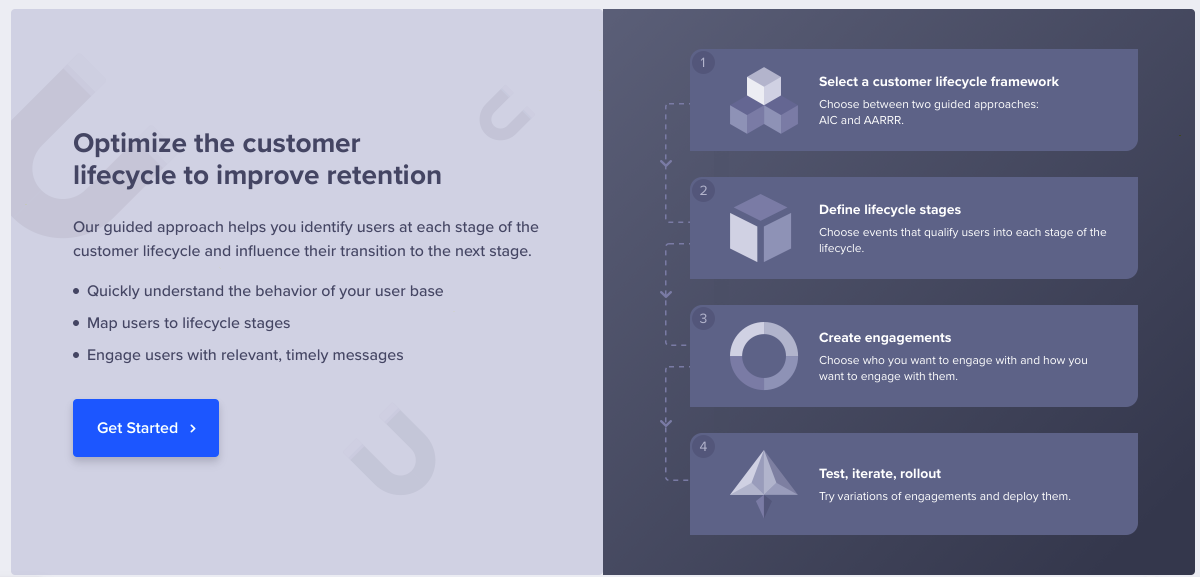
Get Started with Lifecycle Optimizer
The steps to optimize a Lifecycle:
- Setup Lifecycle
- Create Engagement
- Test, Iterate, and Rollout to All Users in a Stage
Current Retention
Let us begin by viewing our current retention. This is a good starting point because it shows the current state of your retention. We can benchmark all our improvements against these statistics.
Select Lifecycle Optimizer from the main dashboard. The key metrics overview displays the current retention state.
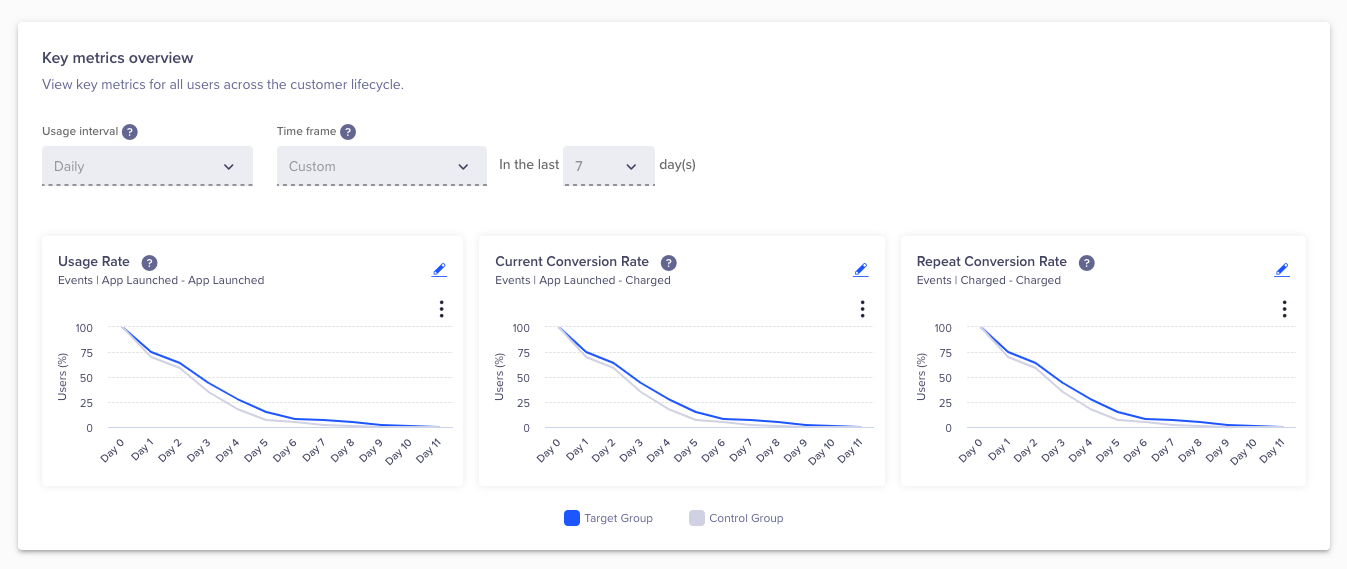
Key Metrics Overview
You will see the following trends with some presets. You can modify these presets by clicking edit![]() .
.
| Trend Name | Events mapped | Description |
|---|---|---|
| Usage Rate | App Launched to App Launched | This indicates the app usage rate. It shows the percentage of active returning users. |
| Current Conversion Rate | App Launched to Charged | This is your current conversion rate. It shows the percentage of active users who converted. |
| Repeat Conversion Rate | Charged to Charged | This is your repeat conversion rate. It is the percentage of active users who converted again. |
Setup Lifecycle
To set up a lifecycle model:
Select Framework
Select a framework and click Next.

Customer Lifecycle Framework
AIC Framework
Brands that choose the AIC framework tend to focus on the type of user actions. The core action or conversion event represents the most desirable user action and is generally used by Social Networking or Ad-based apps.
This is a 3-stage customer lifecycle framework.
| Sequence | Stage | Indicative User Events | User Insight |
|---|---|---|---|
| 1 | Acknowledge | App open | Action, low intent |
| 2 | Interest | Search, add to cart, share app, and so on. | Investment in the app experience |
| 3 | Convert | Book ride, post message, create board, and so on. | Complete core action |
NoteThis table is indicative. You can edit this stage with data points within the framework to suit your business needs.
AARRR Framework
The acronym AARRR stands for Acquisition, Activation, Retention, Referral, and Revenue.
The AARRR framework is based on customer lifecycle stages. You choose this framework if you look at users and their progression through defined stages to view clear revenue conversion events, and is generally used by eCommerce and Travel apps.
This is a 5-stage customer lifecycle framework.
| Sequence | Stage | Indicative User Events | User Insight |
|---|---|---|---|
| 1 | Acquisition | App open | Trackable acquisition event in CleverTap |
| 2 | Activation | Register, likes, board created | Action that indicated likely continued app use |
| 3 | Retention | Pin, wishlist, add to cart, view product | Core app activity, inherent to the app’s purpose |
| 4 | Revenue | Purchase, subscribe | Revenue metrics |
| 5 | Referral | Share content, invite to app, add rating | Indicates advocacy |
NoteThis table is indicative. You can edit any stage within the framework to suit your business needs.
Define Lifecycle Stages
Here you choose events that qualify users for each stage of the lifecycle. You can choose multiple events. Events are considered from the latest step.
AIC Events
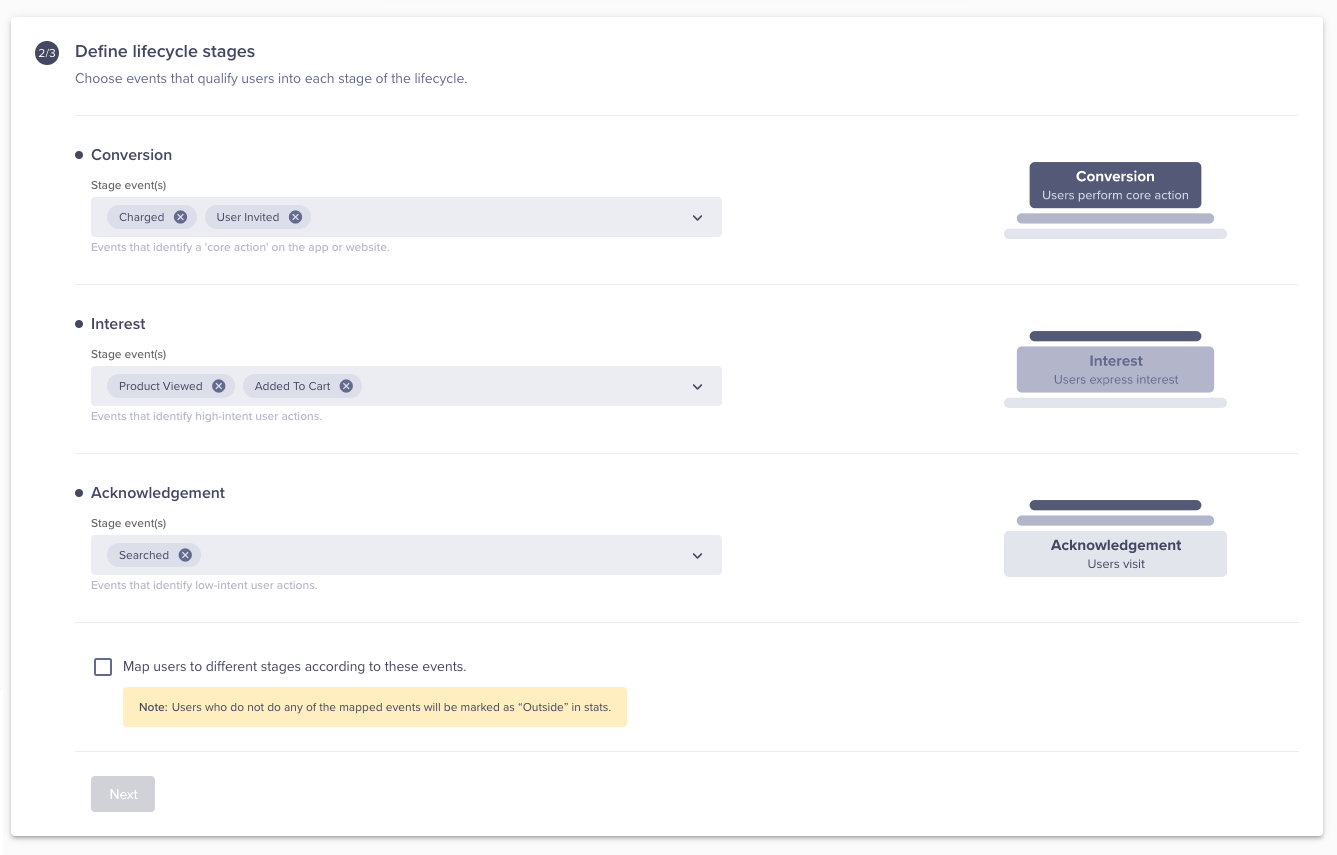
Define Lifecycle Stages
AARRR Events
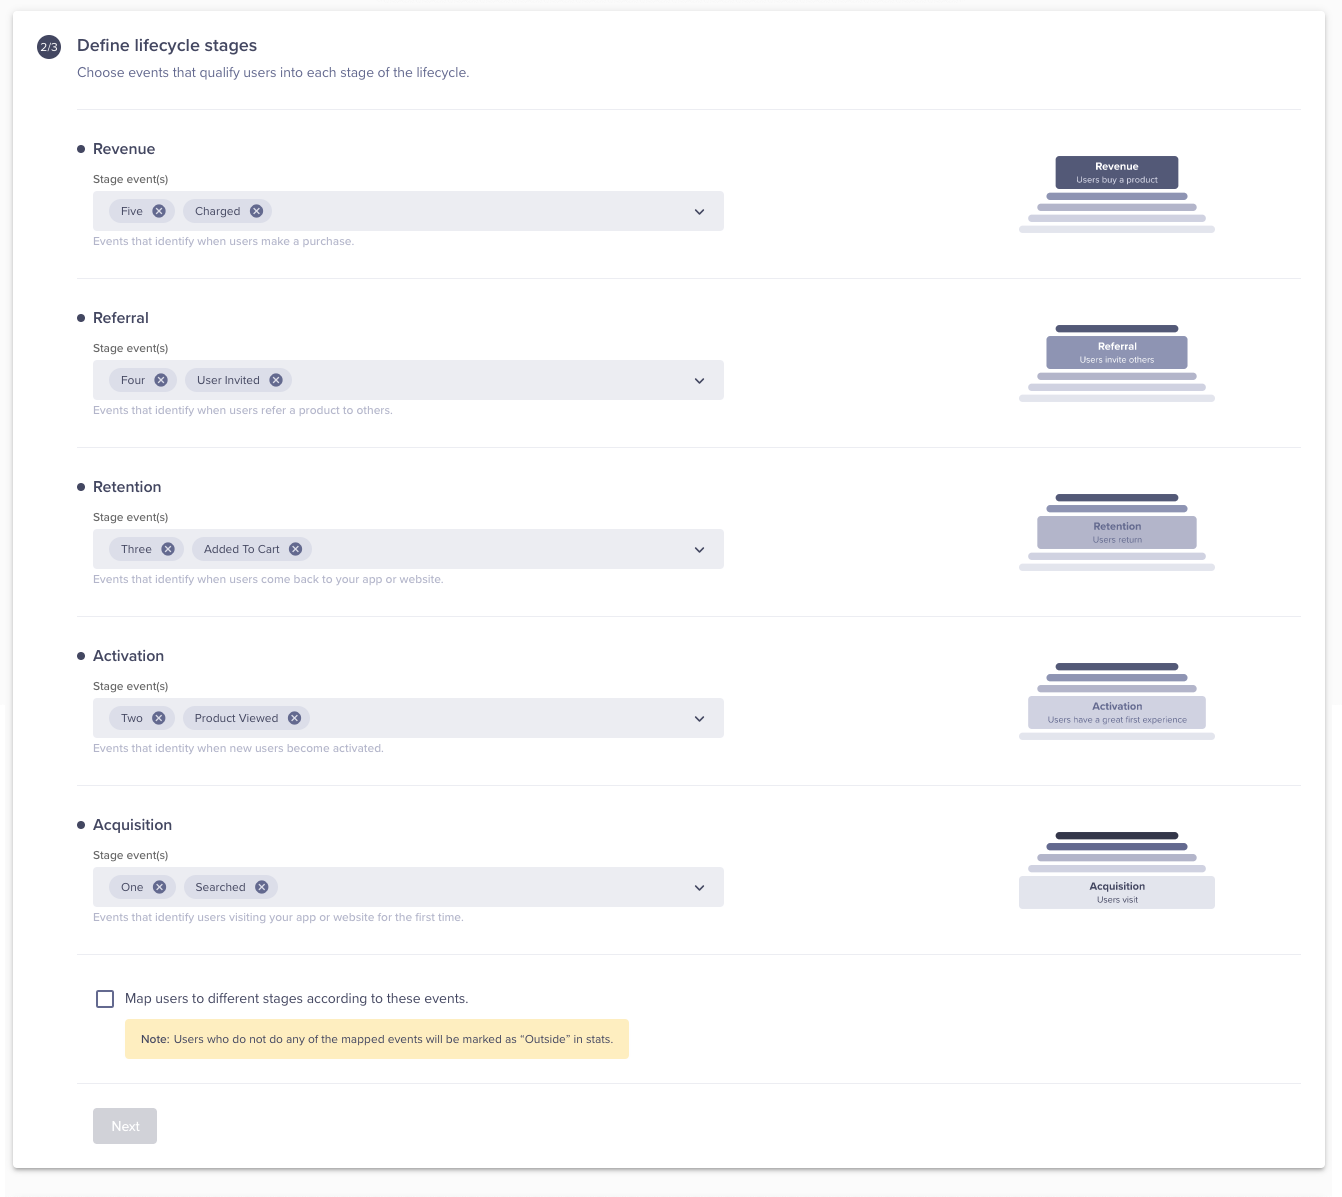
Define Lifecycle Stages
Choose Preferred Values
The preferred value is the time period on which your model is based. The default value is 12 weeks. This period can be edited. However, changing this default value will also change the model accordingly.
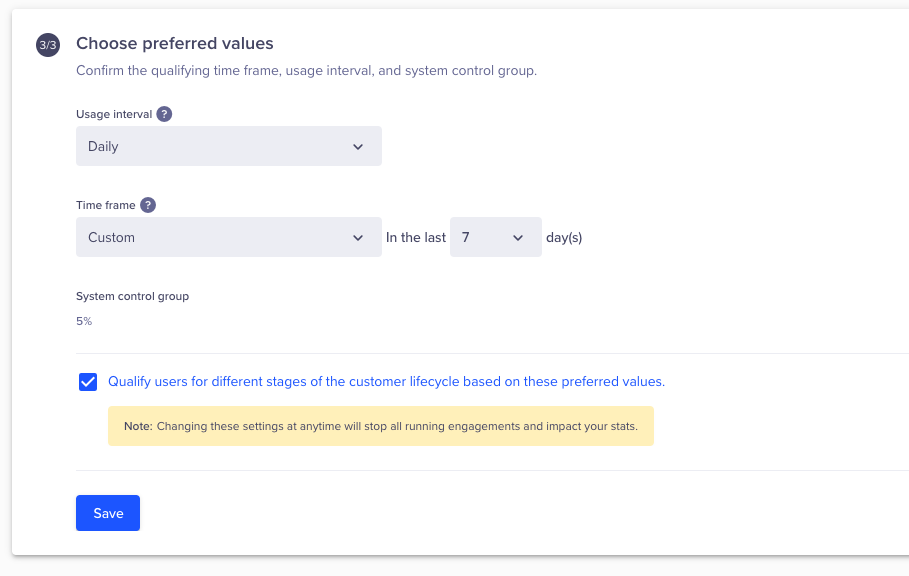
Preferred-Value for Lifecycle Optimizer
Select "Qualify users for different stages of customer lifecycle based on these preferred values" and save the setup.
You can save the model as a draft or click Publish to publish the model.
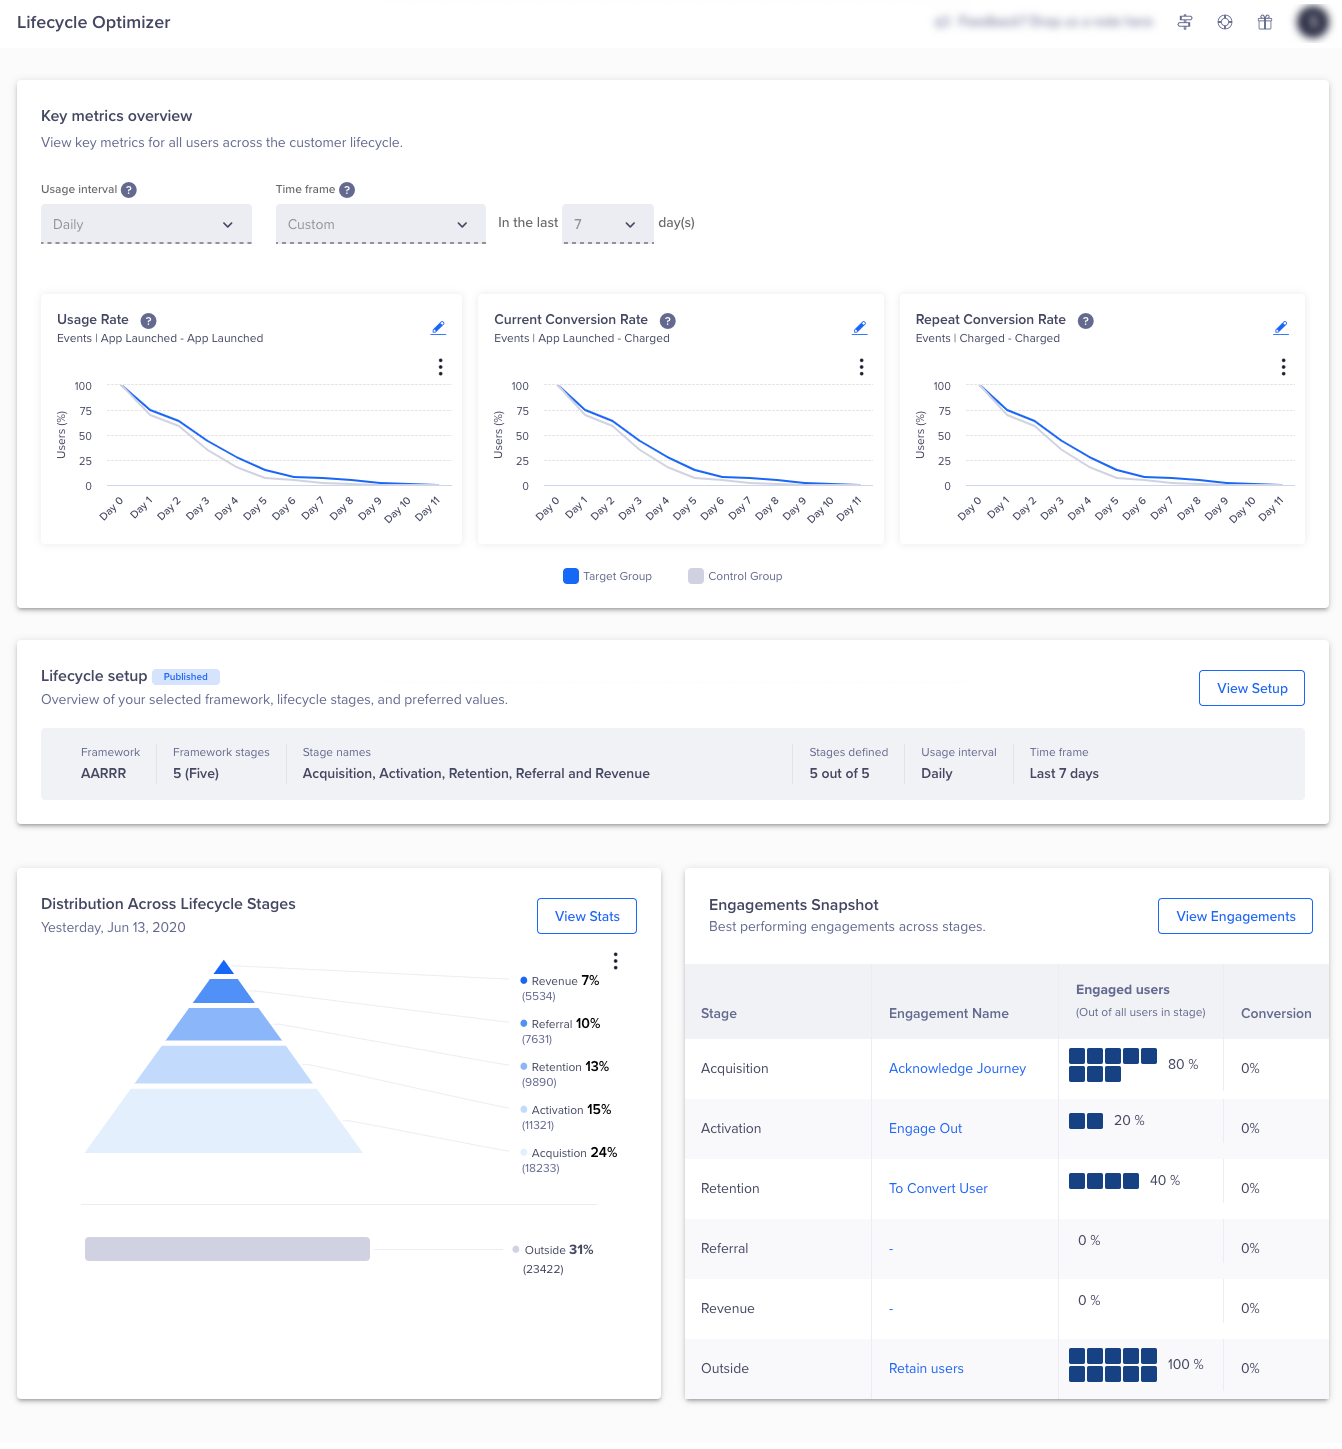
Lifecycle Optimizer Dashboard
Setup Lifecycle
Lifecycle Optimizer Steps
Create Engagement
You can create engagement tailored to each stage.
- Select Lifecycle Optimizer.
- Under Engagement Snapshot, click View Engagements.
The Engagements page appears.
You can create engagement for your model from this page.
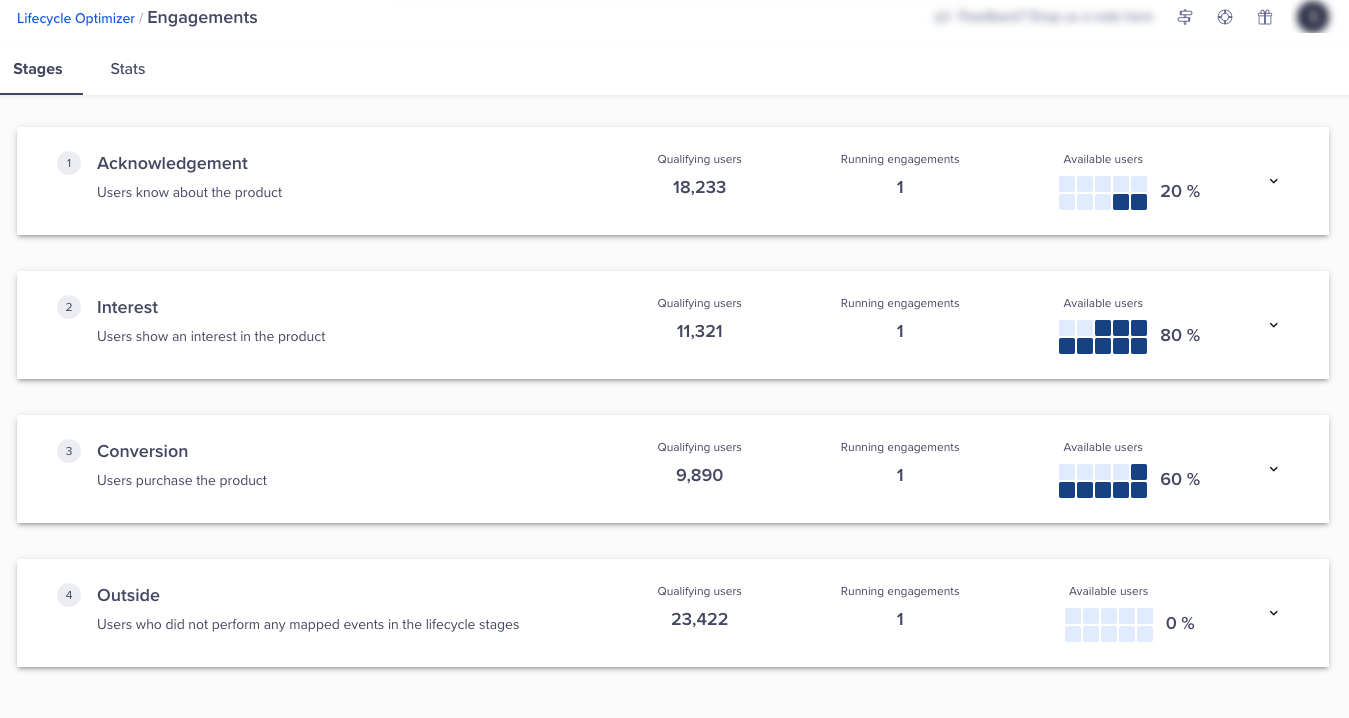
Create Engagement for Each Stage of the Lifecycle
Define Engagement
Define your engagement and roll it out to the selected percentage of users.
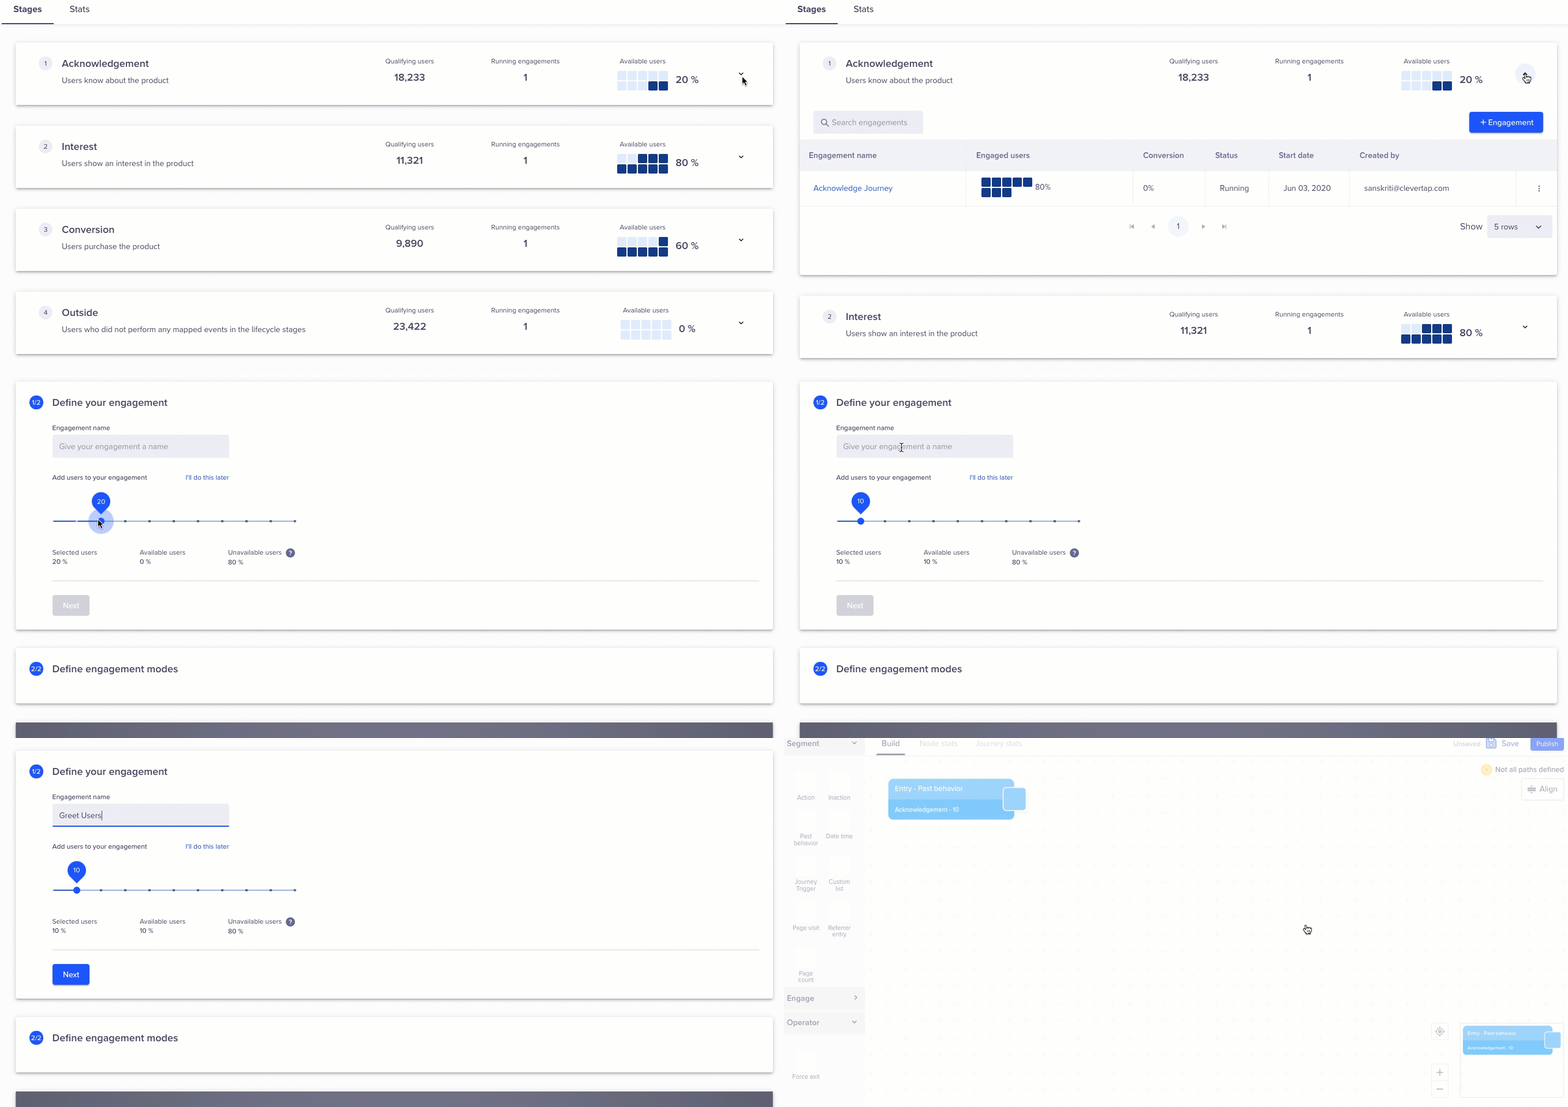
Define Engagement
TipRoll out this engagement to all users if you are confident that your engagement does not need improvement. However, if you wish to experiment first, you can experiment with a selected percent of users and then view the results. Rollout the engagement to all users if the results are satisfactory. Else, repeat the experiment.
Define Engagement Modes
Create a Journey to engage your users in the selected stage. For example, create a Journey to onboard all your new users. To learn more, refer to Journeys.
After you create your Journey, you can save it as a draft or publish it.
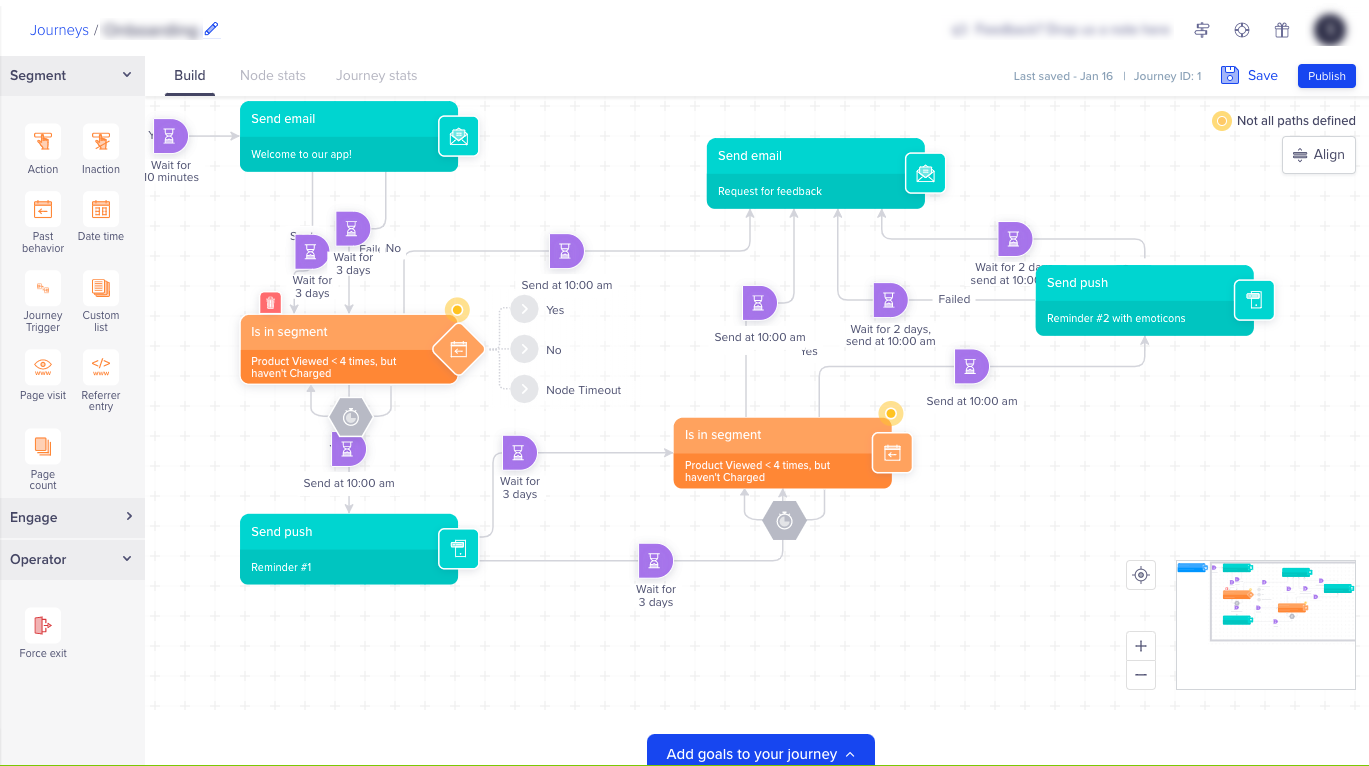
Create a Journey
The journey operations available are:
- Edit - You can edit a current Journey.
- Stop - You can stop a Journey. However, a stopped Journey cannot be restarted.
- Rollout to all users - If you are experimenting with a Journey and the results are good, then you can roll out the Journey to all of your users.
To learn more, refer to Journey Operations
Journey Considerations
- Entry node is populated with the % of users in the stage.
- Goals are populated with the qualification to a higher lifecycle stage.
For instance, if you're creating engagement in the acknowledgment stage, then the interested or converted
users who move to the next stage. - System Control Group cannot be changed
Engagement Stats
Click View Stats to view the engagement statistics.
- Distribution Across Lifecycle Stages
shows the current percentage of users across the Lifecycle Stages.
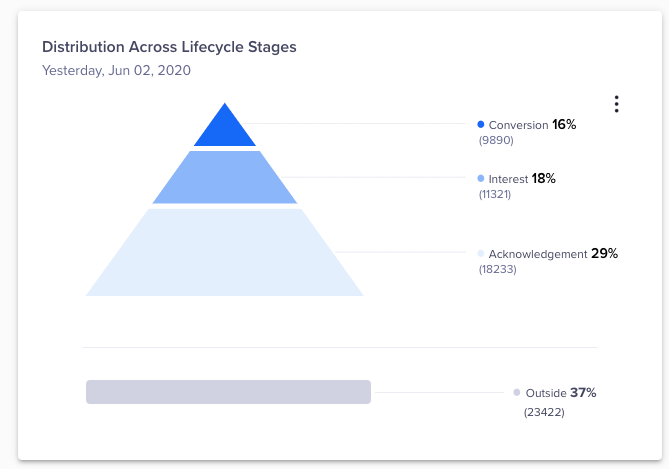
Engagement Statistics
- Change Over Time
Shows the differential change in each stage.
For example, if the Interest stage shows the user count at 17.41% on June 1st and 18.04 % on June 2nd, then
the differential increase in user interest is : (18.01 - 17.41) / 17.41 = 3.33%.
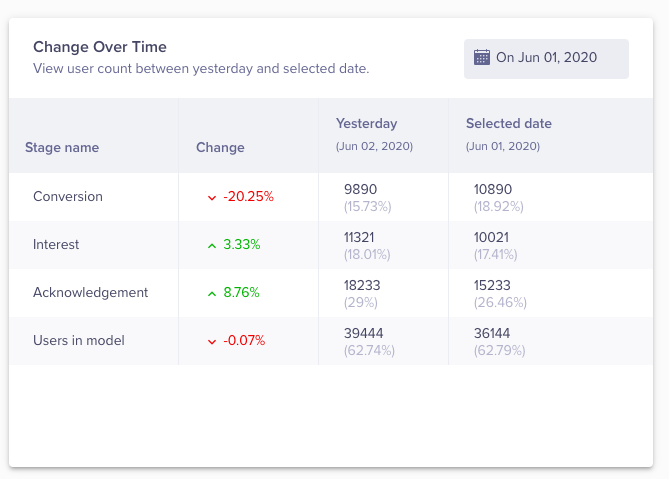
User Change Over Time
- Inter Stage Transition
shows how the users transitioned to a particular stage from each of the Lifecycle stages.
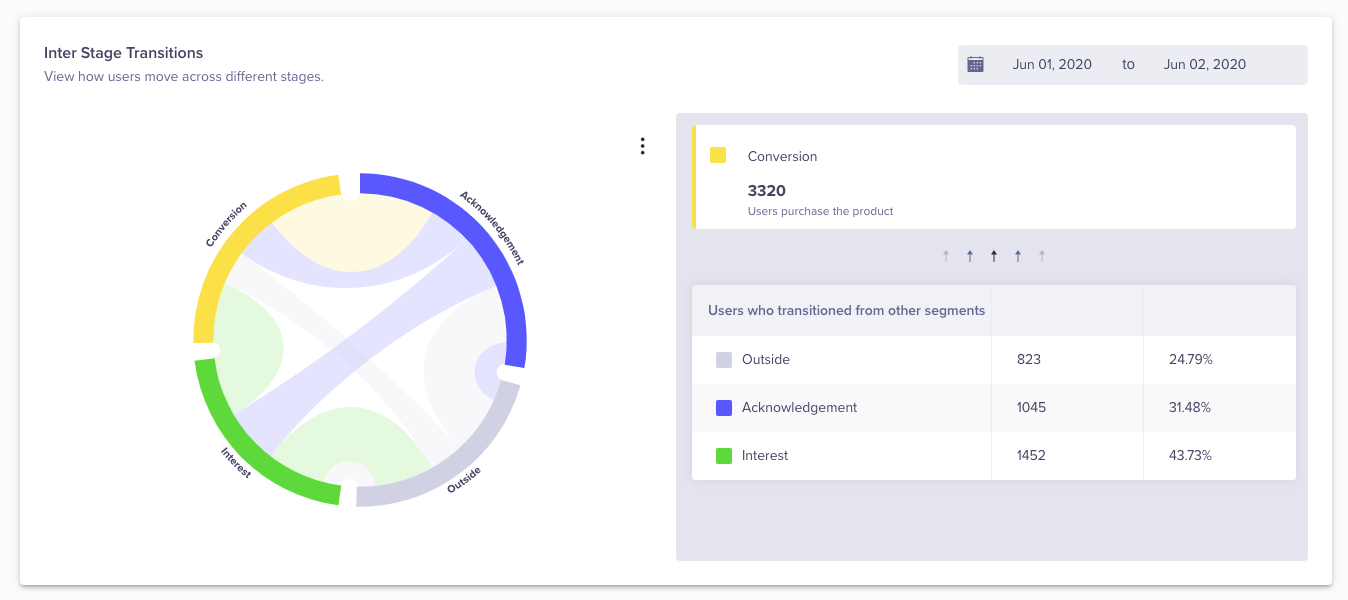
Inter Stage Transition of Users
NoteHover over a stage in the chord diagram to see the user transitions.
- Into a stage trend
Shows the trend of users who transitioned from other stages into the selected stage.
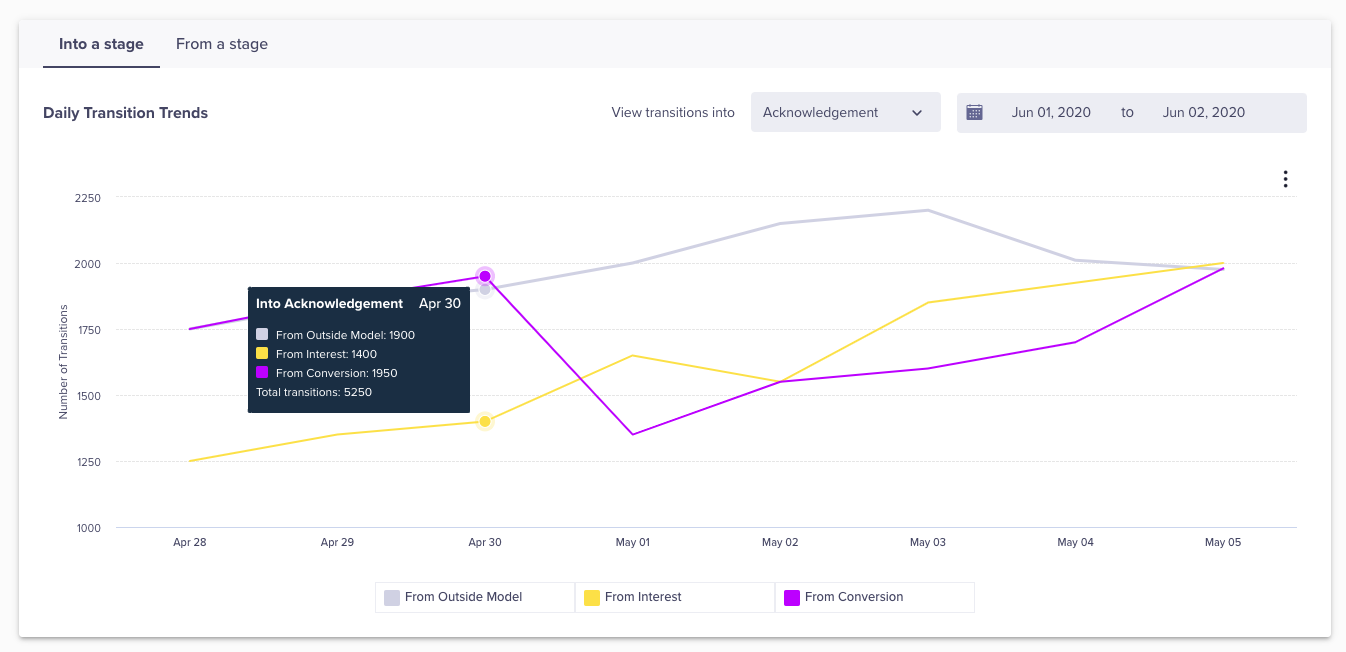
Daily User Transition Trends From Other Stages into the Selected Stage
- From a stage
Shows the trend of users who transitioned to other stages from the selected stage. If the model is set up
optimally, the users must transition from a lower stage to a higher stage.
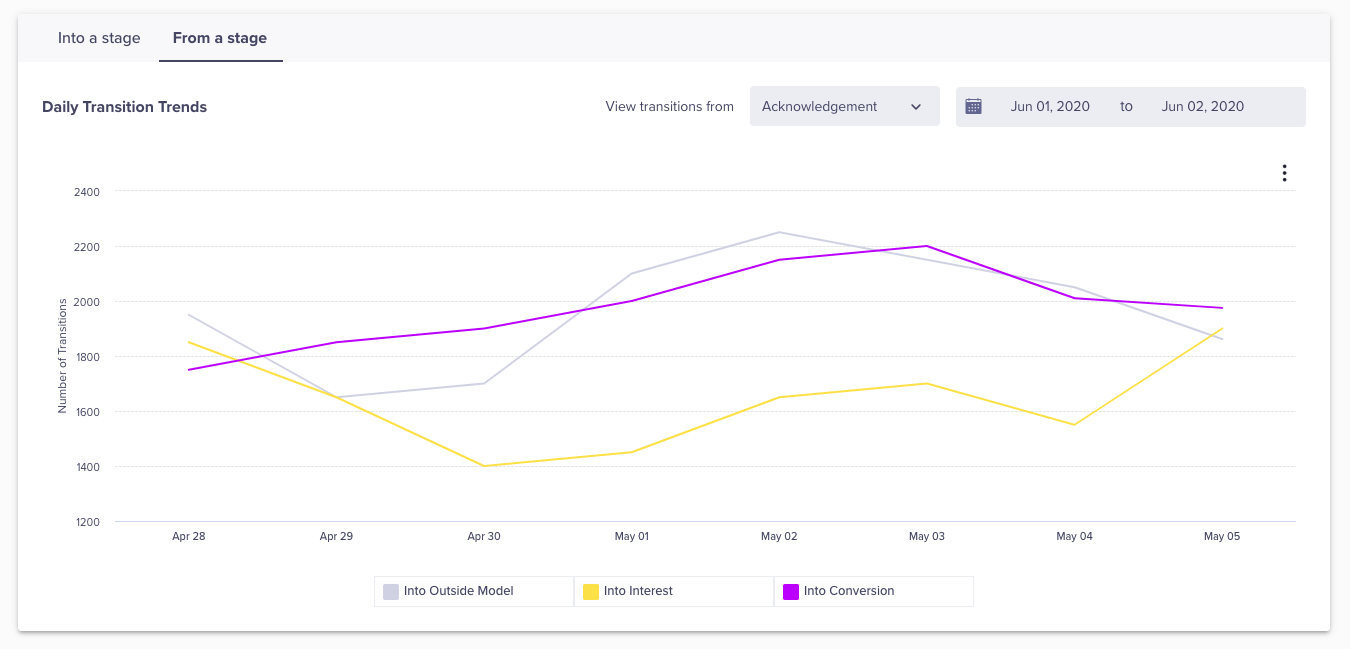
Daily User Transition Trends From Selected Stage into the Other Stages
Video Tutorial
For further information, you can watch the following video on lifecycle optimizer:
By leveraging the Lifecycle Optimizer, you can segment users and create personalized campaigns. Learn more about maximizing engagement at each stage of the customer journey to improve Customer Lifetime Value (CLV). You can also calculate the customer lifetime value using the CLV formula to boost retention.
Updated about 2 months ago
