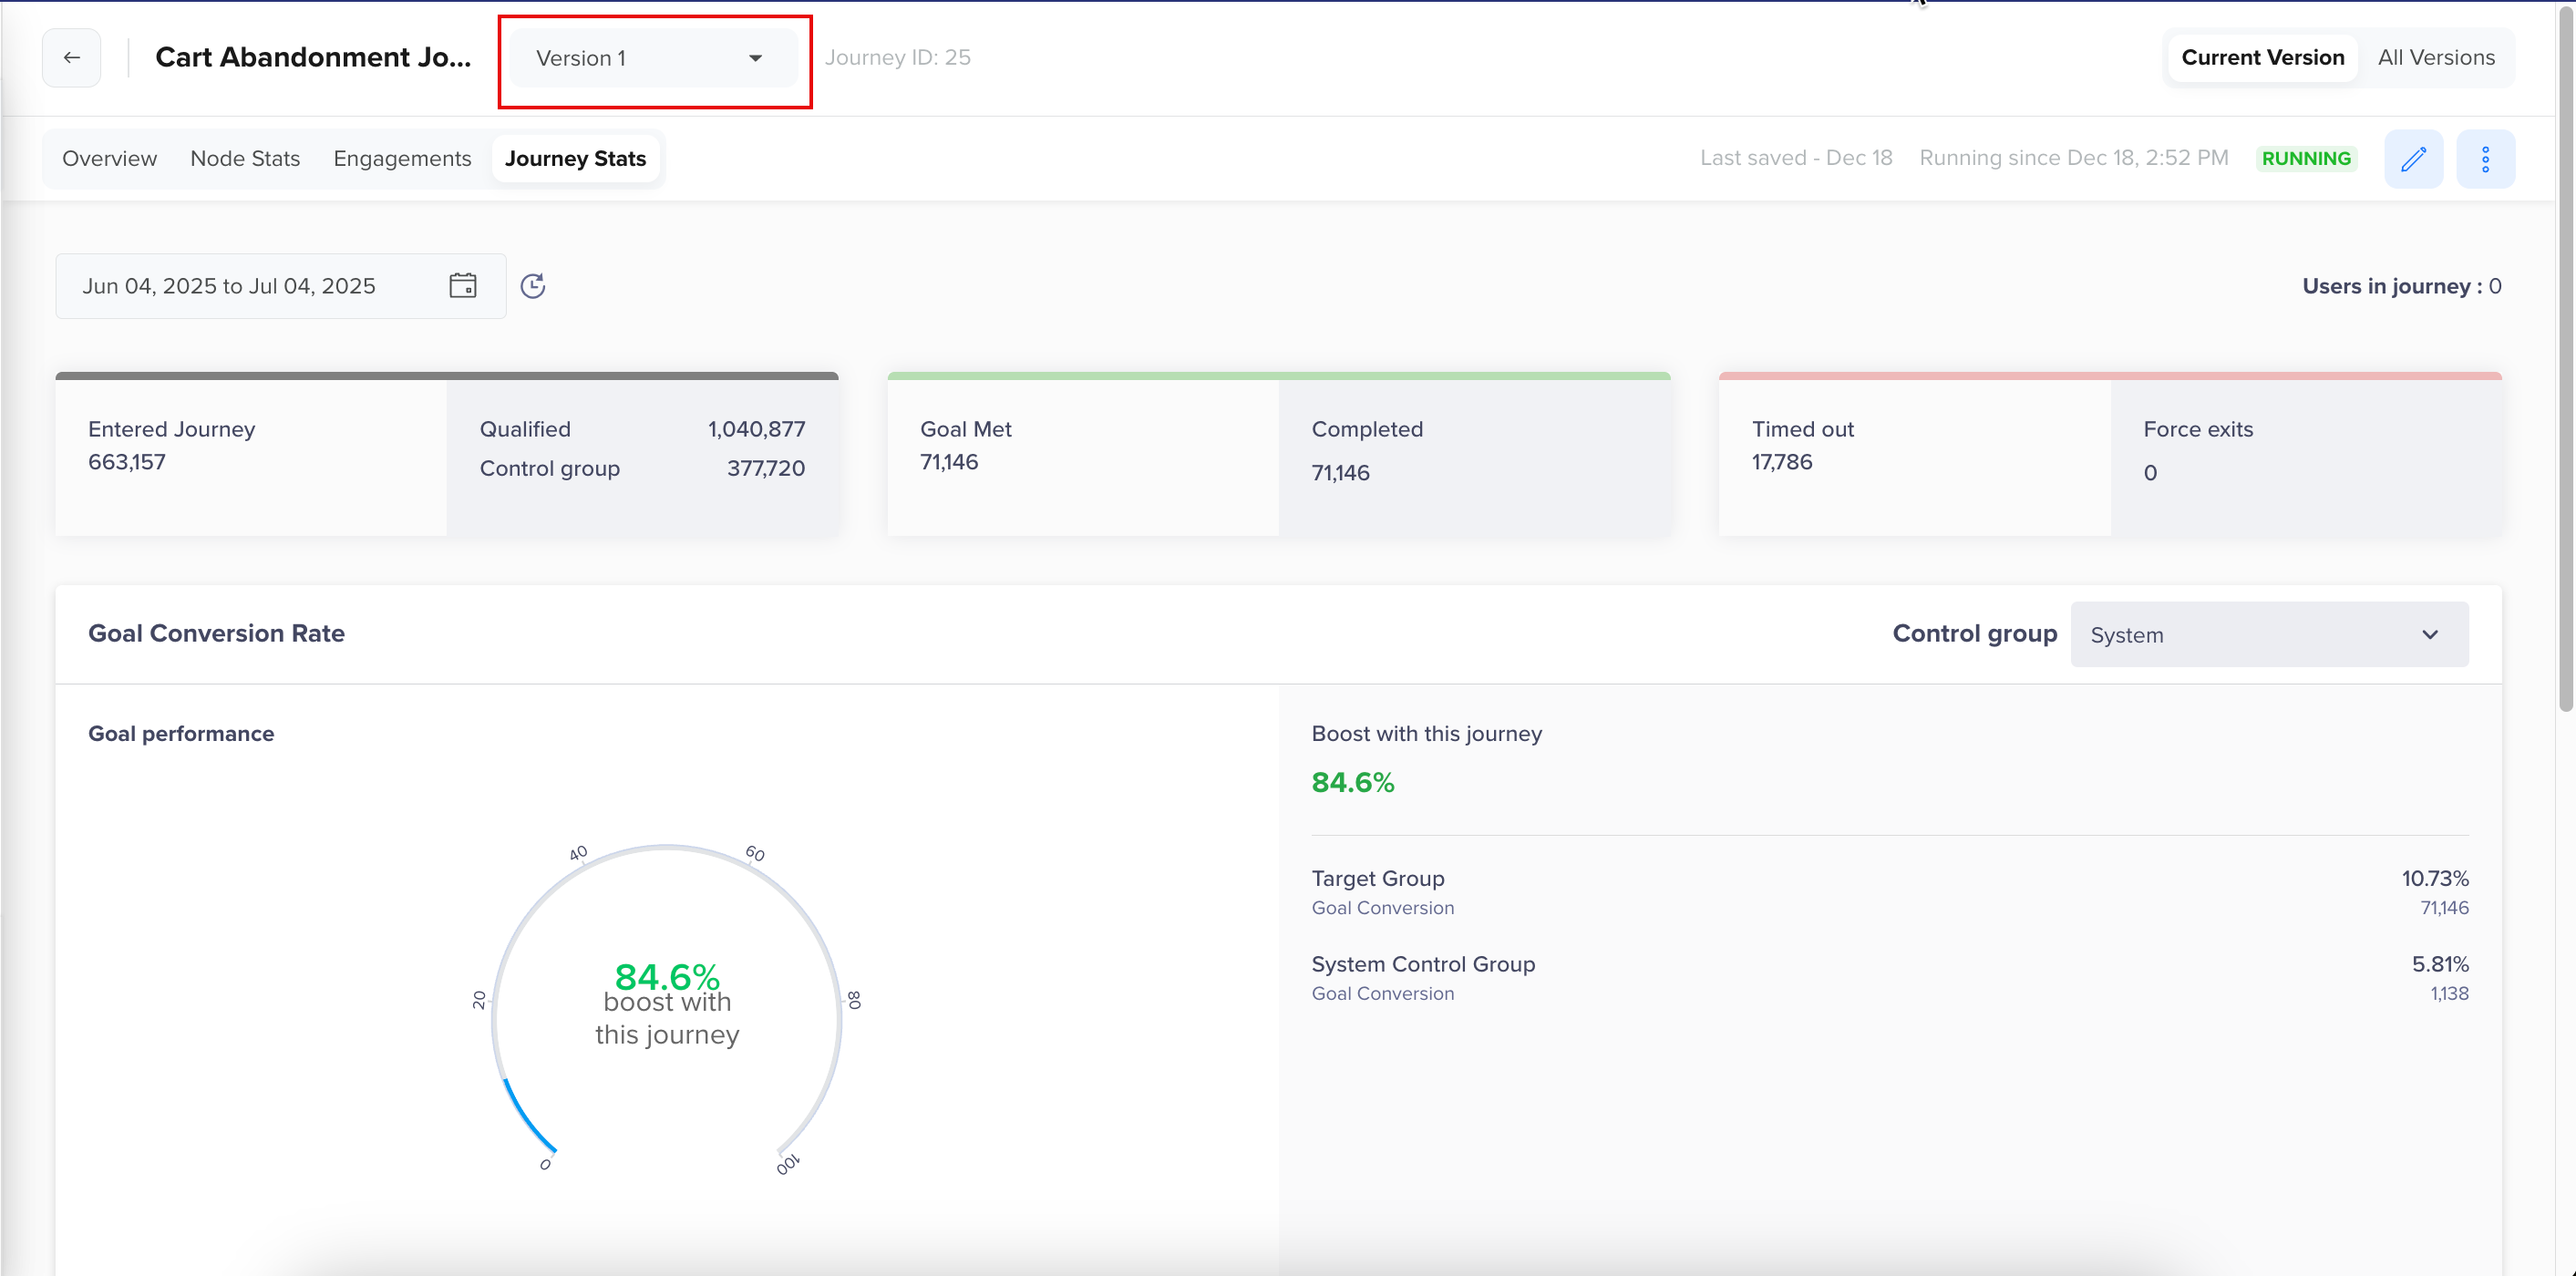
Journey Stats
Gain actionable insights into user behavior, goal completion, and campaign effectiveness, version by version.
Overview
The Journey Stats tab provides comprehensive performance metrics for the journey. This view helps you understand how users are progressing through the journey, evaluate goal performance, and compare target vs. control group behavior.
Journey Stats
Use the calendar selector at the top to define a custom date range for which you want to view journey performance.
Metrics for Journey StatsAll metrics displayed on this page are based on the selected date range, except for the Users in journey count, which reflects the real-time number of users currently progressing through the journey.
The following metrics are displayed at the top for the selected journey version:
- Entered Journey: Users who entered the journey.
- Qualified: Users who met the entry condition and were processed by journey nodes.
- Control Group: Random users held out from the journey for A/B comparison.
- Goal Met: Users who fulfilled the defined journey goal.
- Completed: Users who completed the journey.
- Timed Out: Users who did not complete the journey within the allowed timeframe.
- Force Exits: Users forcibly removed due to defined conditions.

Key Metrics for Journey Stats
Goal Conversion Rate
This section displays the conversion performance of the journey and compares the Target Group to the Control Group.

Goal Conversion Rate for Journey
- The Boost for the journey is calculated as follows:
Boost Rate = [(Target Group% - Control Group%)/Control Group%] x 100 - The Conversion Rate for the journey is calculated as follows:
Conversion Rate = (Number of Conversions/Number of Visitors) x 100
Entry and Exit Trends
The Trends section offers a timeline view, such as daily, weekly, and monthly, of key journey metrics:
- Number of users who entered the journey
- Number of users who completed the journey
- Users who met the journey goal
- Users who timed out of the journey
These insights help identify behavioral patterns and performance fluctuations over time.

Weekly Entry and Exit Journey Trends
Updated 7 months ago