NPS Board
Discover how the NPS Board uses AI-powered insights to streamline feedback analysis and uncover meaningful trends.
Overview
Net Promoter Score (NPS) is a widely used metric for measuring customer loyalty and satisfaction. It is based on a single question that asks customers how likely they are to recommend your product or service to others on a scale of 0 to 10.
By aggregating NPS scores over time, businesses can gauge overall customer sentiment and identify opportunities to improve areas such as product experience, customer support, and service delivery—ultimately strengthening customer loyalty.
CleverTap’s NPS dashboard gives you a clear and comprehensive view of your customers’ NPS feedback. To access it, go to Dashboard > Boards > NPS.
NPS AI Insights
NPS AI Insights is an enhancement to CleverTap’s Net Promoter Score (NPS) dashboard. It combines quantitative data (such as NPS scores and response volumes) with qualitative insights (including AI summaries, sentiment analysis, and theme clustering).
In addition to standard NPS metrics, NPS AI Insights applies AI-powered analysis to free-text responses, helping you quickly interpret customer feedback. This gives marketers and product teams a more complete view of customer satisfaction and the key factors influencing it.
Private BetaCurrently, this feature is released in Private Beta. If you want access to this feature, contact your Account Manager.
To view NPS AI Insights:
- Go to Dashboard > Boards > NPS. Select the Stats tab.
- Apply view filters if required. The following filters are available:
- Segment: Select All users or a specific segment
- Period: Select a custom date range
- Campaign: Select a specific campaign
- Once selected, the filtered insights view is shown under the AI Insights tab.
- Click See detailed insights to redirect to the AI insights page.
- To export data, click the download icon.
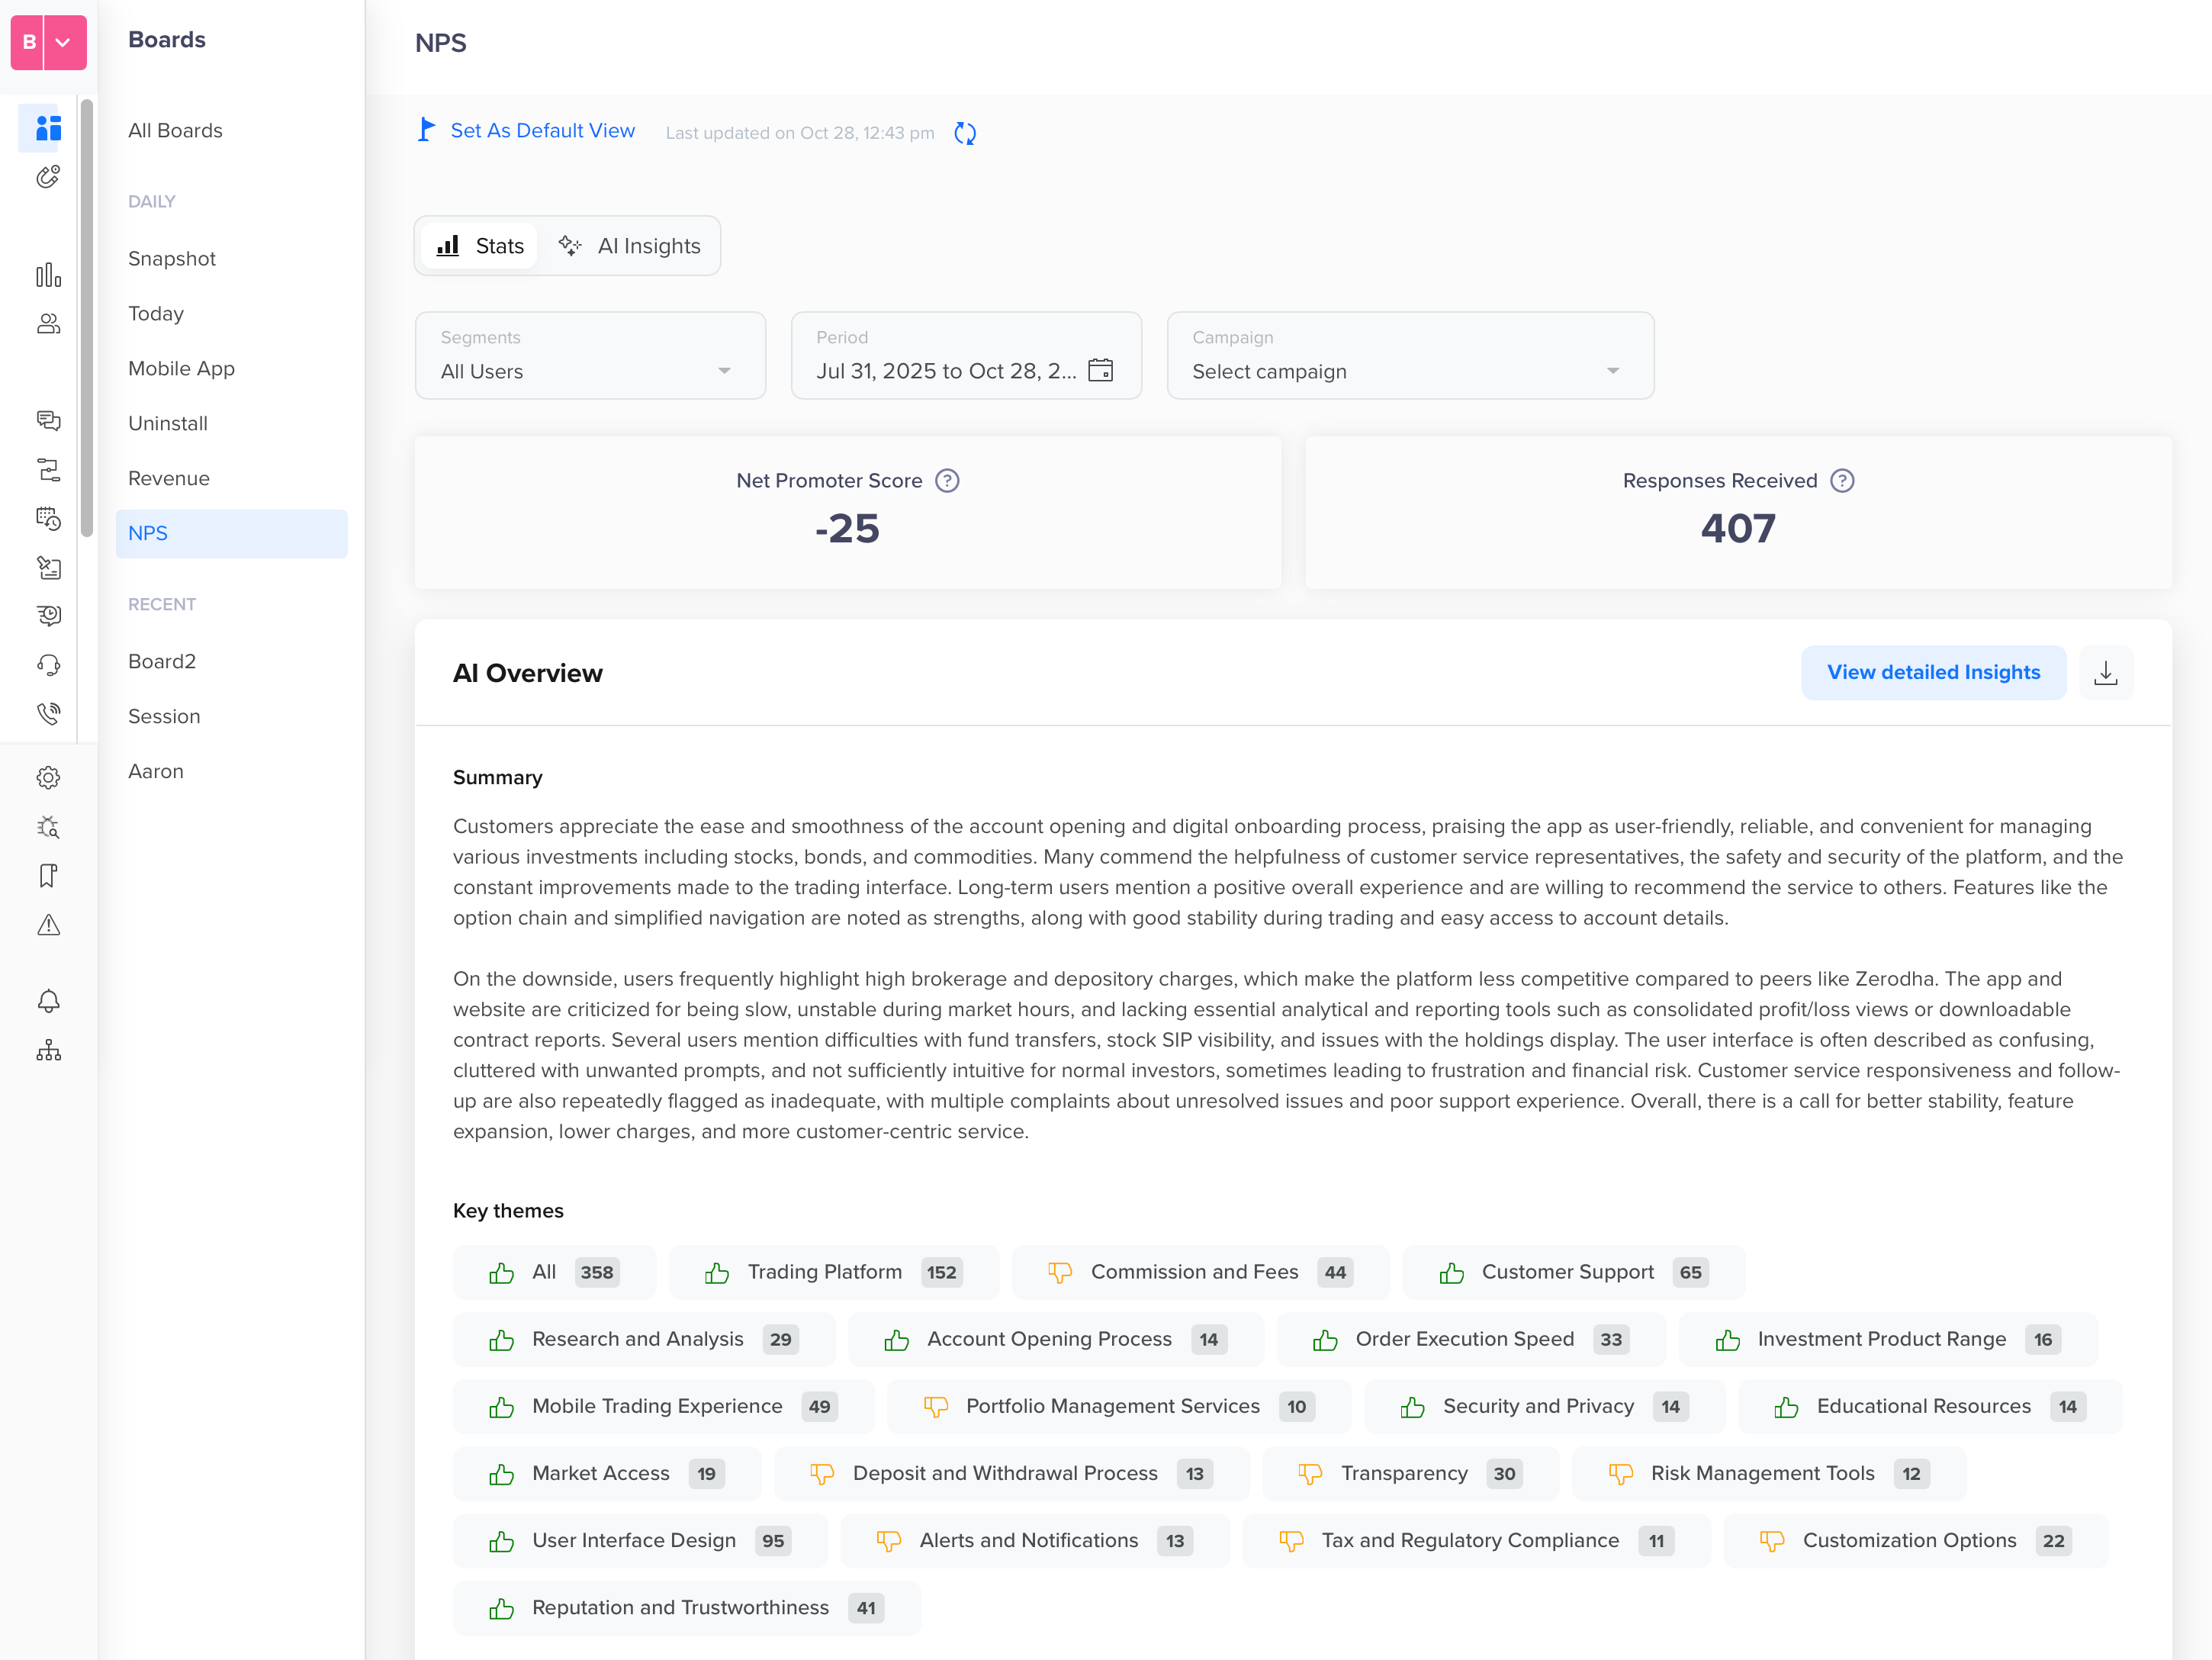
AI Insights
AI Insights
Select the AI insights tab to view the detailed analysis of all user reviews. Click See detailed insights to redirect to the AI insights page. Refer to the following AI Insights tabs:
AI Generated Summary
You can view the AI Summary for a quick overview of the comments. This summary automatically summarizes large volumes of comments into key takeaways, which helps marketers avoid manually scanning every response.
Key Themes
CleverTap groups user comments into recurring topics such as User Experience, Billing, or Onboarding. It also provides counts to highlight common pain points or strengths. Under Key Themes, you can hover over each theme to get a % breakdown of comments, based on negative and positive sentiment per theme.
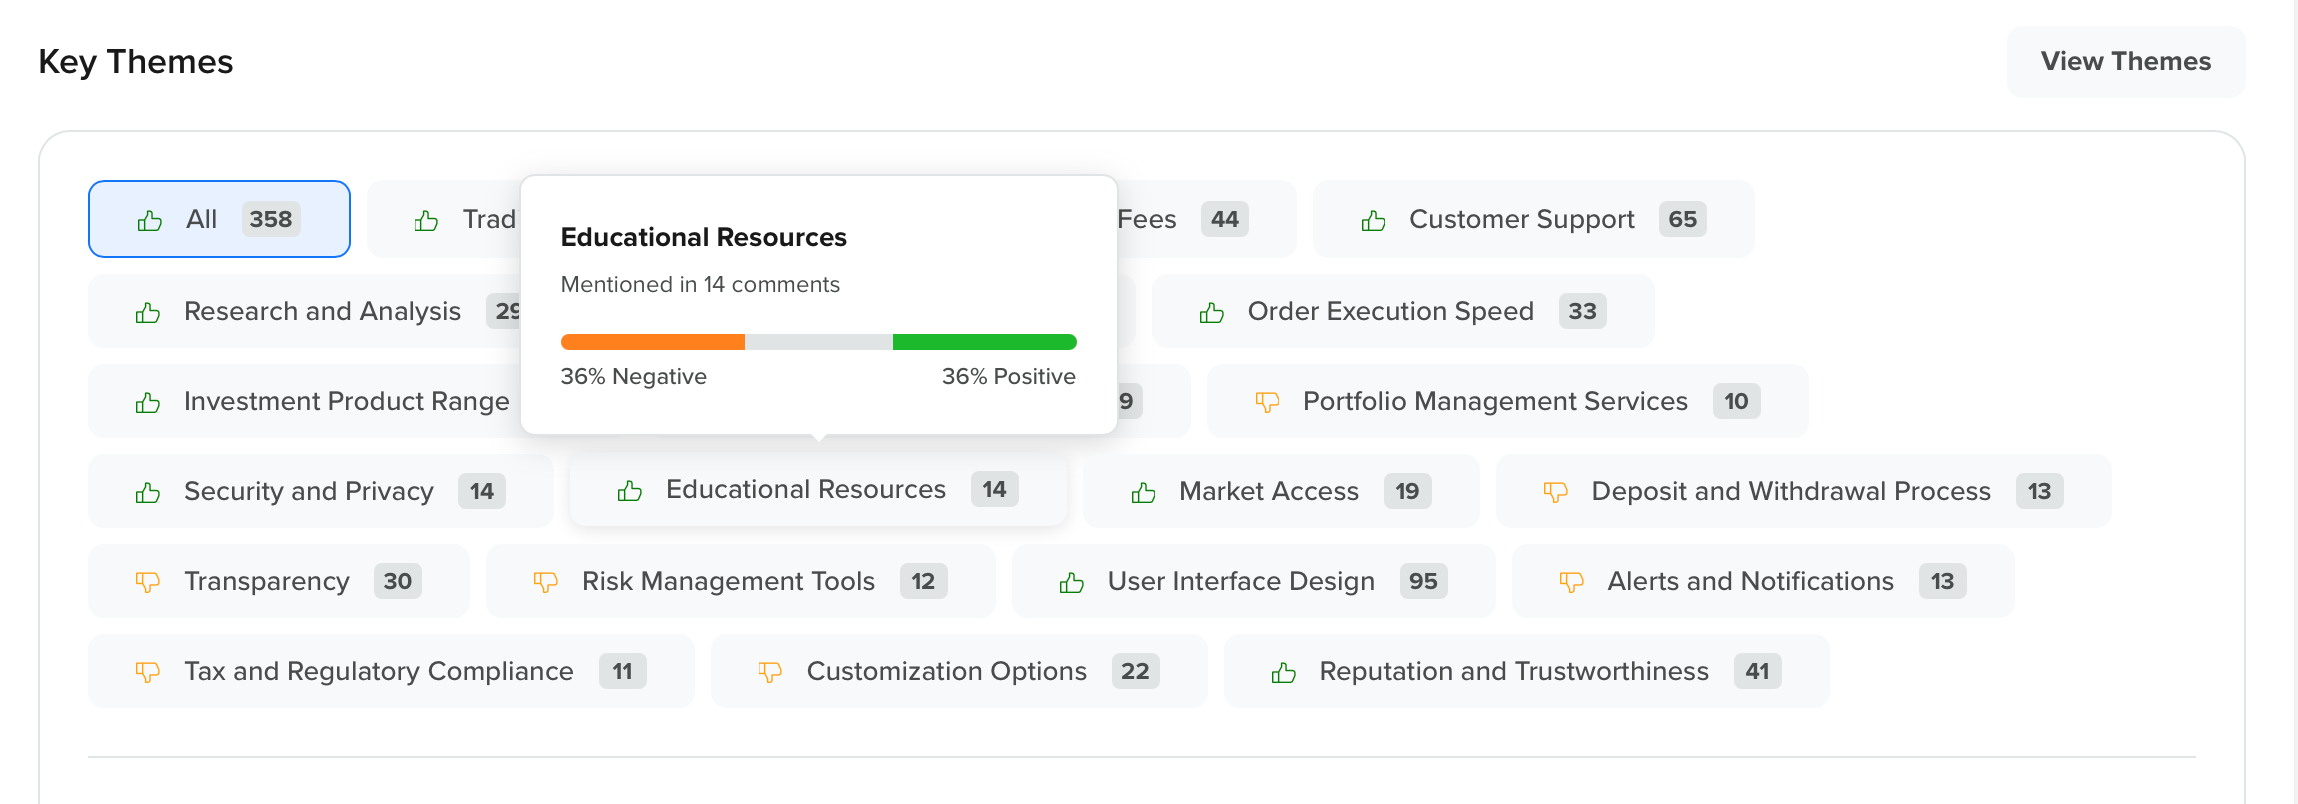
Hover over comments
You can apply filters to display only comments for a selected key theme by clicking on a theme. This is especially useful for deep dives into user concerns.
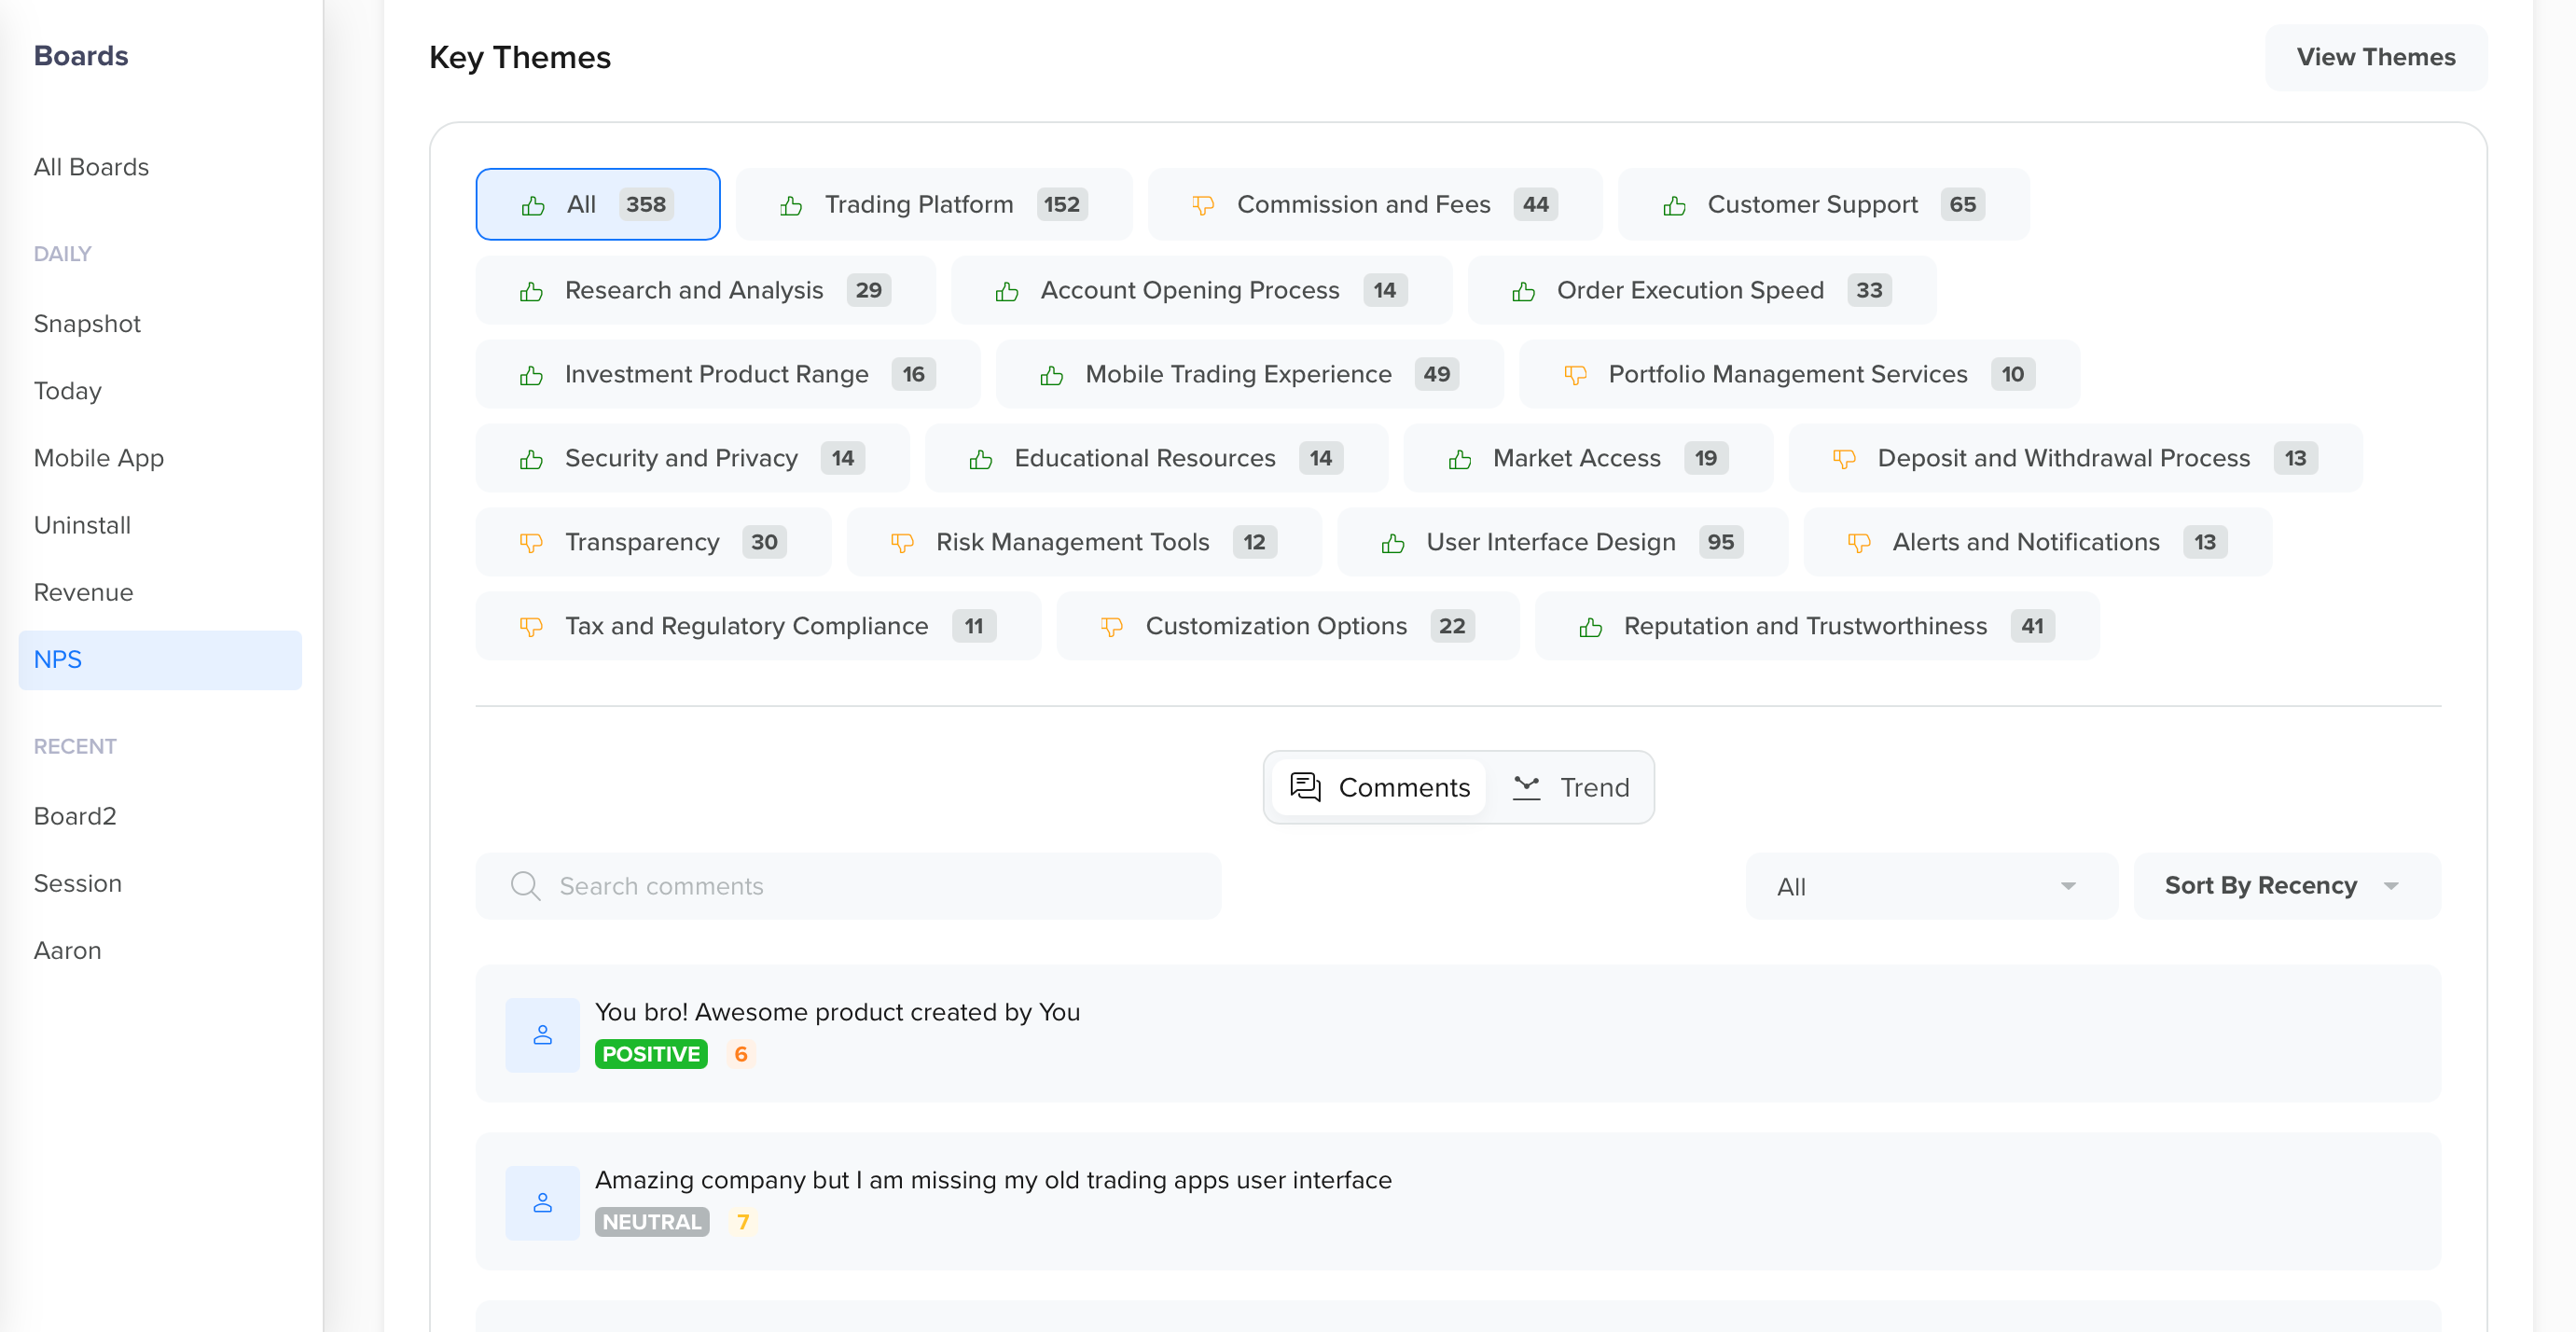
Detailed insights
Comments
You can sort the comments based on chronology or ratings, in an ascending or descending order.
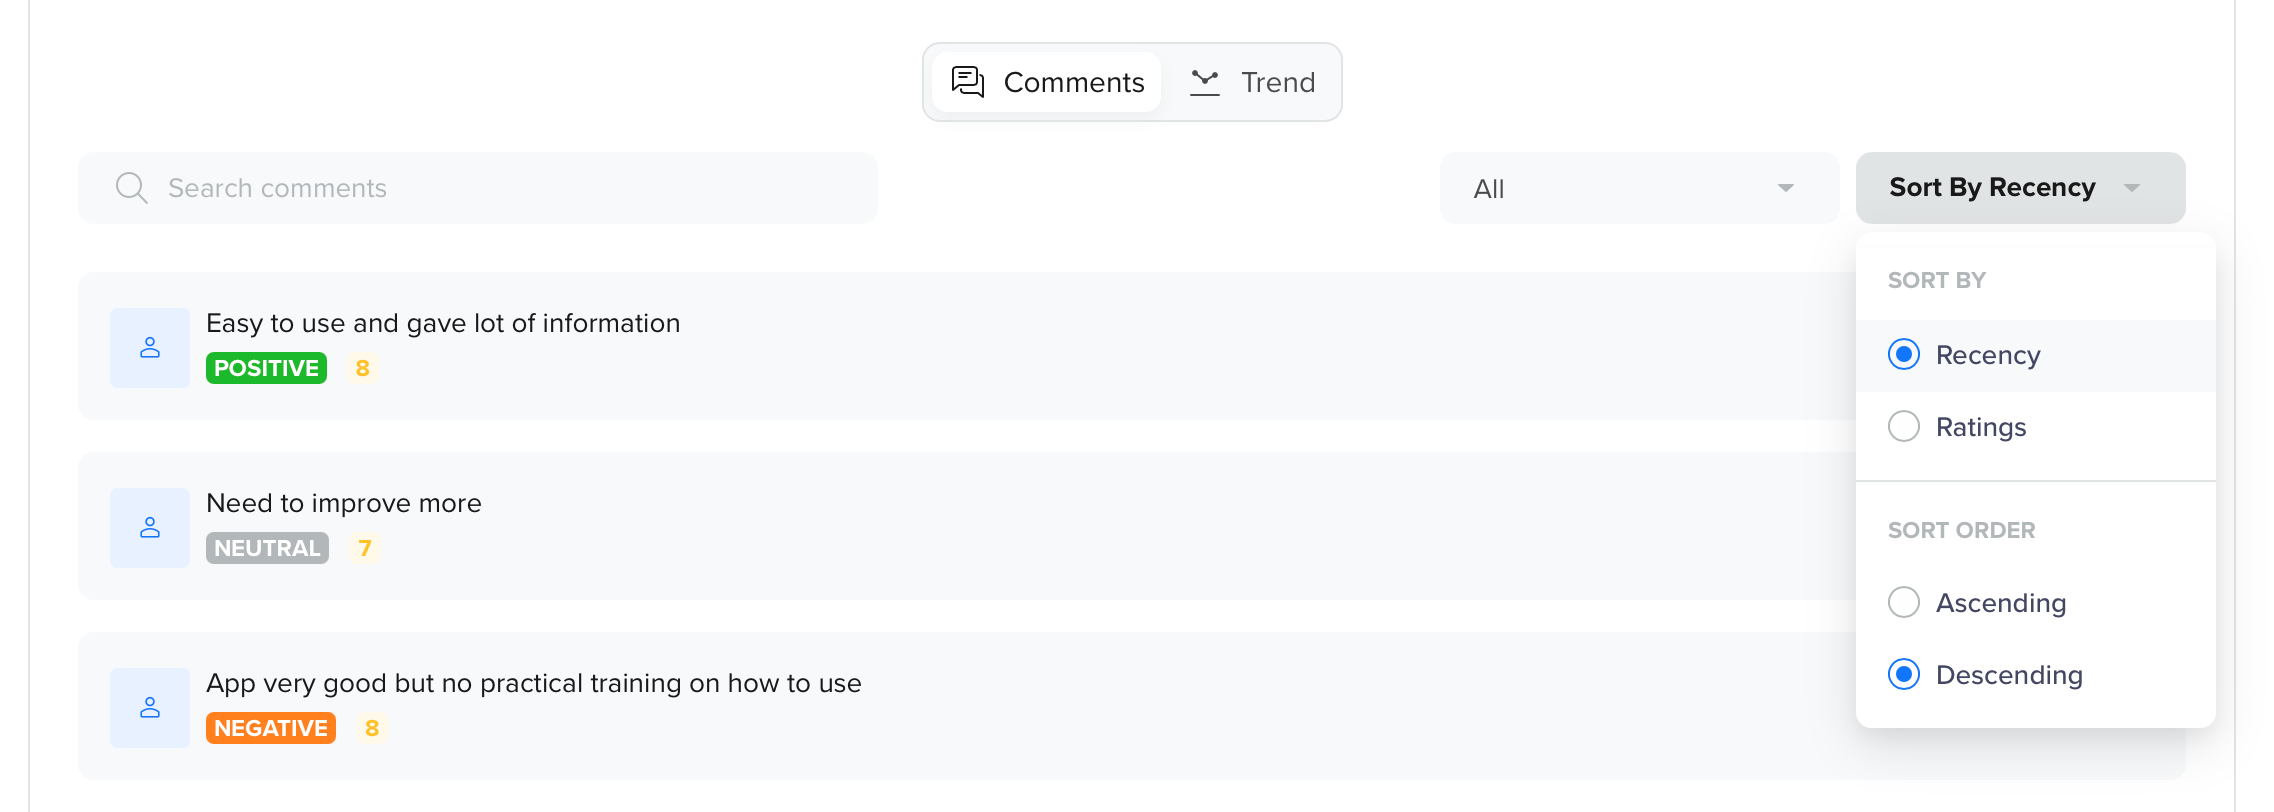
Sort comments by recency or ratings
You can filter the user comments based on their key sentiments: Positive, Negative, or Neutral.
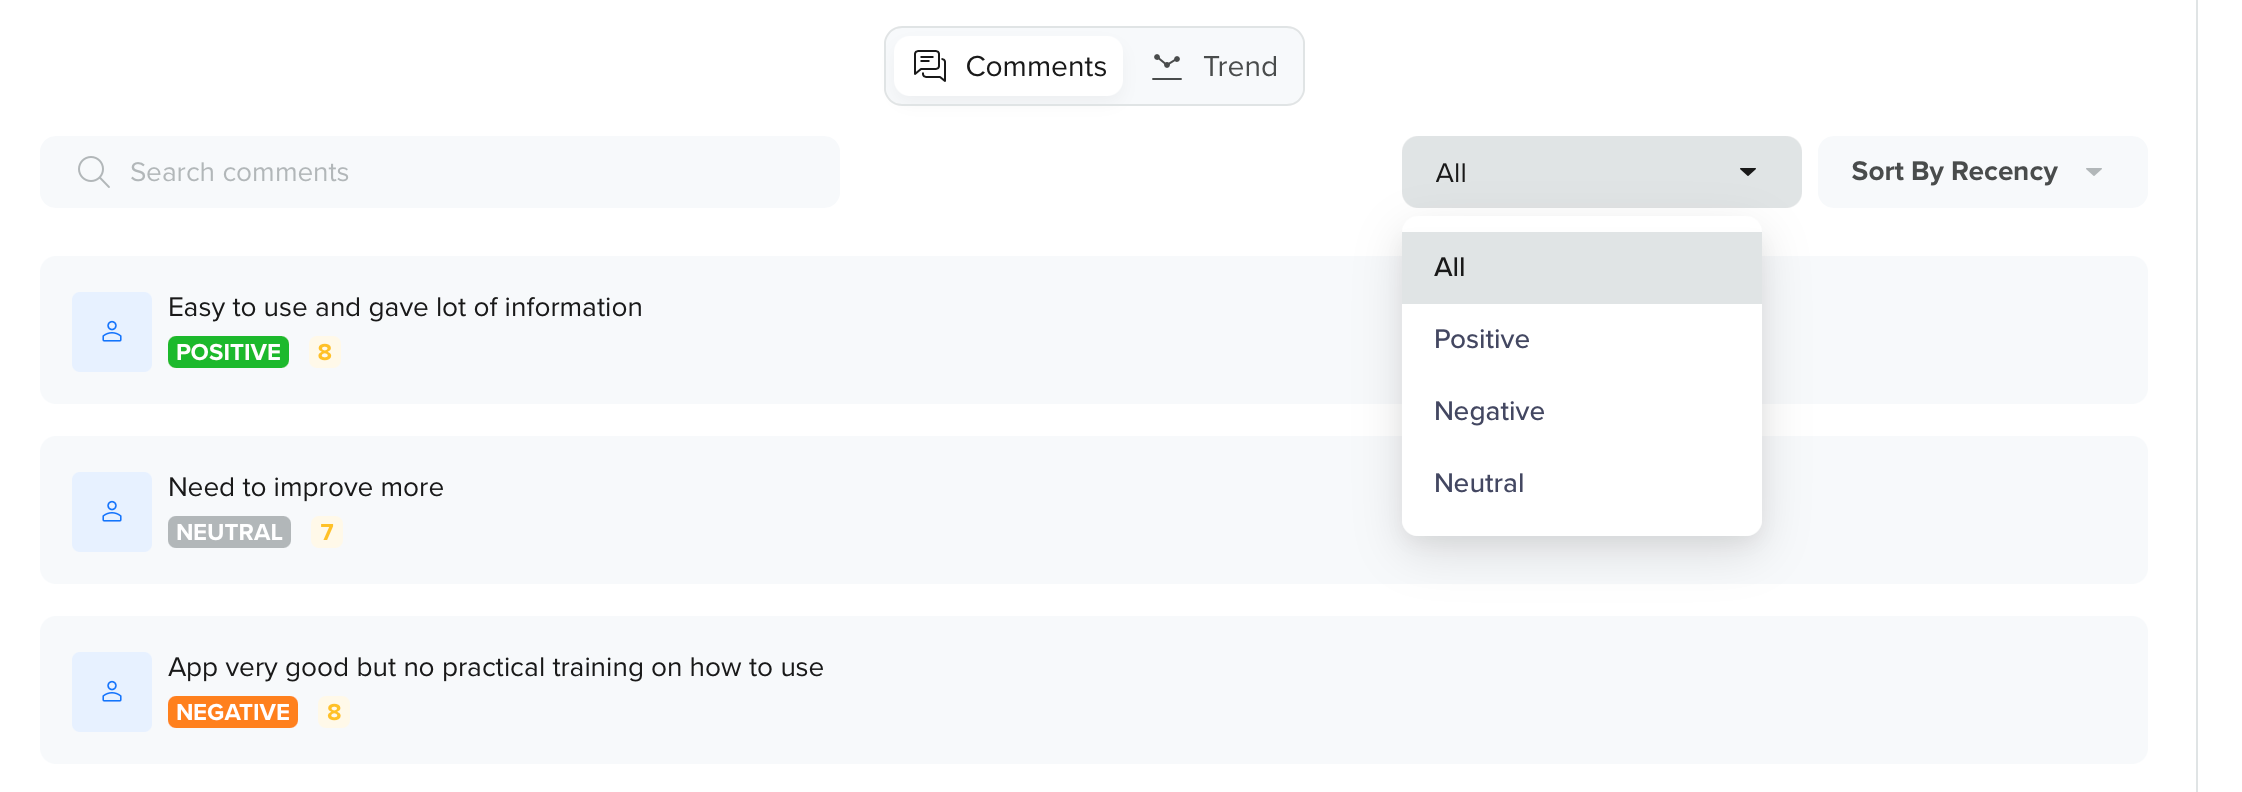
Sort comments by key sentiments
Trend
Sentiment trends provide an aggregate view of positive, neutral, and negative sentiment across all comments. Click the dropdown to see a daily, weekly, or monthly trend chart.
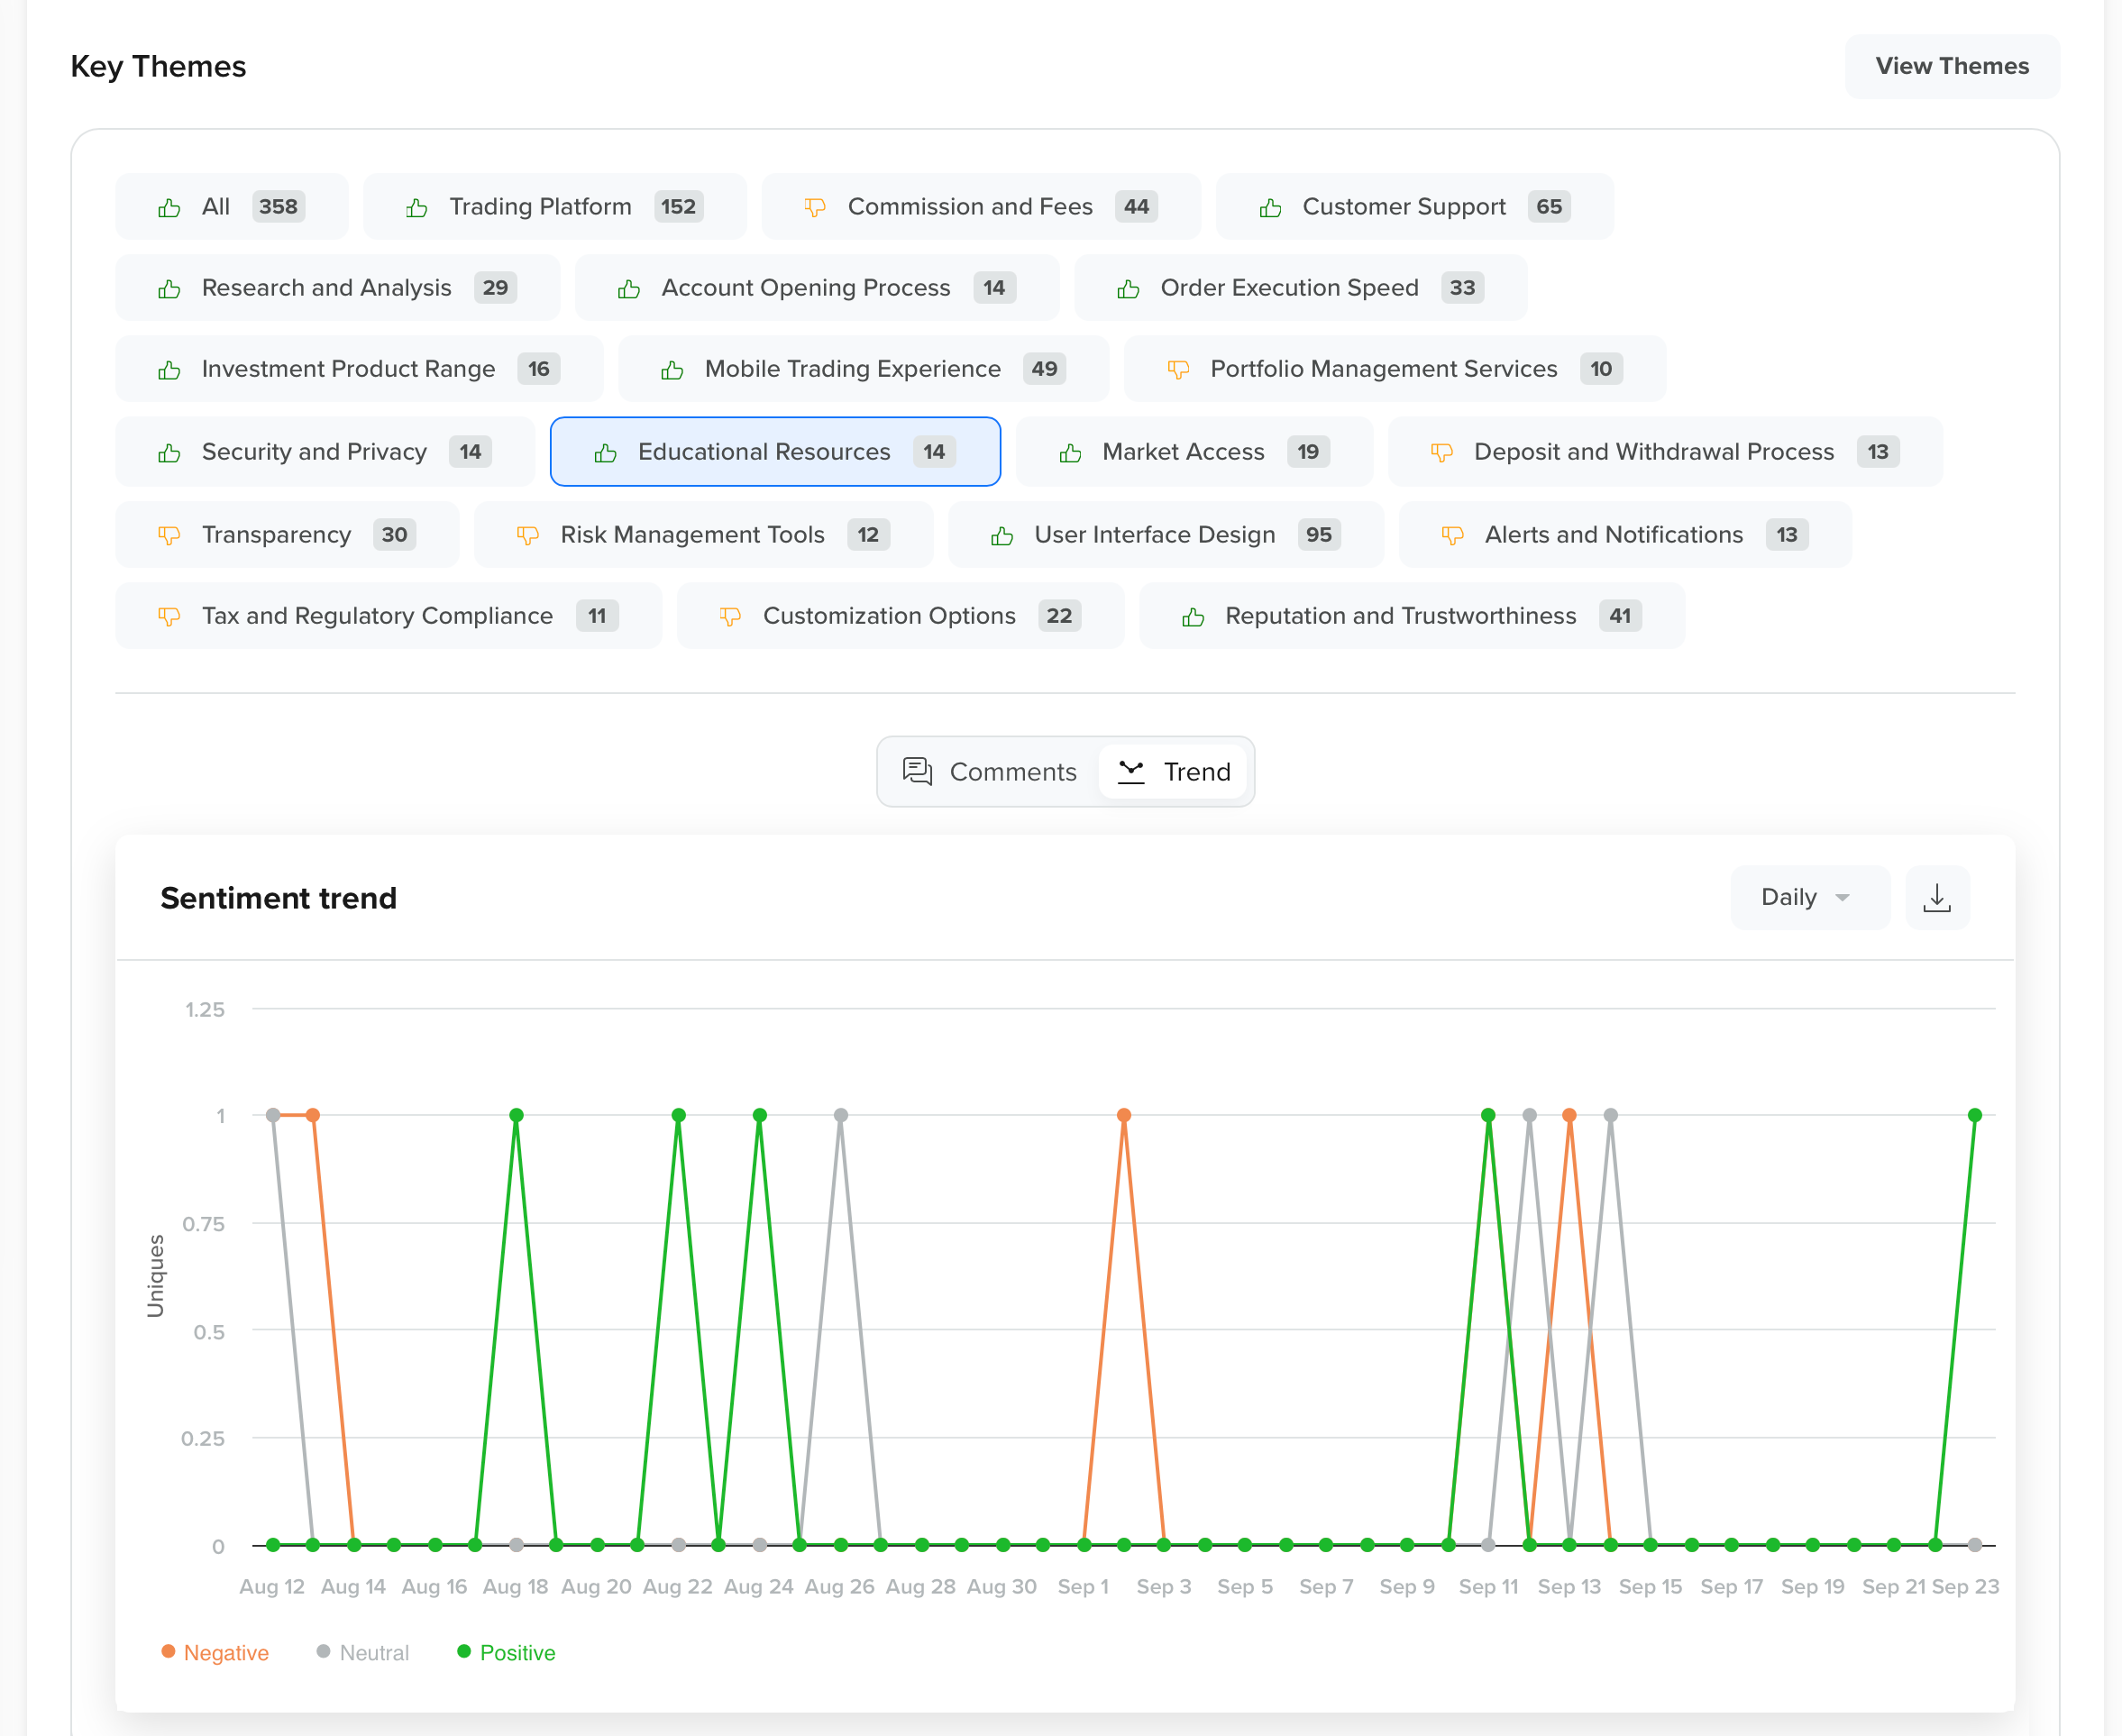
Trend
Smart Word Cloud
Smart Word Cloud helps with the visualization of the most frequently used words in user comments. It helps quickly identify trending topics and provides actionable insights for deeper analysis.
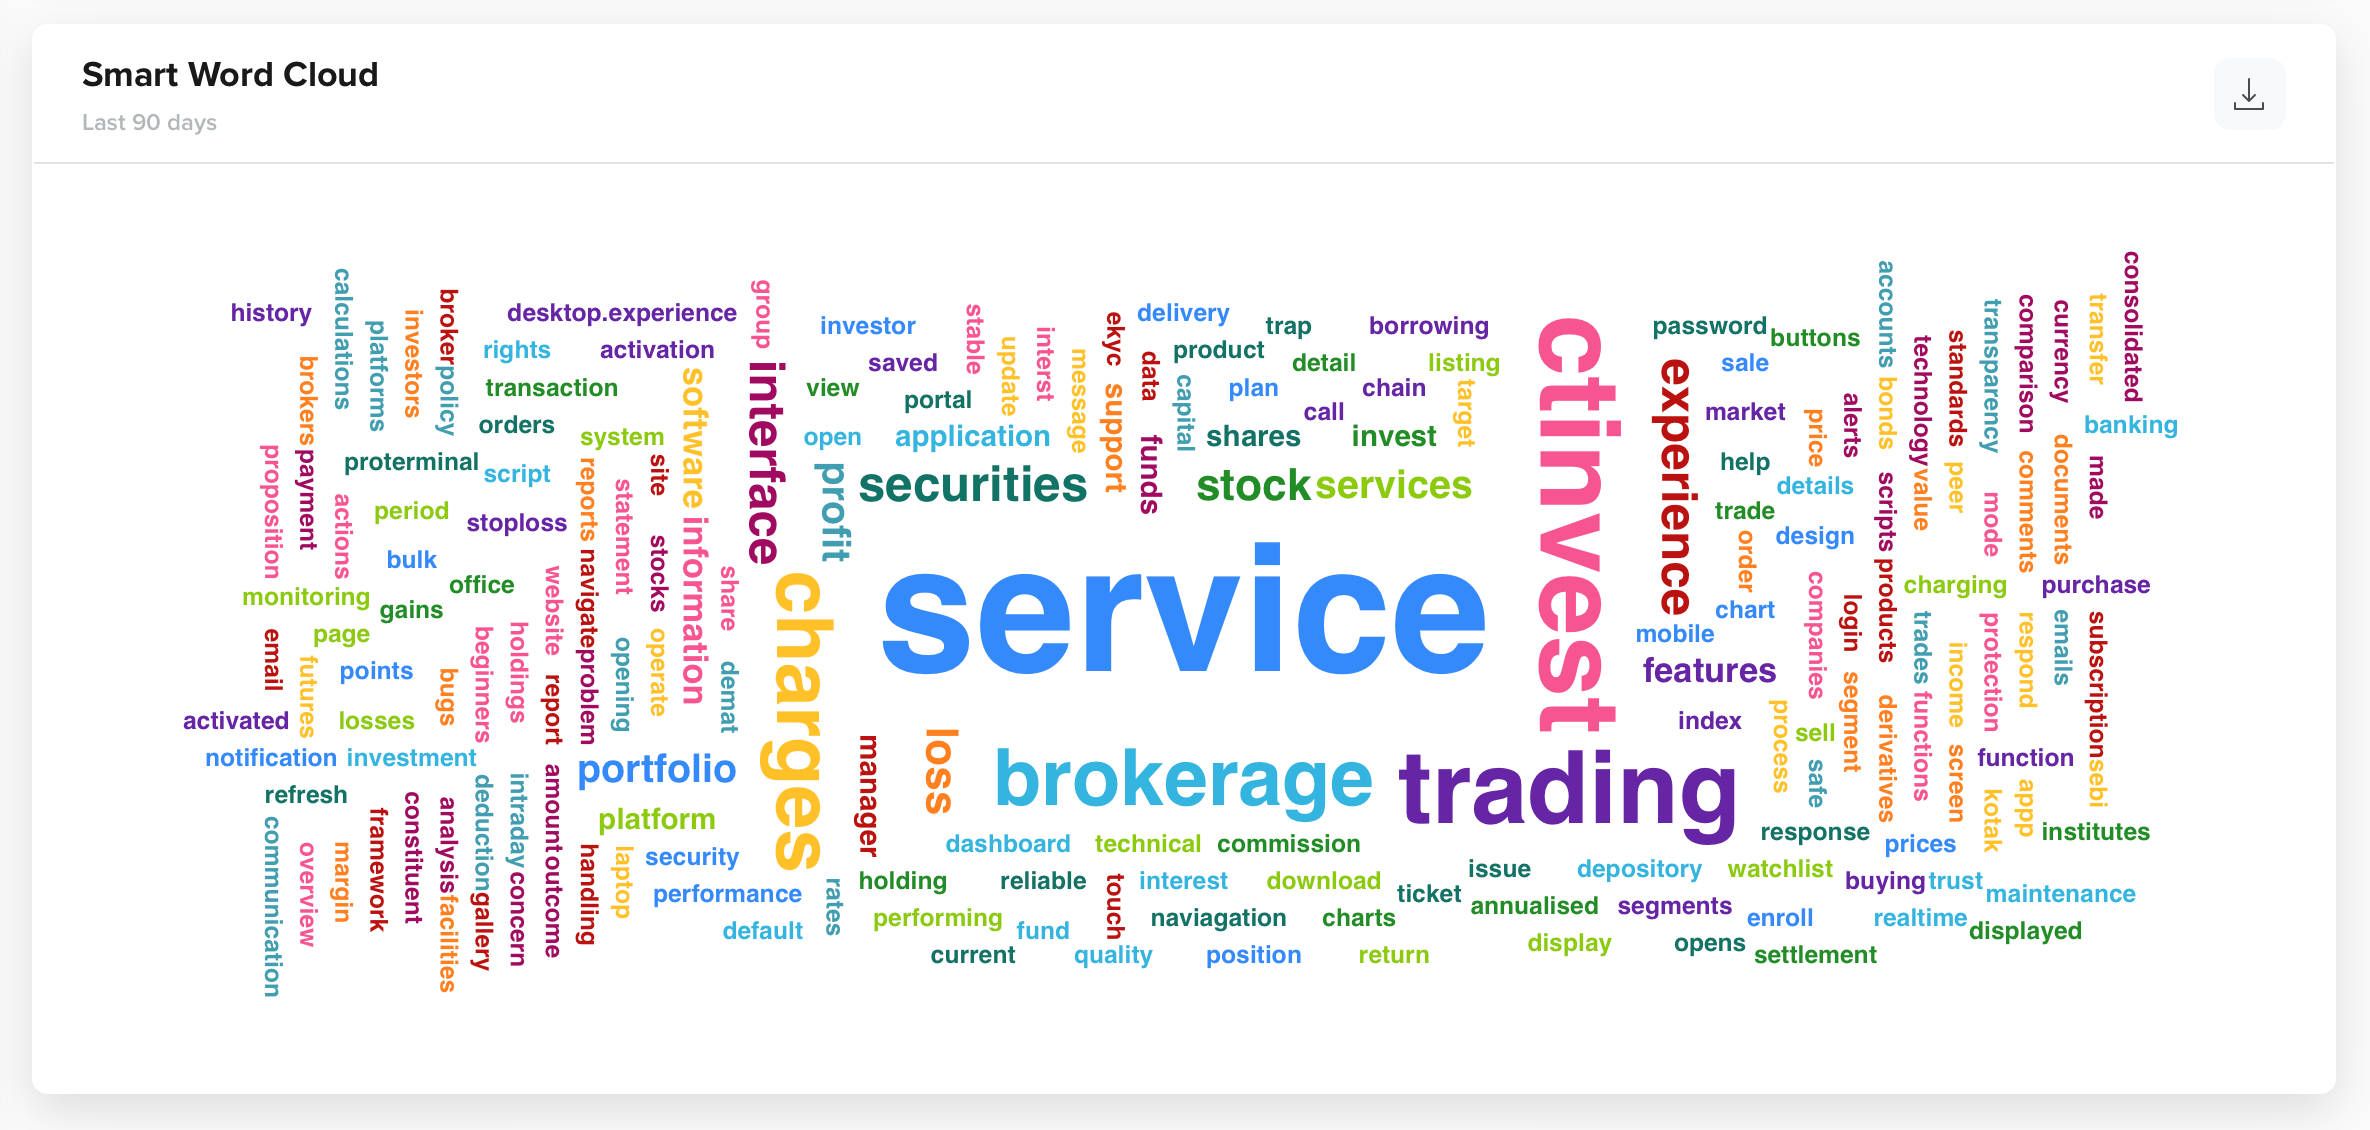
Smart Word Cloud
NPS Board - Stats
The NPS board in CleverTap provides a comprehensive overview of customer feedback collected through Net Promoter Score surveys. It combines key quantitative metrics with trend visualizations to help you measure and track user sentiment over time.
The NPS board in CleverTap displays the following data points:
- Overall NPS Score: Calculated using customer responses.
- Total Responses Received: Number of users who submitted feedback.
- NPS Buckets: Categorized breakdown of Detractors, Passives, and Promoters.
- NPS Score Trend: Visual representation of how the score changes over time.
- NPS Buckets Trend: Distribution of Detractors, Passives, and Promoters over a selected time period (daily, weekly, or monthly).
- Ratings Distribution: Bar chart of user ratings on a scale of 0–10.
- Total Responses Trend: Trend line showing submission volumes across time periods.
At a high level, the NPS feedback is categorized into three buckets - Detractors, Passive, and Promoters.
- Detractors (0–6): Unhappy customers likely to churn or share negative feedback.
- Passives (7–8): Neutral customers who are satisfied but not enthusiastic.
- Promoters (9–10): Loyal customers who are highly likely to recommend your product.
The overall NPS score is calculated as the difference between the percentages of Promoters and Detractors (NPS = % of Promoters - % of Detractors). For example, for a standard NPS question, "How likely are you to recommend us on a scale from 0 to 10?” If 70% of respondents are Promoters and 10% are Detractors, then you have an NPS of 60. You can refine your view using filters for campaigns, segments, or date ranges to analyze performance for specific cohorts or time periods.
The following chart illustrates how feedback is distributed across Detractors, Passives, and Promoters:
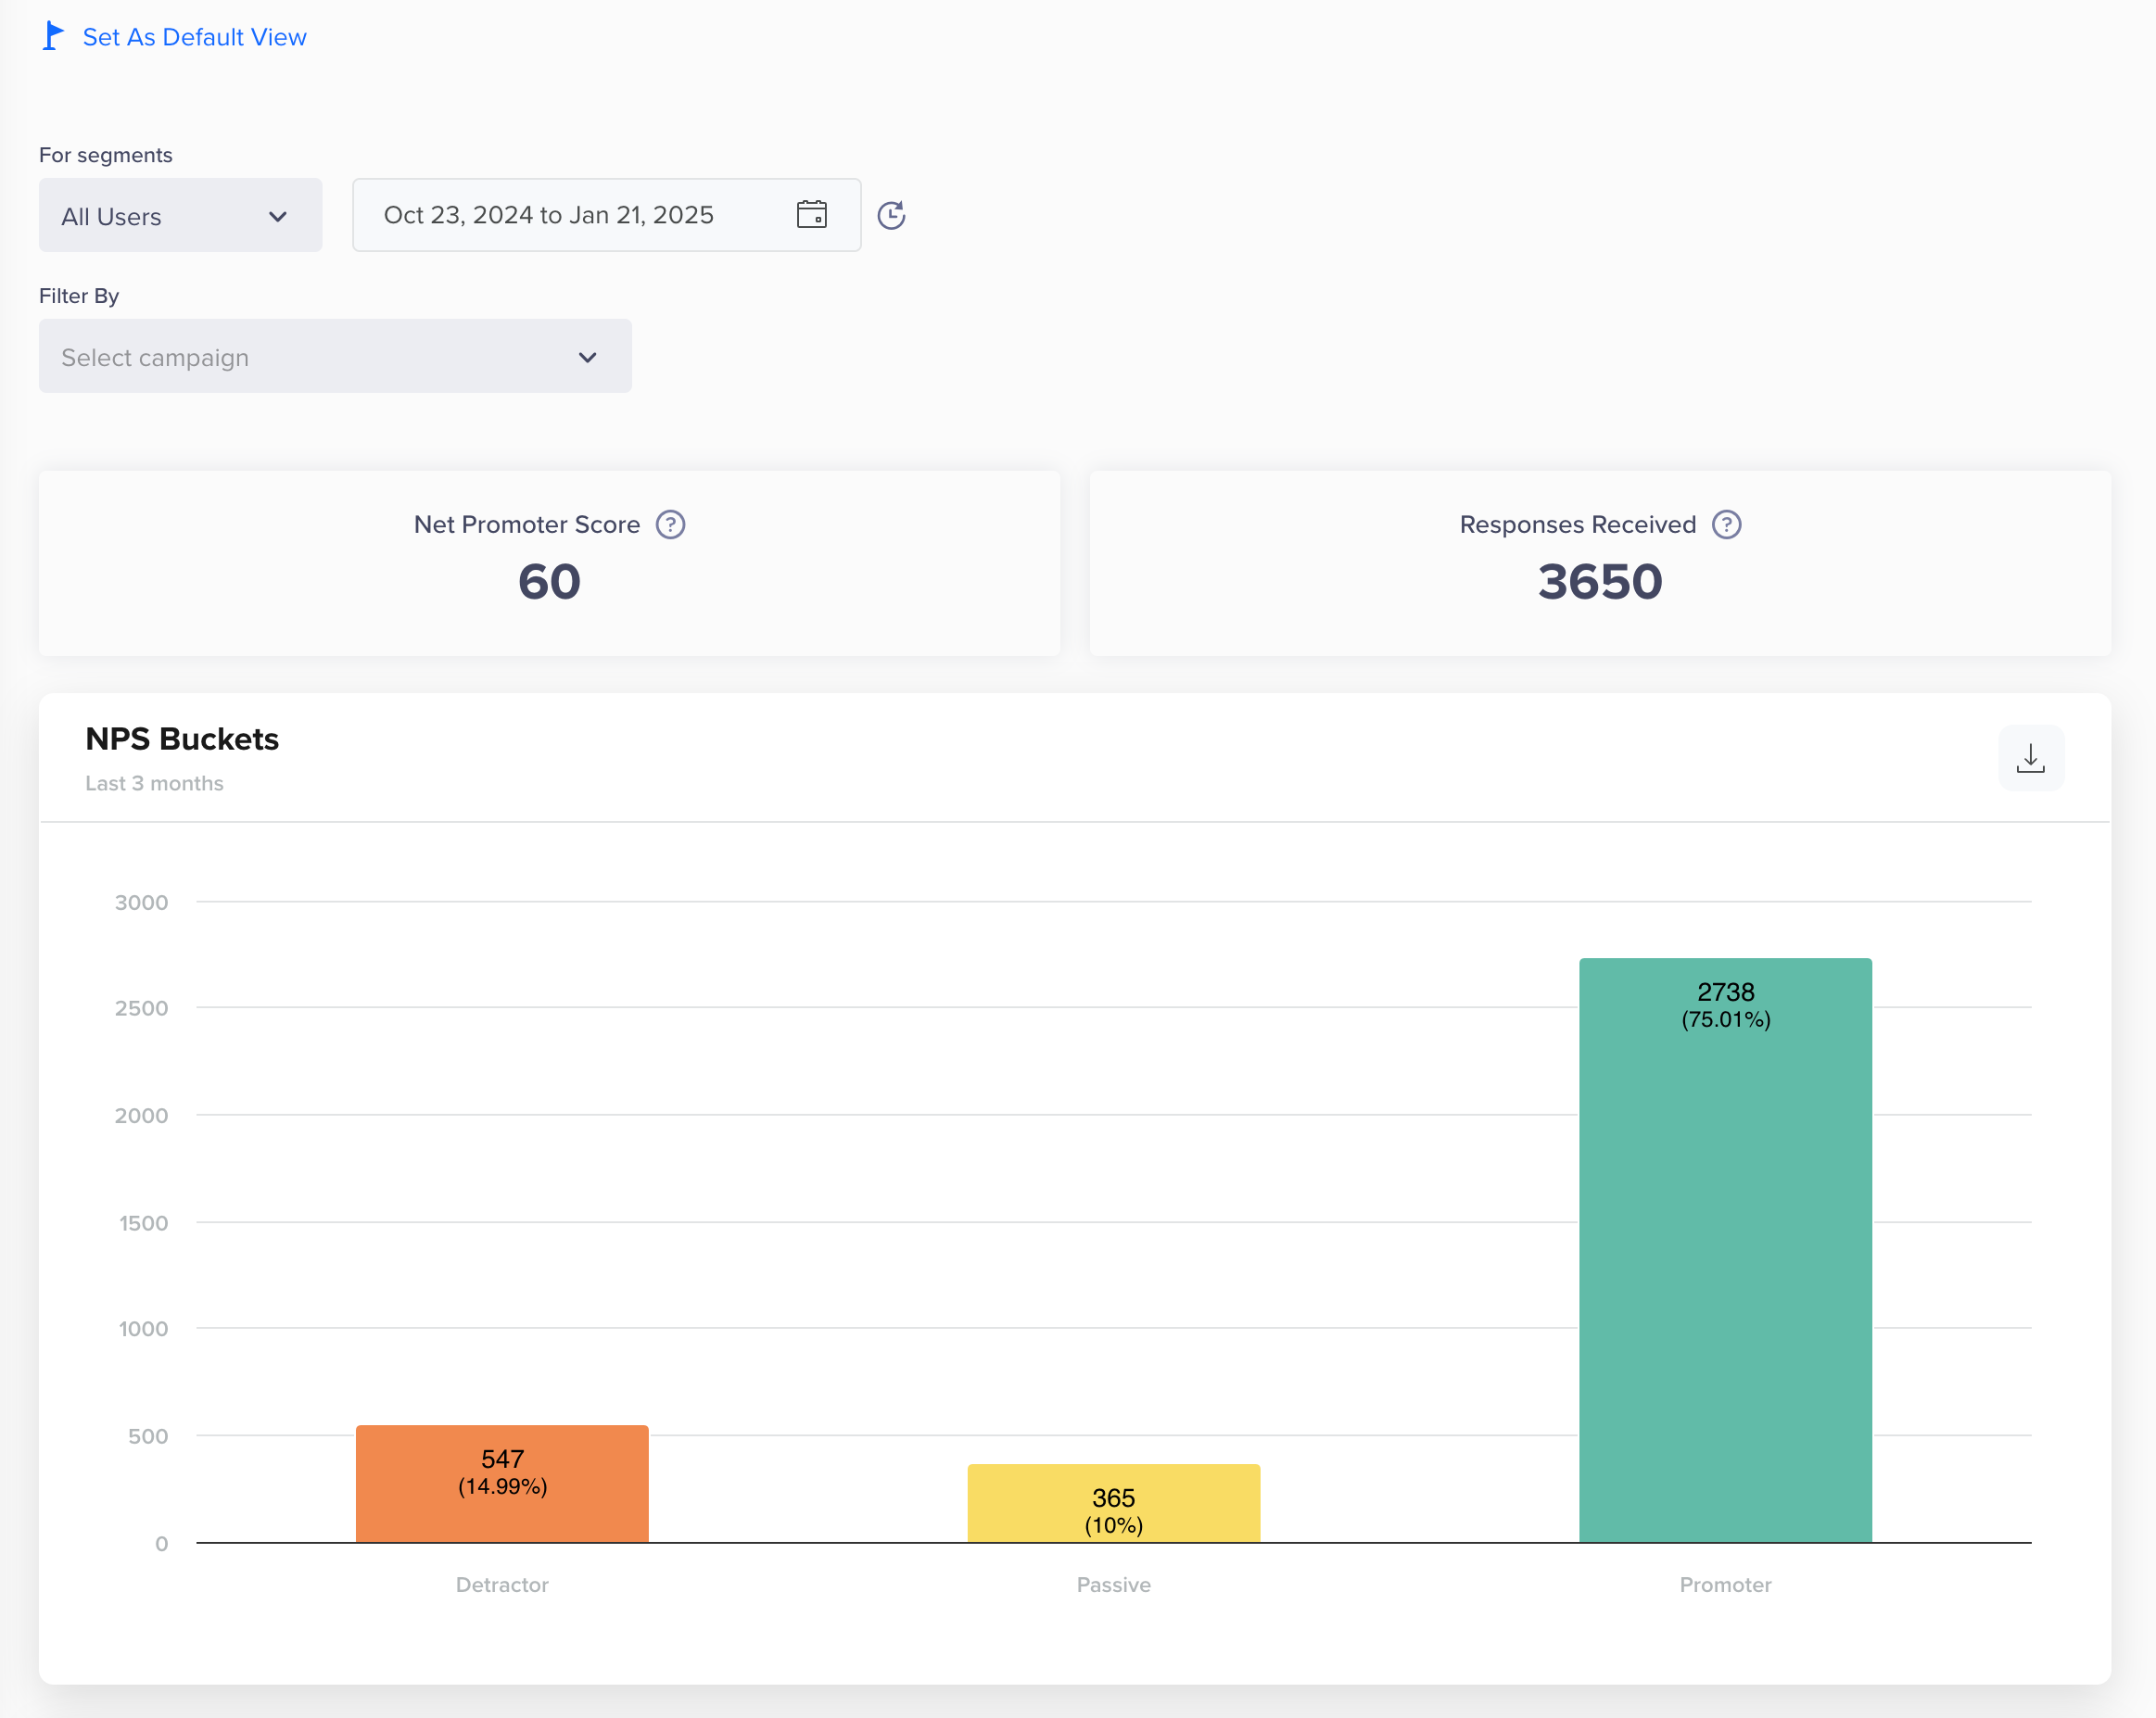
View NPS for All Users
The NPS board also provides:
- NPS Score Trend over a specific period (daily, weekly, monthly).
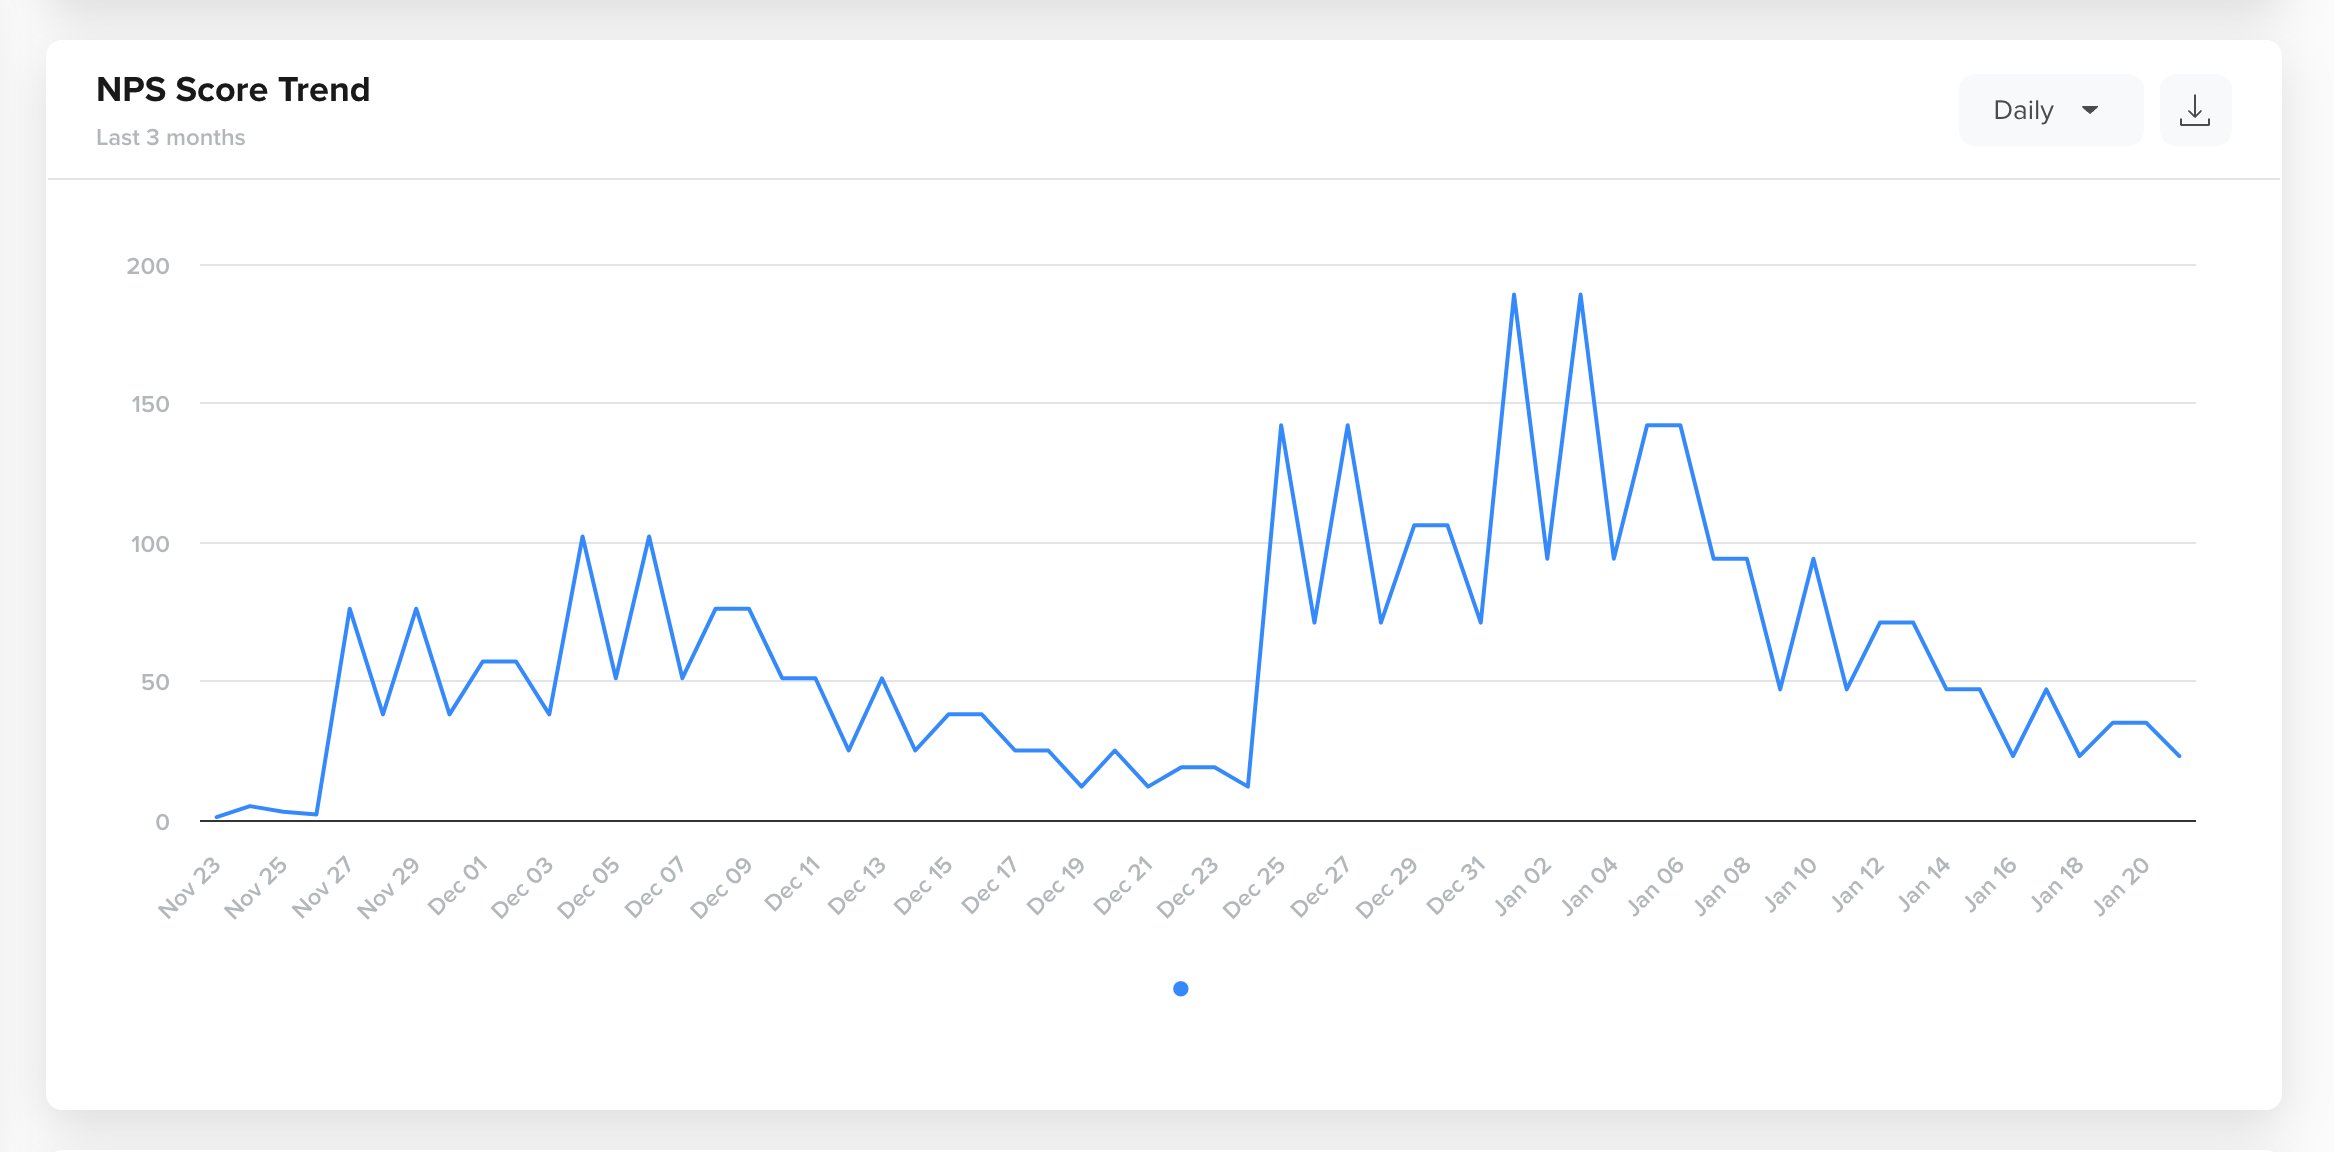
NPS Score Trend
- NPS Buckets Trend for Detractors, Passives, and Promoters over a specific period (daily, weekly, monthly).
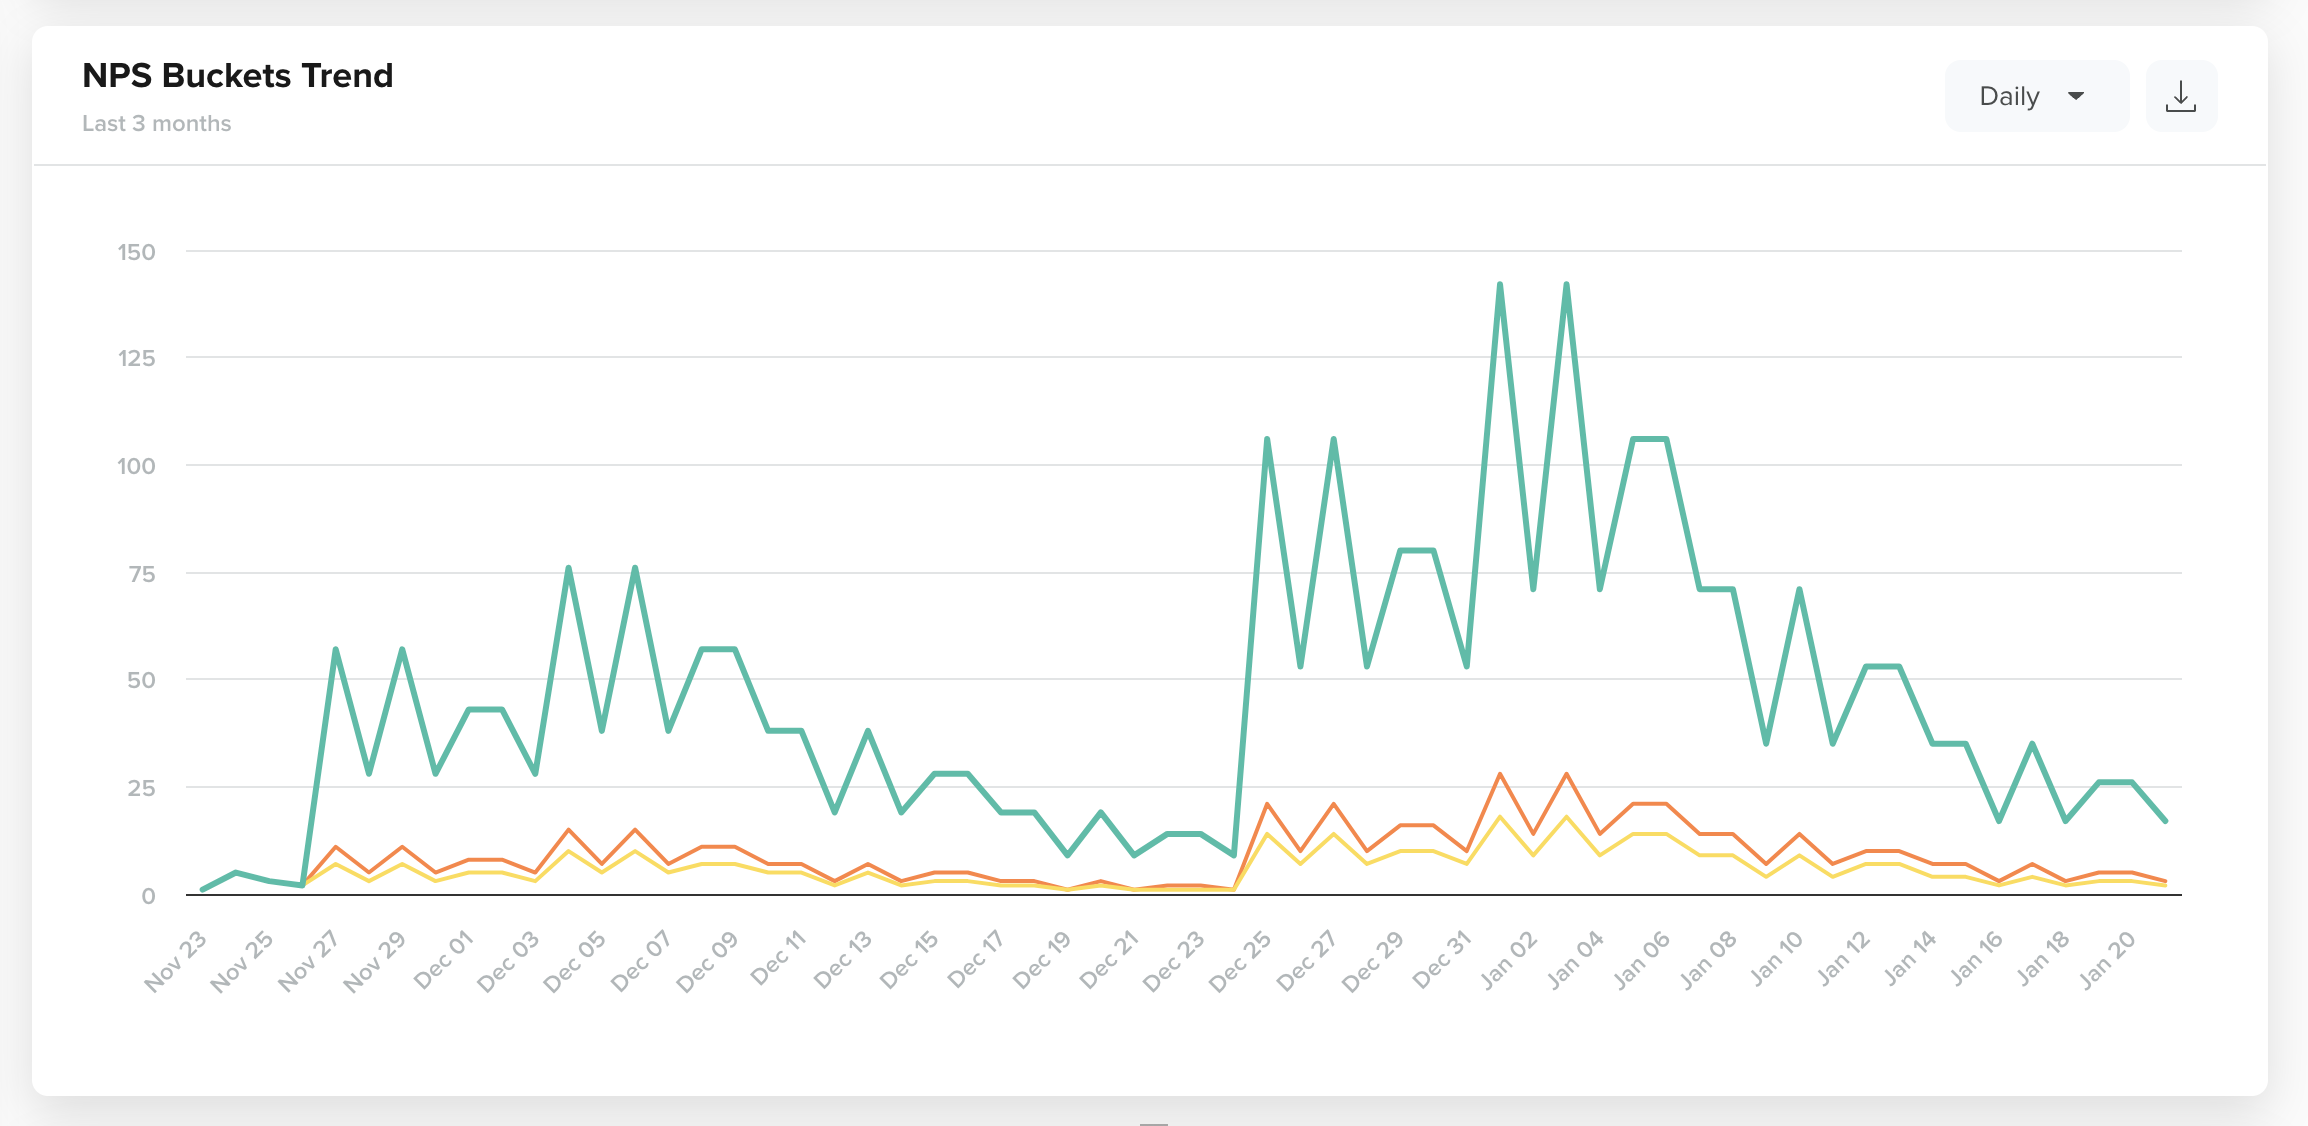
NPS Comparison
- A bar graph view of the Ratings Distribution for the selected duration
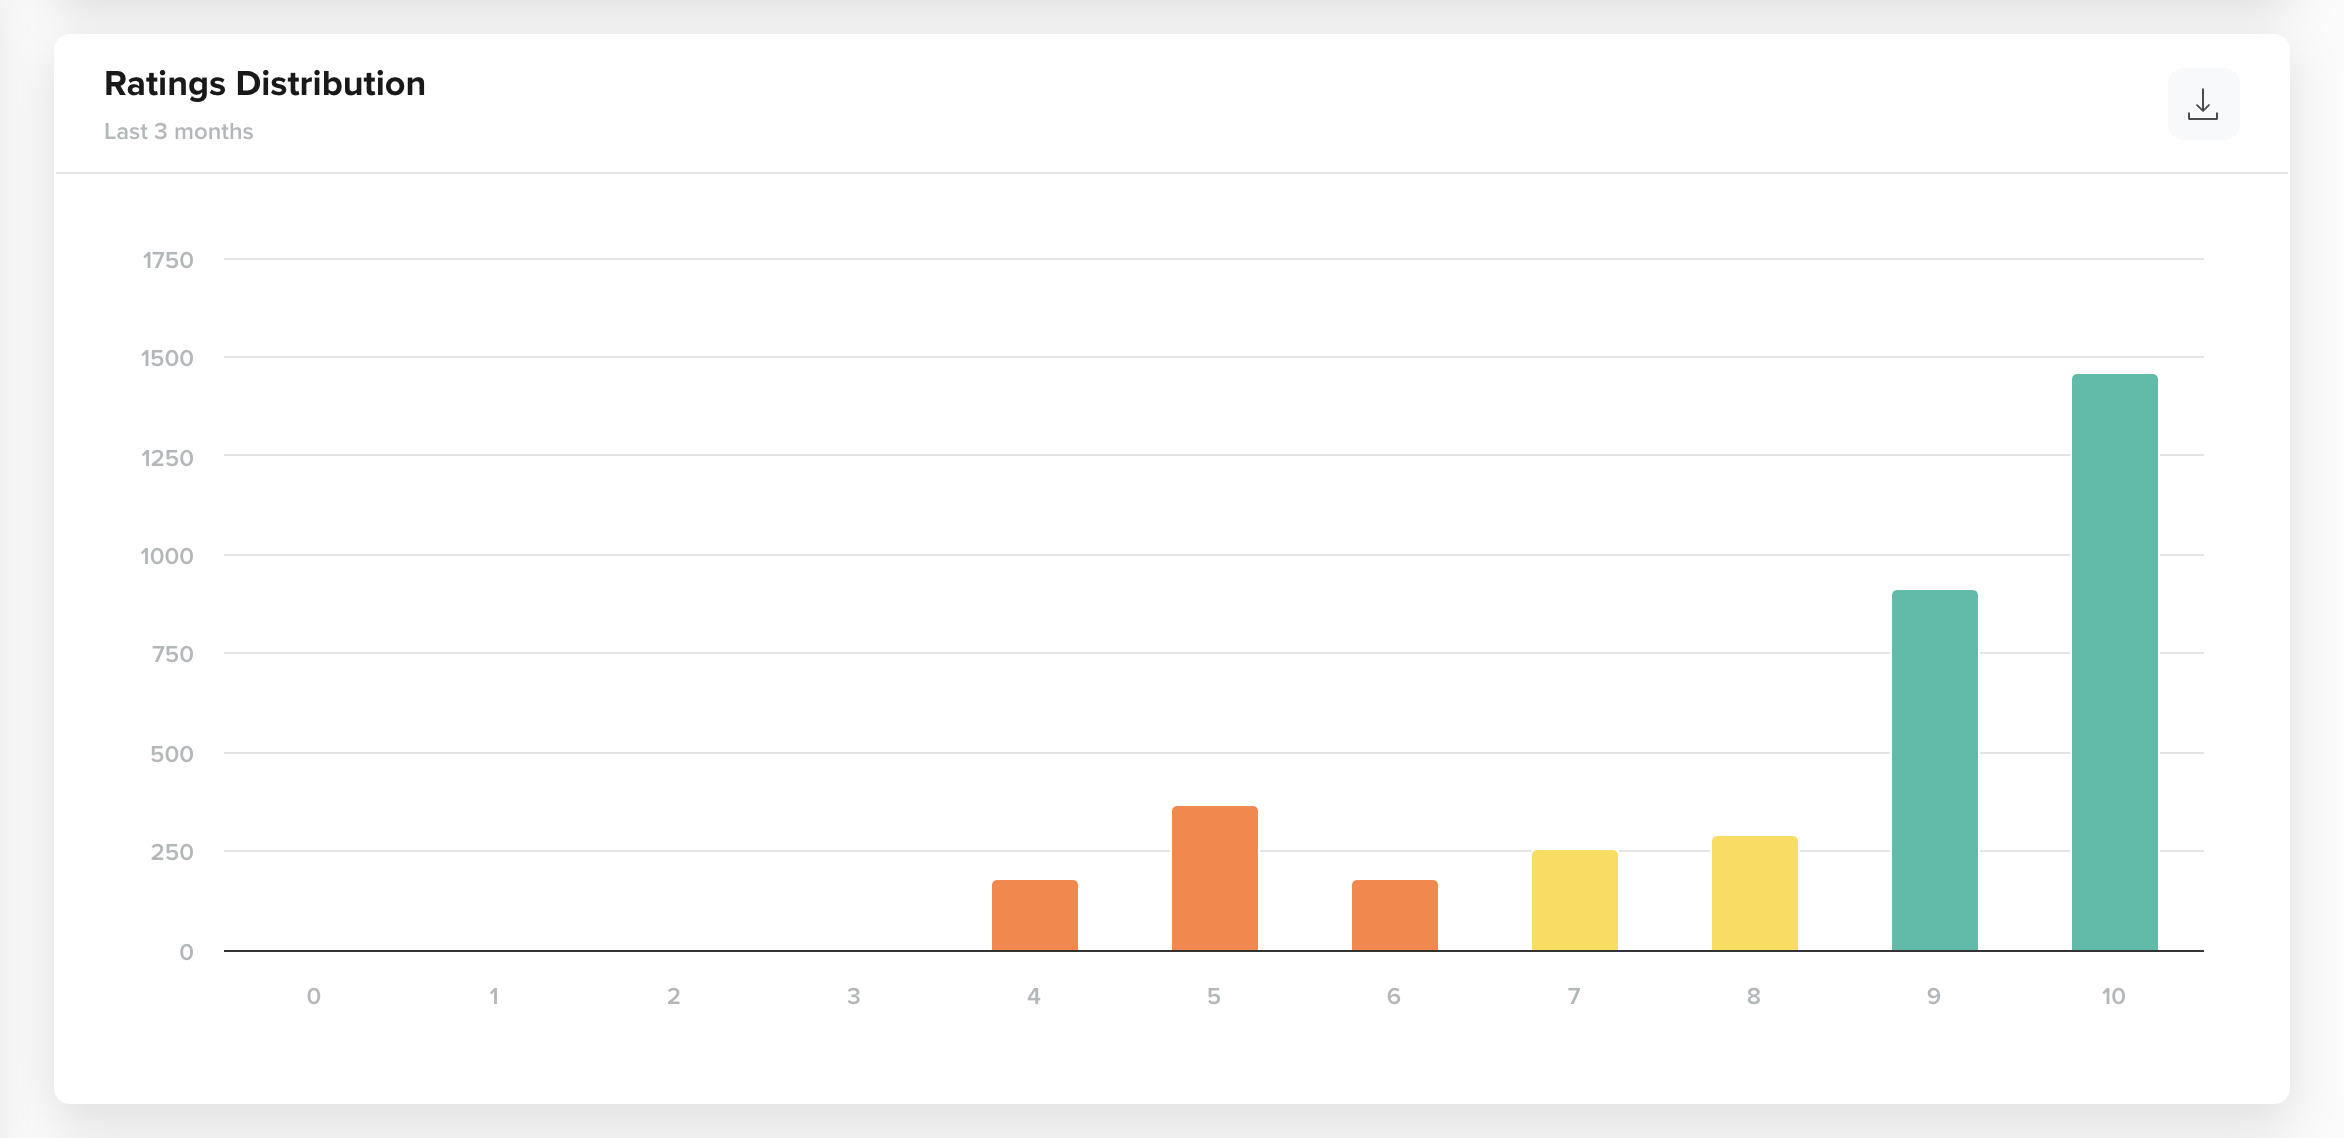
NPS Comparison
Additionally, you can view the trend chart for Total Responses Received daily, weekly, and monthly.

Total User Responses
To understand event-related information in detail, refer to Analysing User Ratings in Analytics.
FAQs
How is the AI summary generated?
CleverTap uses NLP models to detect recurring patterns, sentiments, and themes in comments.
Can I export comments and insights?
Yes. The comments table and filters support export to CSV/Excel. Click the download icon to export data.
Updated 7 months ago