ROI Insights
Learn how to configure, analyze, and interpret ROI Insights for your campaigns from the CleverTap dashboard.
Overview
ROI Insights helps you measure the business impact of your campaigns by connecting engagement performance with defined conversion events. It provides a unified dashboard where you can configure conversion goals, track revenue, analyze campaign-level results, and export actionable insights. ROI Insights enables you to move beyond engagement metrics and measure real business outcomes directly from the CleverTap dashboard.
With ROI Insights, you can:
- Define up to five conversion events that represent your business goals
- Track revenue impact alongside engagement metrics
- Compare campaign performance across segments and filters
- Create custom KPIs for advanced analysis
- Export campaign performance data for reporting
Attribution Model
ROI Insights uses a Last Touch Attribution model to attribute conversions to campaigns and journeys. In this model, attribution is based on the most recent Notification Clicked event prior to a conversion. This means the conversion is credited to the last campaign or journey message node the user clicked before completing the configured conversion event. Attribution does not validate whether a campaign is directly related to the conversion event.
For example, if a user clicks a Shoes Promotion push notification and then purchases an Electronics item within the configured conversion window, the conversion is still attributed to the Shoes campaign because it was the last clicked touchpoint before the conversion.
Data FreshnessROI Insights data is refreshed periodically and may take up to 12 hours to reflect recent campaign activity, conversions, or custom metric updates. Custom metrics may also take additional processing time before appearing in the Engagement Performance Table.
Because attribution is calculated using a Last Touch model, conversion metrics may update only after click and conversion events are processed.
Prerequisites
Before using ROI Insights, you must configure at least one global conversion event in the Schema. These conversion events apply across all campaigns and journeys and are used as the basis for attribution and ROI calculation.
You can configure up to five global conversion events, each with its own filters and conversion window.
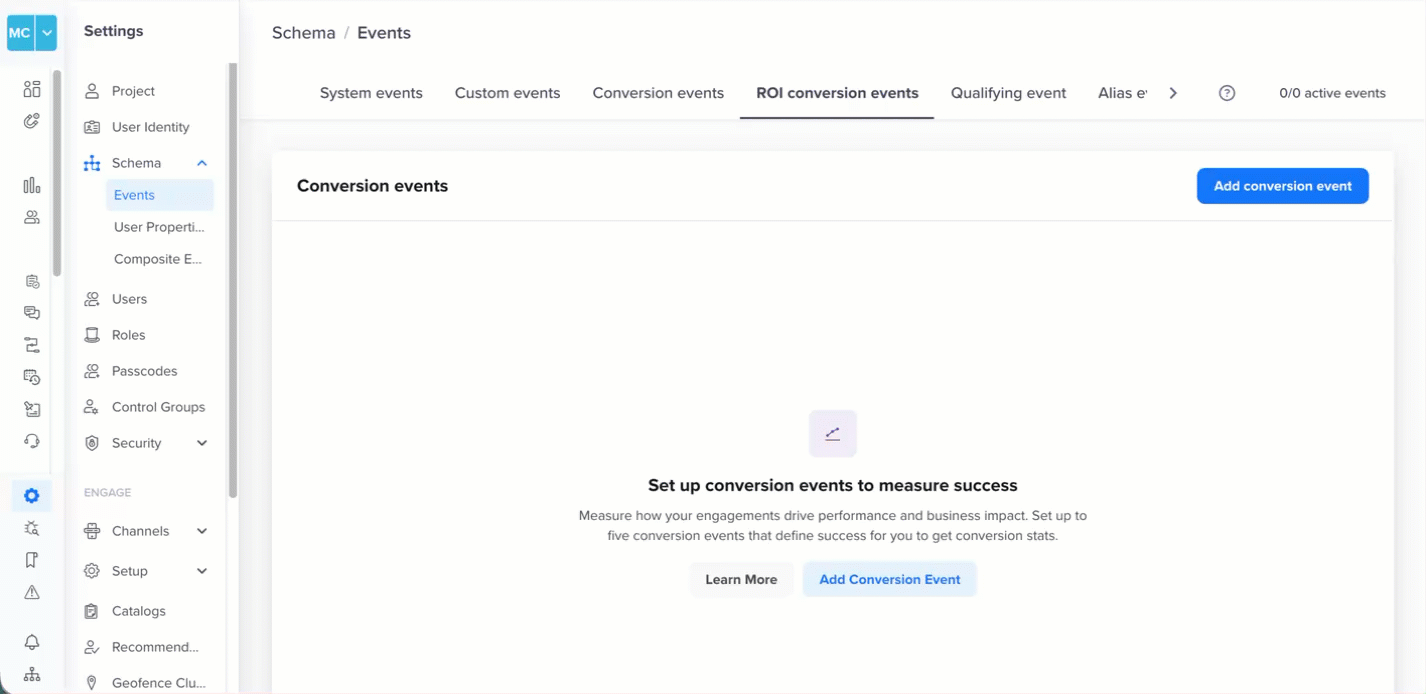
Configure ROI Conversion Events
Before analyzing ROI, you must define what constitutes a conversion for your business. A conversion event represents a meaningful user action, such as a purchase, subscription, booking, or app upgrade. You can configure up to five conversion events.
To add a conversion event:
- Click Add conversion event.
- Select the event from your event schema.
- (Optional) Apply filters to narrow down qualifying conversions.
- Define the conversion window. The conversion window defines the time period during which a user action is attributed to a campaign.
- Click Save.
Impact of Editing or DeletingChanges after editing or deleting a conversion event may take time to reflect in the dashboard. If you delete a conversion event, associated metrics will no longer be visible in ROI Insights.
Understanding the ROI Dashboard
Once conversion events are configured, the ROI dashboard displays campaign performance in two primary sections:
Metric Tiles
Metric tiles provide a summary view of key performance indicators based on your selected conversion event and filters. Use metric tiles to quickly assess overall campaign effectiveness before diving into detailed analysis. These tiles update dynamically based on applied filters, selected conversion event, and selected time range.
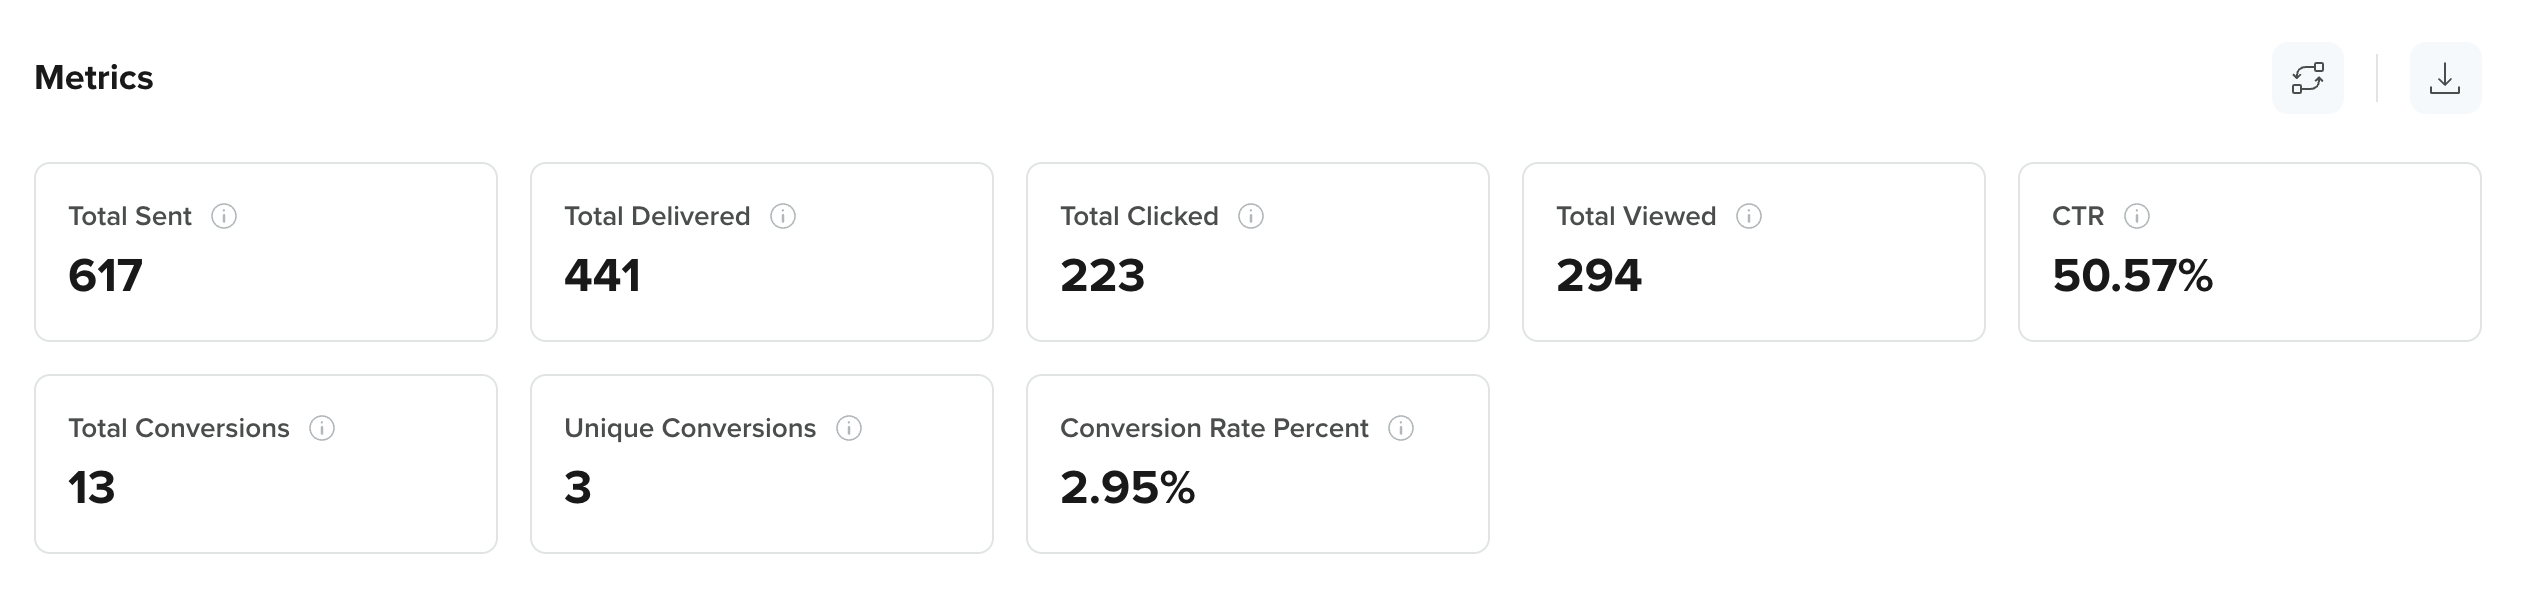
Metric tiles include the following default metrics:
-
Total Sent: The total number of messages that were sent across the selected campaigns within the chosen time range.
-
Total Delivered: The total number of messages successfully delivered to users’ devices or inboxes. For Push Notifications, the delivered count includes push impressions.
-
Total Clicked: The total number of times users clicked on the campaign message.
-
Total Viewed: The total number of times users viewed the message (applicable to channels such as in-app or push where views are tracked).
-
CTR: The click-through rate, calculated as the percentage of delivered messages that resulted in at least one click.
-
Total Conversions: The total number of conversion events attributed to the selected campaigns within the defined conversion window.
-
Unique Conversions: The number of distinct users who completed the configured conversion event, regardless of how many times they converted.
-
Conversion Rate Percent: The percentage of delivered (or eligible) messages that resulted in at least one conversion, based on the configured conversion event and window.
Engagement Performance Table
The engagement table displays campaign-level performance metrics. This table allows you to identify top-performing and underperforming campaigns at a glance.
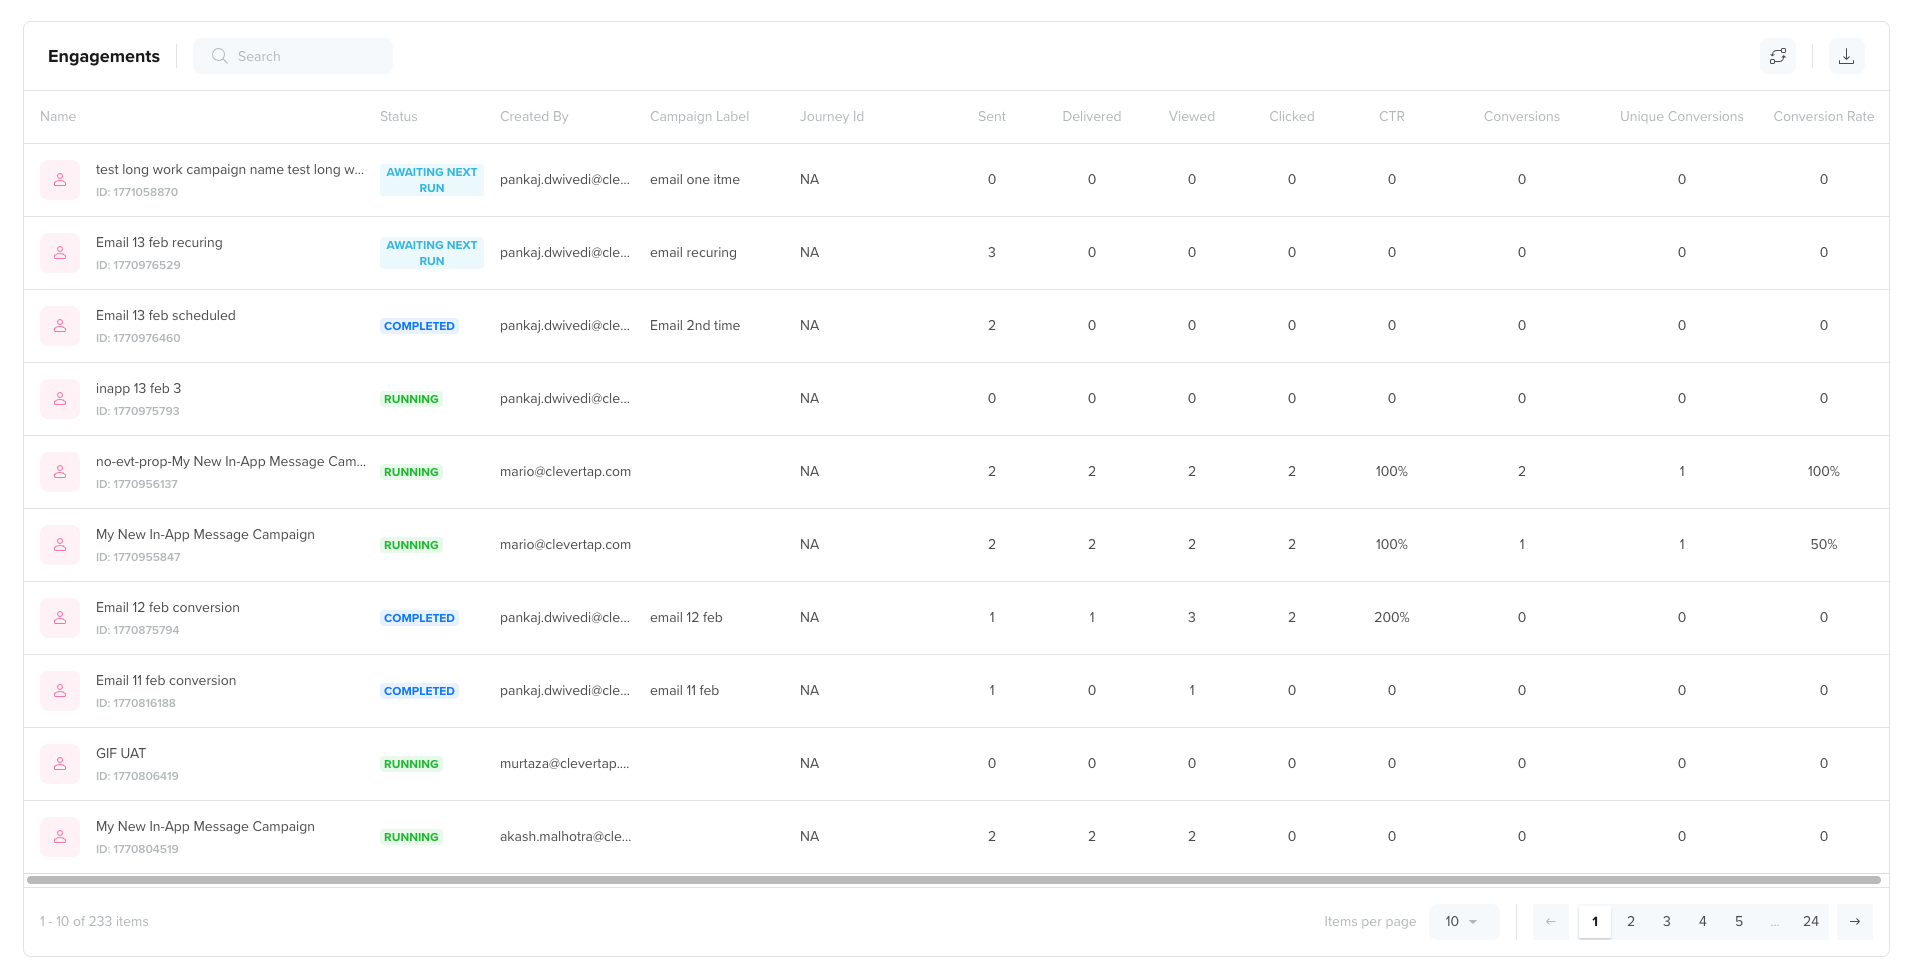
Each row in the table represents a campaign, and the following columns provide detailed performance metrics:
-
Campaign Name: The name of the campaign as defined during campaign creation.
-
Status: The current lifecycle state of the campaign, such as Running, Completed, or Awaiting Next Run.
-
Created by: The user who created the campaign.
-
Campaign Label: The label assigned to the campaign for grouping or categorization purposes.
-
Journey Id: The identifier of the journey associated with the campaign, if applicable.
-
Sent: The total number of messages sent for that specific campaign.
-
Delivered: The total number of messages successfully delivered for the campaign.
-
Viewed: The number of times users viewed the campaign message.
-
Clicked: The total number of clicks generated by the campaign.
-
CTR: The click-through rate for the campaign, calculated as the percentage of delivered messages that resulted in clicks.
-
Conversions: The total number of conversion events attributed to that campaign.
-
Unique Conversions: The number of distinct users who completed the configured conversion event for that campaign.
-
Conversion Rate: The percentage of delivered (or eligible) messages that resulted in a conversion for that campaign.
-
Custom KPIs (if configured): Additional performance metrics defined by your team to track business-specific goals, such as revenue, average order value, or cost per conversion.
Apply Filters
Filters help you narrow down the ROI analysis to specific campaigns, channels, time periods, or owners. When you apply filters, both the metric tiles and the engagement performance table update dynamically to reflect only the data that matches your selected criteria.
Use filters to focus on relevant business questions, such as:
- Which campaigns drove the most revenue this quarter?
- How did email campaigns perform compared to push notifications?
- Which campaign labels generated the highest conversion rate?
- How are running campaigns performing compared to completed ones?
To open the filter panel, click the Filters icon on the left side of the ROI Insights dashboard.
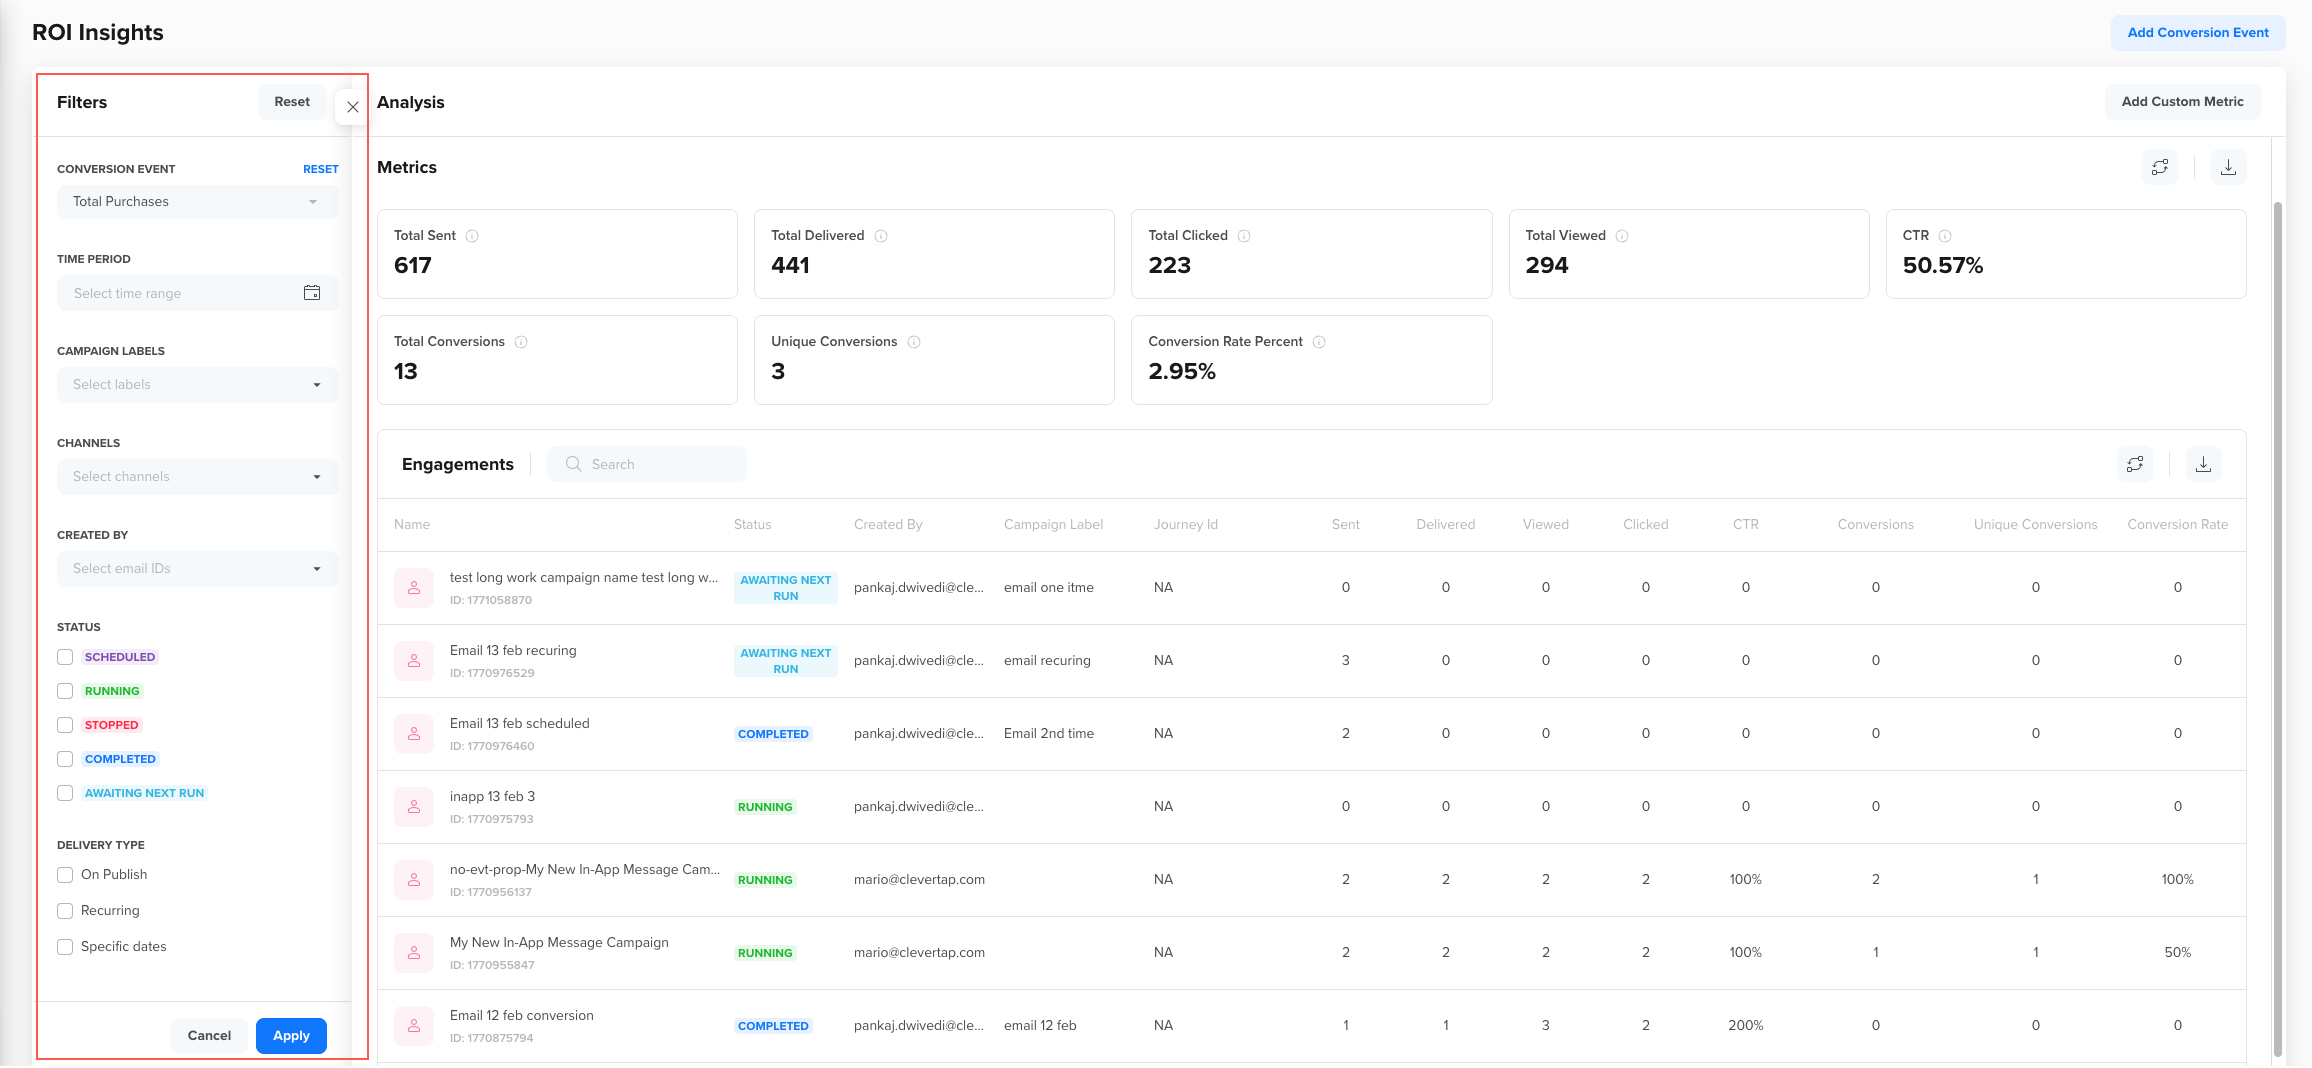
The following filter fields are available:
- Conversion Event: Select the conversion event you want to analyze. The dashboard recalculates conversions, unique conversions, and conversion rate based on the selected event. For example, you can switch between Total Purchases and Subscription Started to compare different business outcomes.
- Time Period: Define the date range for your analysis. All metrics and campaign-level performance data will reflect activity within this selected time window. Use this to analyze monthly performance, quarterly ROI, or specific campaign bursts.
- Campaign Labels: Filter campaigns by labels assigned during campaign creation. This helps you group and analyze campaigns by themes such as Promotional, Onboarding, Festive Sale, or Re-engagement.
- Channels: Filter campaigns by channel type, such as Email, Push, In-App, SMS, or other supported channels. This allows you to compare ROI performance across communication channels.
- Created By: Filter campaigns based on the user who created them. This is useful for team-level performance tracking or ownership-based reporting.
- Status: Filter campaigns by lifecycle status, such as Scheduled, Running, Stopped, Completed, or Awaiting Next Run. This helps you evaluate active campaigns separately from historical ones.
- Delivery Type: Filter campaigns by delivery type, such as On Publish, Recurring, or Specific Dates. This allows you to compare always-on campaigns with time-bound campaigns.
After selecting your required filters, click Apply to update the dashboard.
Custom Metrics
Custom Metrics let you create derived metrics from the engagement and conversion data available in the ROI dashboard. These metrics help you track business-specific performance indicators that are not available as default tiles or table columns. Custom KPIs are especially useful when your definition of success goes beyond basic engagement or conversion metrics.
Once created, custom metrics appear as additional columns in the Engagement Performance Table and can be used alongside standard metrics such as Sent, Delivered, Conversions, and Conversion Rate.
Use Custom Metrics to:
- Compare revenue generated per delivered message
- Measure cost-efficiency metrics such as cost per conversion
- Calculate engagement-to-conversion ratios
- Create internal performance benchmarks aligned to your business goals
How Custom Metrics Work?
Custom Metrics are built using formulas based on available campaign-level metrics. You can combine these metrics using supported mathematical operators to compute ratios, averages, or derived values. Custom KPIs are calculated dynamically and update automatically when filters or conversion events are changed.
The following examples illustrate how Custom Metrics can be used to derive meaningful business insights from campaign performance data.
| KPI Name | Formula | What does it help you measure? |
|---|---|---|
| Revenue per Delivered Message | Total Conversions Revenue / Delivered | The average revenue per delivered message helps you evaluate message-level monetization efficiency. |
| Conversion per Click | Conversions / Clicked | How effectively user clicks translate into conversions, helping you assess post-click performance. |
| Revenue per Campaign | Total Conversions Revenue | The total revenue contribution of each campaign enables direct comparison across campaigns. |
| Cost Efficiency Benchmark | Revenue / Cost | The return generated for every unit of campaign spend helps you evaluate overall campaign profitability and ROI. |
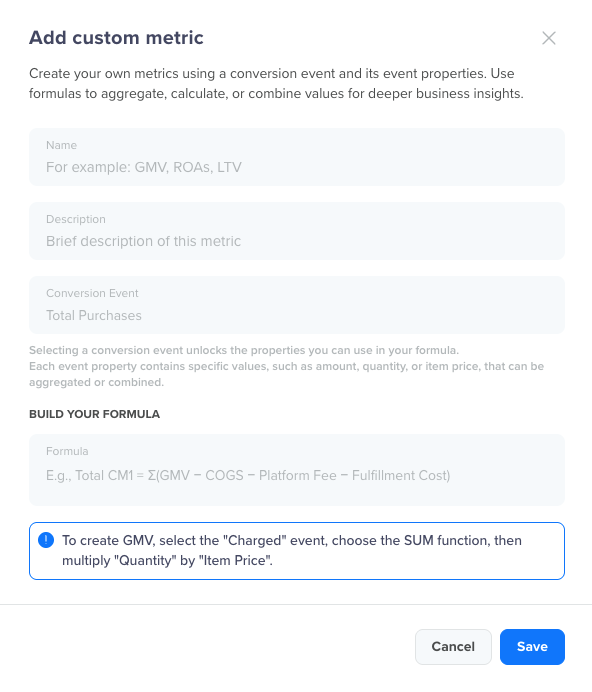
Create a Custom Metrics
To create a custom metric:
-
Click Add Custom Metric in the top-right corner of the ROI dashboard.
-
Enter a clear and descriptive name for the KPI.
-
In the formula builder, select a metric from the dropdown.
-
Combine metrics using supported operators.
-
Click Save.
Formula Functions
When creating a Custom Metric, you can use predefined event-level and property-level functions to build meaningful business metrics. These functions must always be written in uppercase.
Event-Level Functions
These functions operate on the selected event and measure its frequency or user participation:
- TOTALS: Counts every occurrence of the selected event during the chosen time period. For example, if an event such as
Video Playedoccurred 12,000 times, TOTALS returns 12,000 even if the same user triggered the event multiple times. - UNIQUES: Counts the number of distinct users who performed the selected event. For example, if 2,000 unique users triggered the event, UNIQUES returns 2,000; each user is counted only once, regardless of how many times they performed the event.
- AVERAGE: Shows the average number of times each unique user performed the selected event. For example, if 3,000 users triggered the event 15,000 times in total, AVERAGE returns 5 events per user. This can also be derived using TOTALS / UNIQUES.
Property-Level Functions
Property-level functions operate on numeric event properties such as revenue amount, duration, quantity, or price. These functions are available only when a numeric event property is selected.
- PROPSUM: Adds up the total value of the selected numeric event property across all event occurrences. For example, if you select the
amountproperty for a purchase event, PROPSUM returns the total revenue generated in the selected period. - PROPAVG: Calculates the average value of the selected numeric event property per event occurrence. For example, if you select the
durationproperty for a video event, PROPAVG returns the average watch time per video play. This can also be derived using PROPSUM / TOTALS.
Formula Guidelines
When creating a custom metric, keep the following in mind:
- You can combine available metrics using operators such as +, -, *, /, and parentheses ().
- You can compare up to four formulas in the same configuration by separating them with a semicolon (;).
- The formula must be mathematically valid.
- KPI names should clearly describe the metric being calculated.
- Custom Metrics are calculated per campaign row in the table.
- KPI values are updated dynamically based on selected filters, the conversion event, and the time range.
Best Practices
Follow these best practices to ensure that your ROI analysis remains accurate, actionable, and aligned with your business objectives
- Define conversion events aligned with business goals.
- Use revenue events when analyzing financial impact.
- Apply filters before drawing conclusions.
- Limit custom metrics to meaningful business metrics.
- Regularly review and refine conversion windows.
FAQs
Find answers to the following common questions about using ̉ROI Insights:
How many conversion events can I configure?
You can configure up to five conversion events.
Can I track revenue without defining a revenue property?
No. Revenue metrics require a numeric property associated with the conversion event.
Do filters affect exports?
Yes. Exports reflect the current filter and conversion event selection.
Can I compare multiple conversion events at once?
ROI Insights allows switching between configured conversion events, but metrics are displayed for one selected conversion event at a time.
What attribution model does ROI Insights use?
ROI Insights uses a Last Touch Attribution model based on the most recent Notification Clicked event prior to conversion.
Can I use a different attribution model?
No. Only Last Touch Attribution is supported in this version. Alternative attribution models, such as first-touch or time-decay, are not available.
Are conversion goals campaign-specific?
No. ROI Insights uses globally configured conversion events across all campaigns and journeys.
Updated about 2 months ago