Boards 2.0
Learn how to create boards to monitor key metrics, track performance, and share insights across your team, all in one place.
Overview
A Board is a configurable view of tiles from different analyses, such as Trends, Funnels, Pivots, Cohorts, and Flows, bringing together multiple analyses into a single, shareable view. Instead of navigating between different reports, you can monitor key metrics as visual tiles on a Board.
When working with product analytics, you often end up juggling multiple reports across different tabs; a Trends chart here, a Funnel analysis there, and a Cohort table somewhere else. Boards solve this by bringing all your analyses into a single, shareable view.
Boards are useful for anyone who regularly monitors performance metrics. For example, product managers tracking feature adoption, marketers reviewing campaign funnels, growth teams analyzing retention, or executives reviewing KPIs. If you are sending screenshots of charts over chat, Boards are for you.
With Boards 2.0, you can:
- Create and manage multiple boards, each tailored to a specific goal or team
- Add analysis tiles from Trends, Funnels, Pivots, Cohorts, and Flows
- Apply date range and segment filters that dynamically update supported tiles at once
- Share boards with configurable access levels (view-only or edit) without anyone needing to rebuild the analysis themselves.
- Interact with tile data, hover, compare, and explore directly on the board, without switching between analysis screens
Public BetaThis feature is released in Public Beta. For more information or questions, contact your Customer Success Manager or the CleverTap Support.
Create a Board
Creating a board gives you a blank canvas to start organizing your analyses. You can create as many boards as you need, be it one per team, product area, or campaign.
For example, suppose you are a product manager for an e-commerce app. You can create a board called Checkout Performance to track add-to-cart rates (Trends), checkout drop-off steps (Funnels), and repeat purchase behavior (Cohorts), all in one view that your team can access any time.
To create a new board:
- Go to Analytics > Boards Beta from the CleverTap dashboard.
- Click Create Board.
- Enter a descriptive Board name.
- Click Create.
Create a Board
The board opens immediately as an empty dashboard, ready for you to add tiles.
Best Practice for Naming a BoardUse specific, descriptive board names from the start. A name like July Acquisition is more useful than Board 1, especially when you have multiple boards.
Manage Boards
Once you have boards set up, you can perform several management operations to keep your boards page organized. These options are available from the board menu, accessed by clicking the ![]() icon in the top-right corner of any board.
icon in the top-right corner of any board.
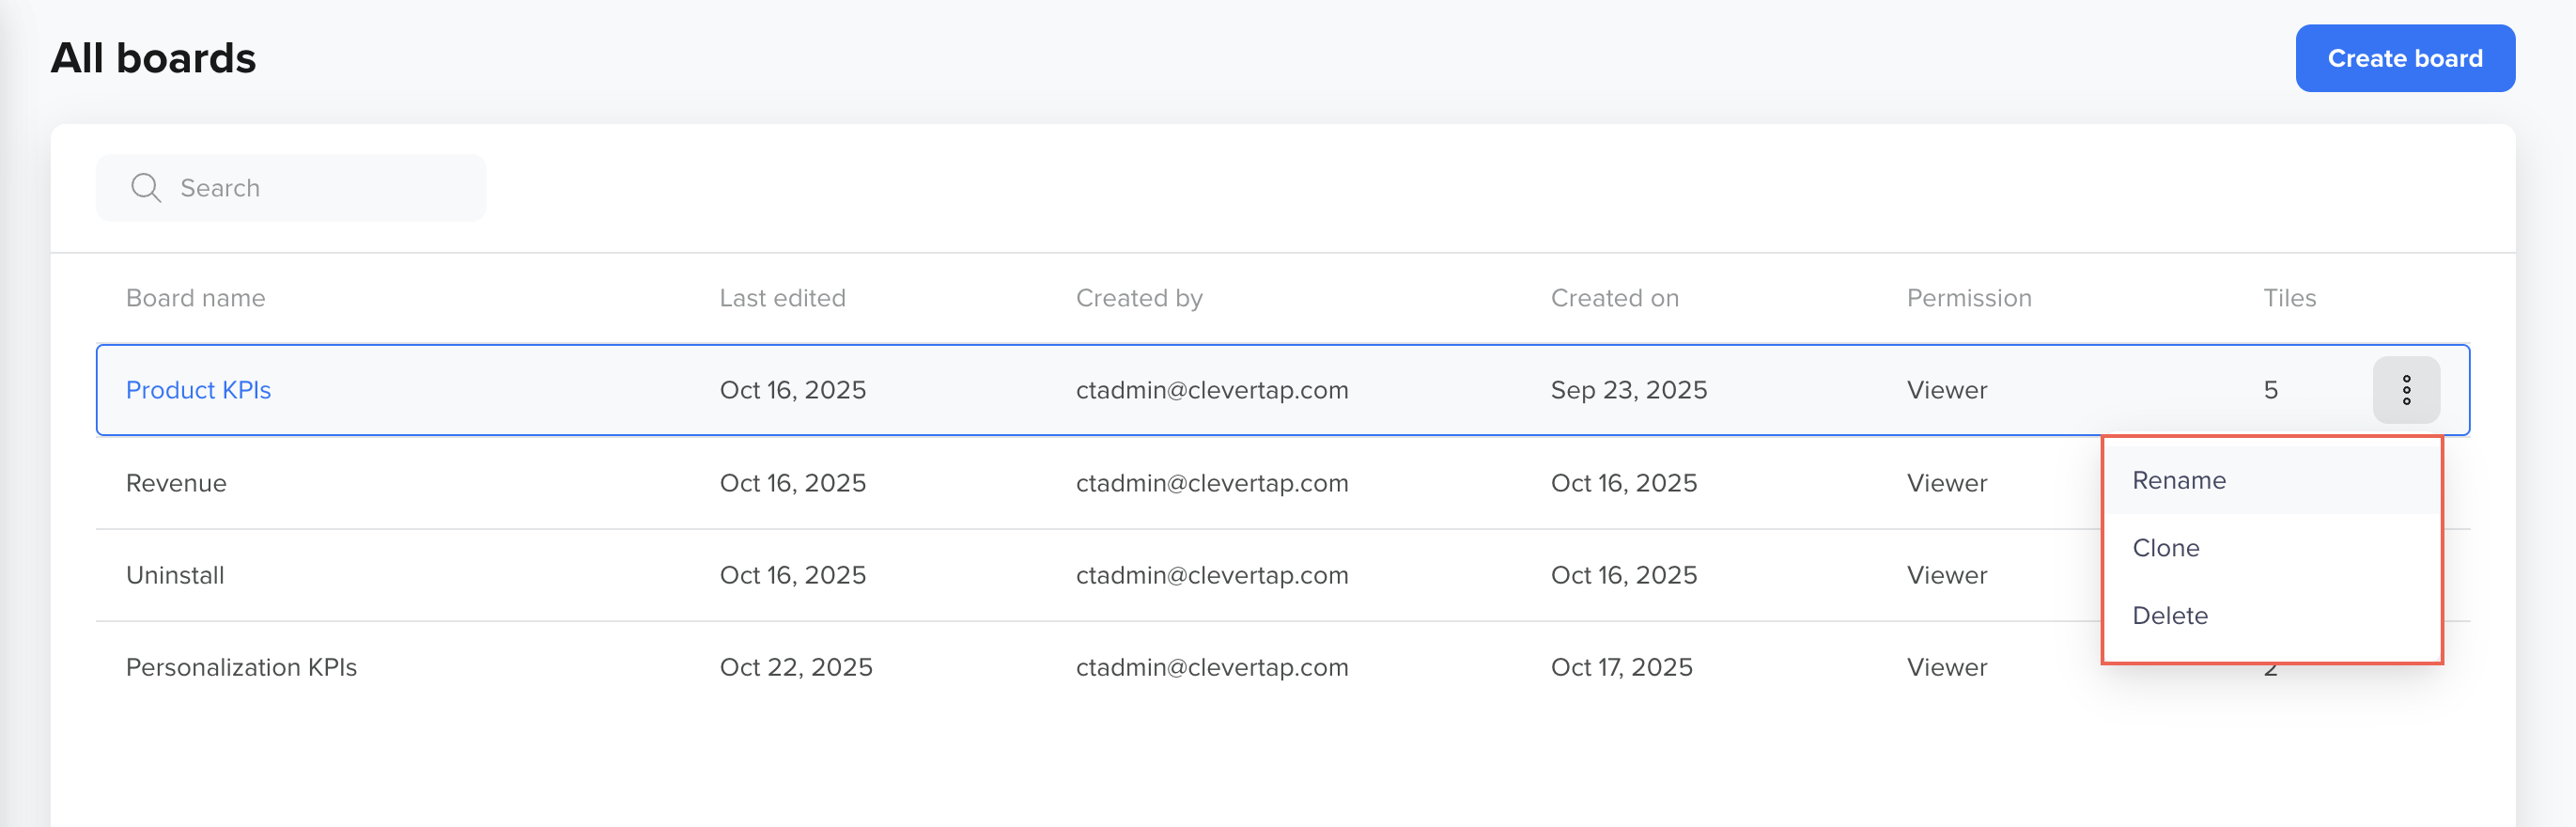
Board Operations
- Rename: Update the name of an existing board at any time. This is useful when a board's focus evolves. For example, renaming Q2 Funnel Review to Q3 Funnel Review at the start of a new quarter.
- Clone: Create an exact copy of a board, including all its tiles and configurations. Cloning is helpful when you want to reuse a board structure for a different time period, region, or audience segment without rebuilding it from scratch. The cloned board appears in your board list with a Cloned prefix. You can then rename it as needed.
- Delete: Permanently remove a board and all its tiles. This action cannot be undone, so use it only when the board is no longer needed.
NoteWhen you clone a board, you become the owner of the cloned copy, regardless of who owned the original. You will have full edit and delete permissions on the clone.
Share Boards
Sharing a board lets your teammates view or collaborate on the same set of analyses without needing to set up their own. This is especially useful for cross-functional reviews, stakeholder reporting, or async collaboration.
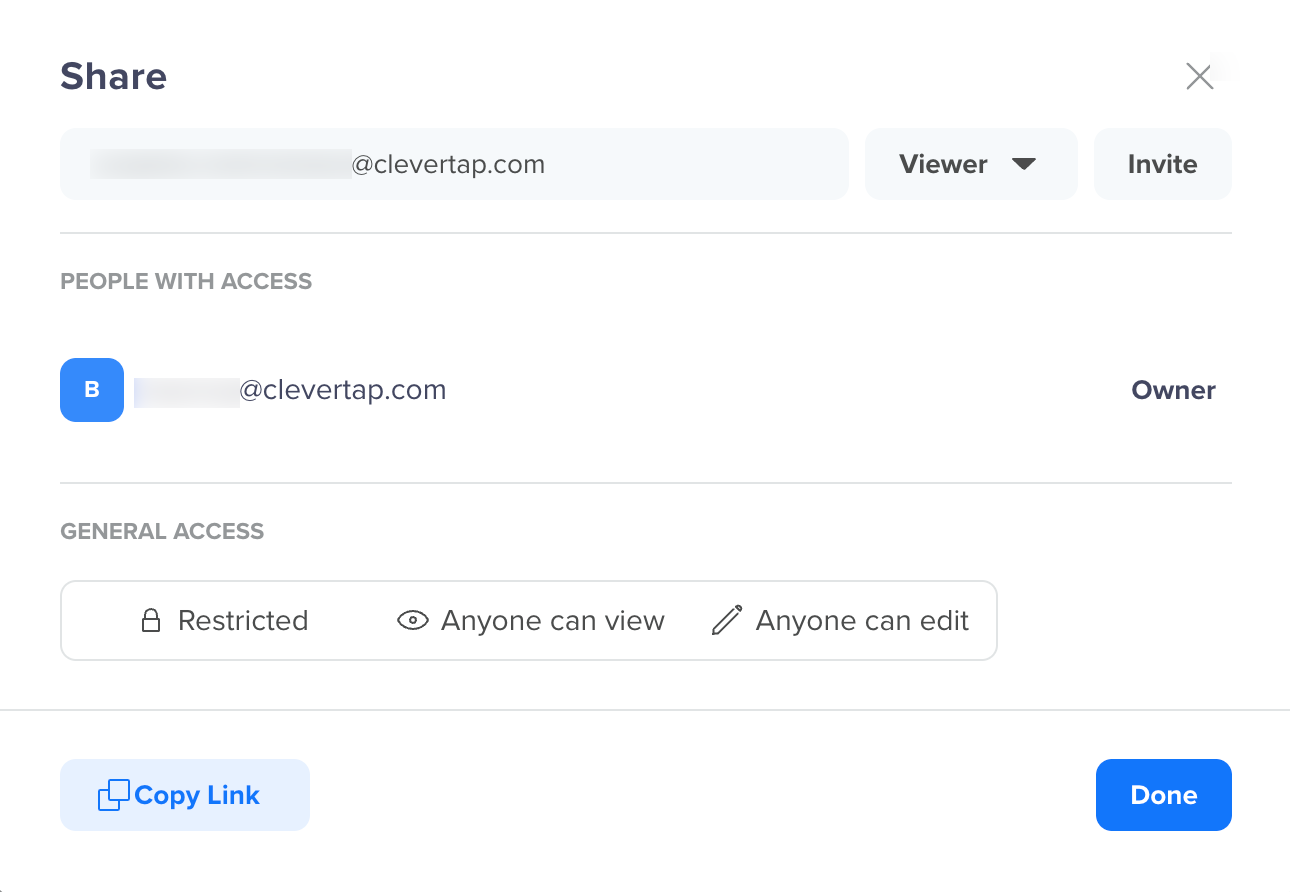
To share a board:
- Click the
 icon of the board you want to share.
 - In the Share modal, either:
- Add users by entering their email addresses, or
- Copy the board link to share directly via chat, email, or documents.
- Assign an access type for each invited user.
- Click Done.
Share a Board
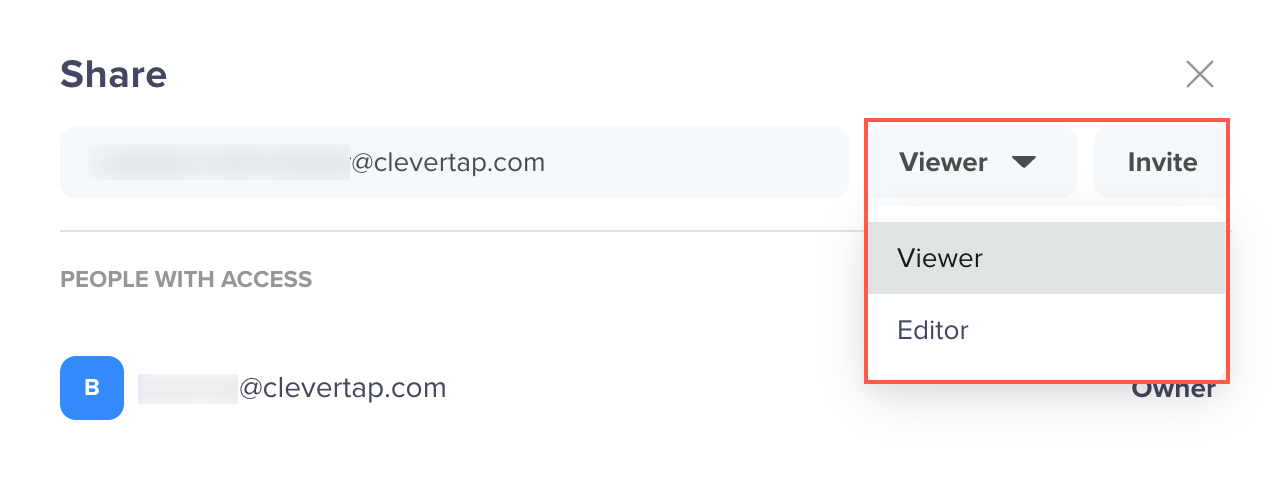
Access Type
When inviting users to a board, you control what they can do with it using the following options:
- Viewer: A Viewer can open the board, explore tile data, hover over data points, and apply filters for their own session. However, they cannot make any permanent changes, add, edit, rename, or delete tiles, and modify board settings. Viewer access is best for stakeholders, executives, or anyone who needs to consume insights but not modify the board.
- Editor: An Editor has full access to modify the board. They can add and remove tiles, rename tiles, apply saved filters, and change board settings. Editors can also invite other users. Editor access is best for teammates who are actively contributing to or maintaining the analysis.
Access Types on a Board
Visibility Settings
Beyond individual invites, you can set a board's overall visibility to control who can discover and access it using the following options:
- Restricted (default): Only users explicitly invited can access the board. It will not appear in search or directory listings for others. This is the most secure setting and is recommended for sensitive or work-in-progress boards.
- Anyone can view: Any user in your organization with the link can open and view the board, without needing an explicit invite. They are automatically granted Viewer access. The board may also appear in shared directories.
- Anyone can edit: Any user in your organization with the link can view and edit the board. Use this setting carefully. It is best suited for highly collaborative boards where the entire team is expected to contribute.
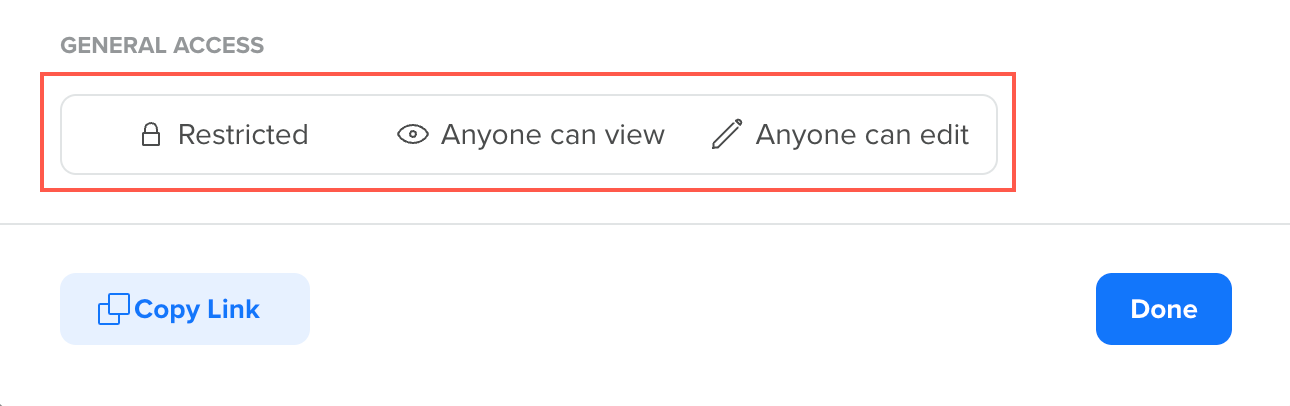
Visibility Settings for a Board
ImportantChanging a board from Restricted to Anyone can view or Anyone can edit immediately grants access to all users who have the link or the edit access. If the board contains sensitive data, confirm with your team before changing visibility.
Copy Board Link
For quick sharing without going through the full invite flow, you can copy a direct link to the board.
- Click Copy link in the Share modal.
- Paste and share the link via your preferred channel (Slack, Email, etc.).
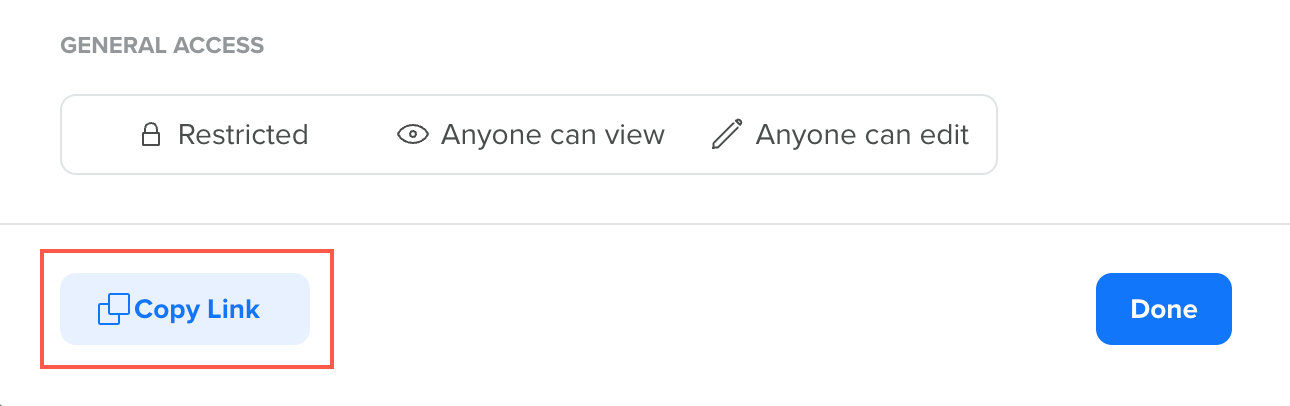
Copy Link to Share a Board
Recipients view the board based on its current visibility setting. If the board is set to Restricted, only users who have already been invited can open the link.
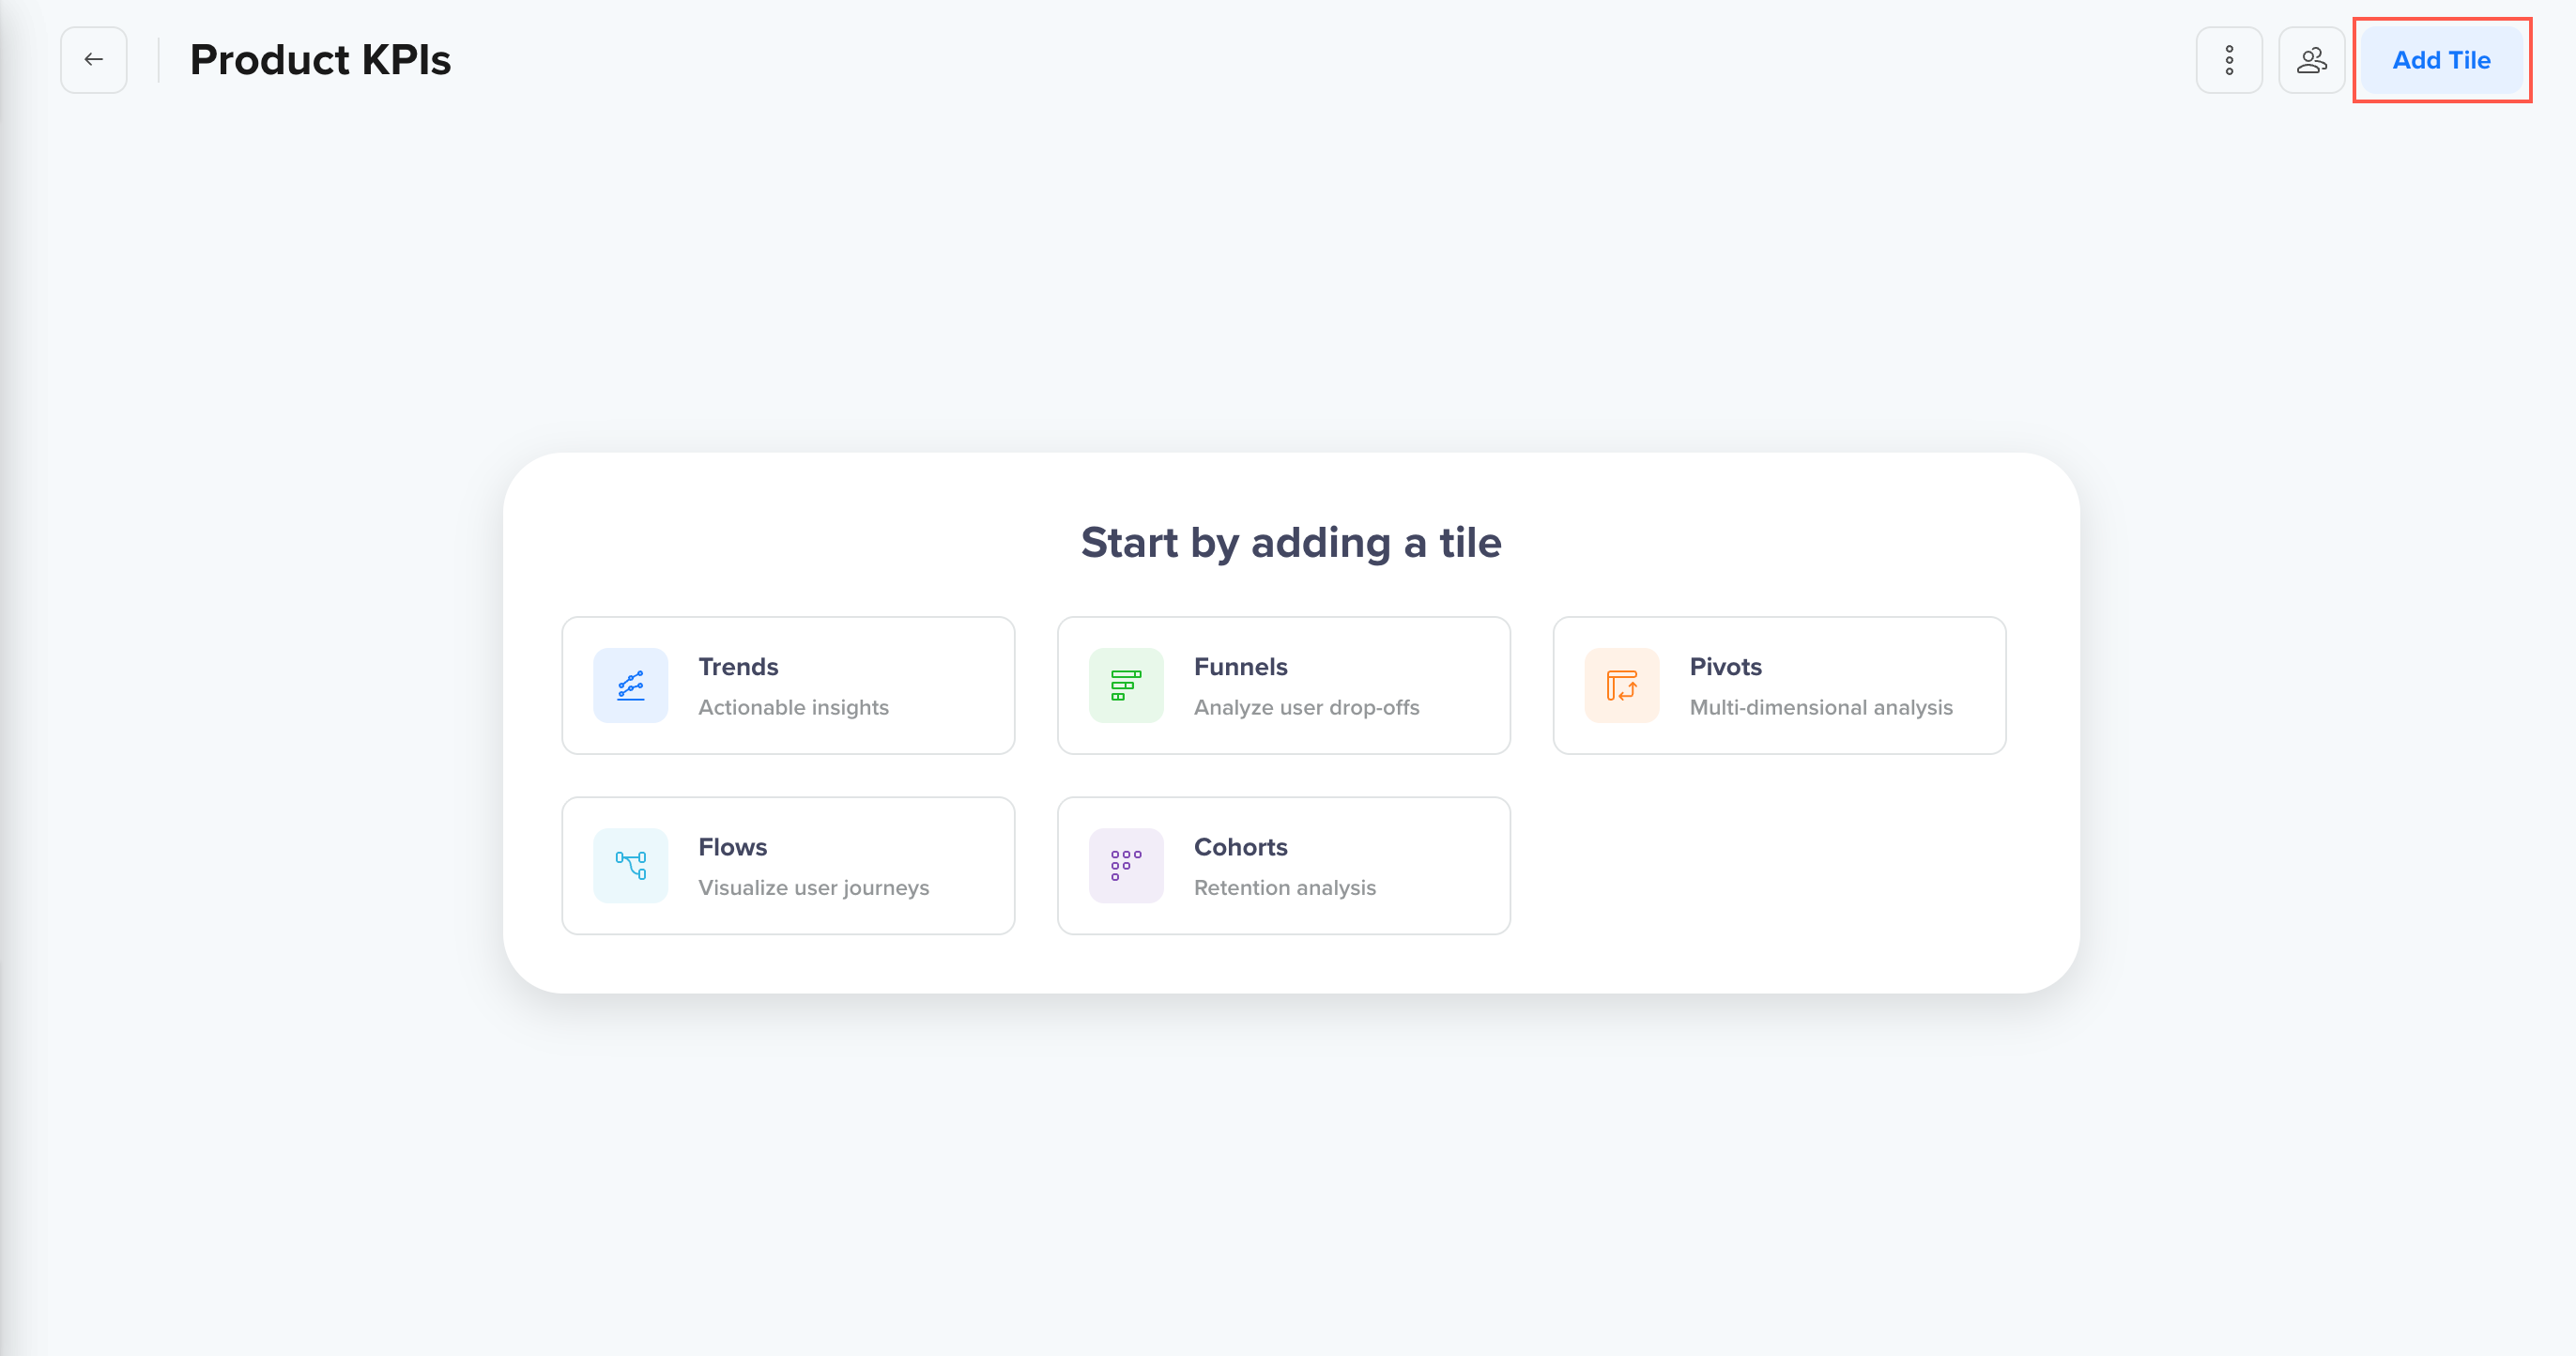
Add a Tile to a Board
Tiles are the building blocks of a board. Each tile represents a saved visualization or table from one of the supported analysis types. You can add as many tiles as you need, mix different analysis types on the same board, and rearrange them to suit your layout.
You can add a tile to a board both from within the individual analysis screens (e.g., Trends, Funnels) or from the board itself. Once added, the tile appears on the board and reflects the configuration you set in the analysis when you added it.
For example, if you want to build a Trends analysis tracking daily active users over the past 30 days and want to add it to your Product Health board:
- Click Add Tile from a Board.
- Select Trends and configure your analysis query (events, filters, chart type, date range, etc.).
- Click View Analysis.
- Once the analysis is loaded, click Save.
- Select the target board (e.g., Product Metrics) from the dropdown. If you have not created a board yet, you can create one inline.
- (Optional) Enter a Tile name (e.g., Daily Active Users in Last 30 Days).
- Click Save.
Add Tile to a Board
You can add tiles from any of the following analyses:
| Anlysis | What it shows on the board |
|---|---|
| Trends | Line, bar, pie, or number charts of event metrics over time |
| Funnels | Conversion rates across sequential steps |
| Pivots | Tabular breakdowns of metrics by properties |
| Cohorts | Retention tables for user groups over time |
| Flows | User path visualizations between events |
ImportantEach tile reflects the exact configuration applied in the analysis at the time it was added, including events, filters, breakdown properties, and chart type. If you later modify the original analysis, the tile does not automatically update unless you re-add it or edit it from the board.
Explore Data on Tiles
You do not need to leave the board to dig into your data. Each tile supports direct interaction, so you can explore metrics in context.
For example, you can:
- Hover over any data point to view a detailed tooltip with exact values, dates, and segment breakdowns.
- Compare metrics visually across time periods or user segments without switching tabs.
This in-board interactivity is especially useful during team reviews or when presenting data live, as you can explore the data without losing the board context.
Apply Filters
Board-level filters let you update data across all supported tiles simultaneously, without reconfiguring each tile individually. This makes it easy to slice the same board for different time periods, geographies, user segments, or other dimensions.
When you apply a filter, all supported tiles update dynamically, and you will see the charts and tables refresh to reflect the filtered data in real time. No page reload is required.
Boards support the following two types of filters:
Each filter targets a different dimension of your data. You can apply one or both at the same time to narrow down what is displayed across the board.
Date Range
Restrict all tile data to a specific time window. For example, on a Product Metrics board, you might apply a date range of March 1 to March 31 to view all tile data scoped to March.
Filter Board Data for a Date Range
You can select preset ranges (Last 7 days, Last 30 days, etc.) or a custom date range.
Segment
Filter tiles by a defined user segment. For example, applying a Churn After Purchase segment to the board will update all supported tiles to show data only for users on mobile devices.
Filter Board Data for a Segment
Segments must be pre-configured in your workspace before they can be applied here.
Filter Behavior by Tile Types
Not all tiles respond to board-level filters. Some tiles behave differently depending on what board-level filter is applied.
The table below shows how board-level filters respond to the board-level filters:
| Tile Type | Responds to Date Filter | Responds to Segment Filter |
|---|---|---|
| Trends, Funnels, Pivots, Cohorts | Yes | Yes |
| Flows | No | No |
| Segment | Yes | No |
Tile Operations
Each tile on a board has its own set of actions, accessible from the tile menu. These actions let you manage individual tiles without affecting the rest of the board.
You can perform the following operations on a tile:
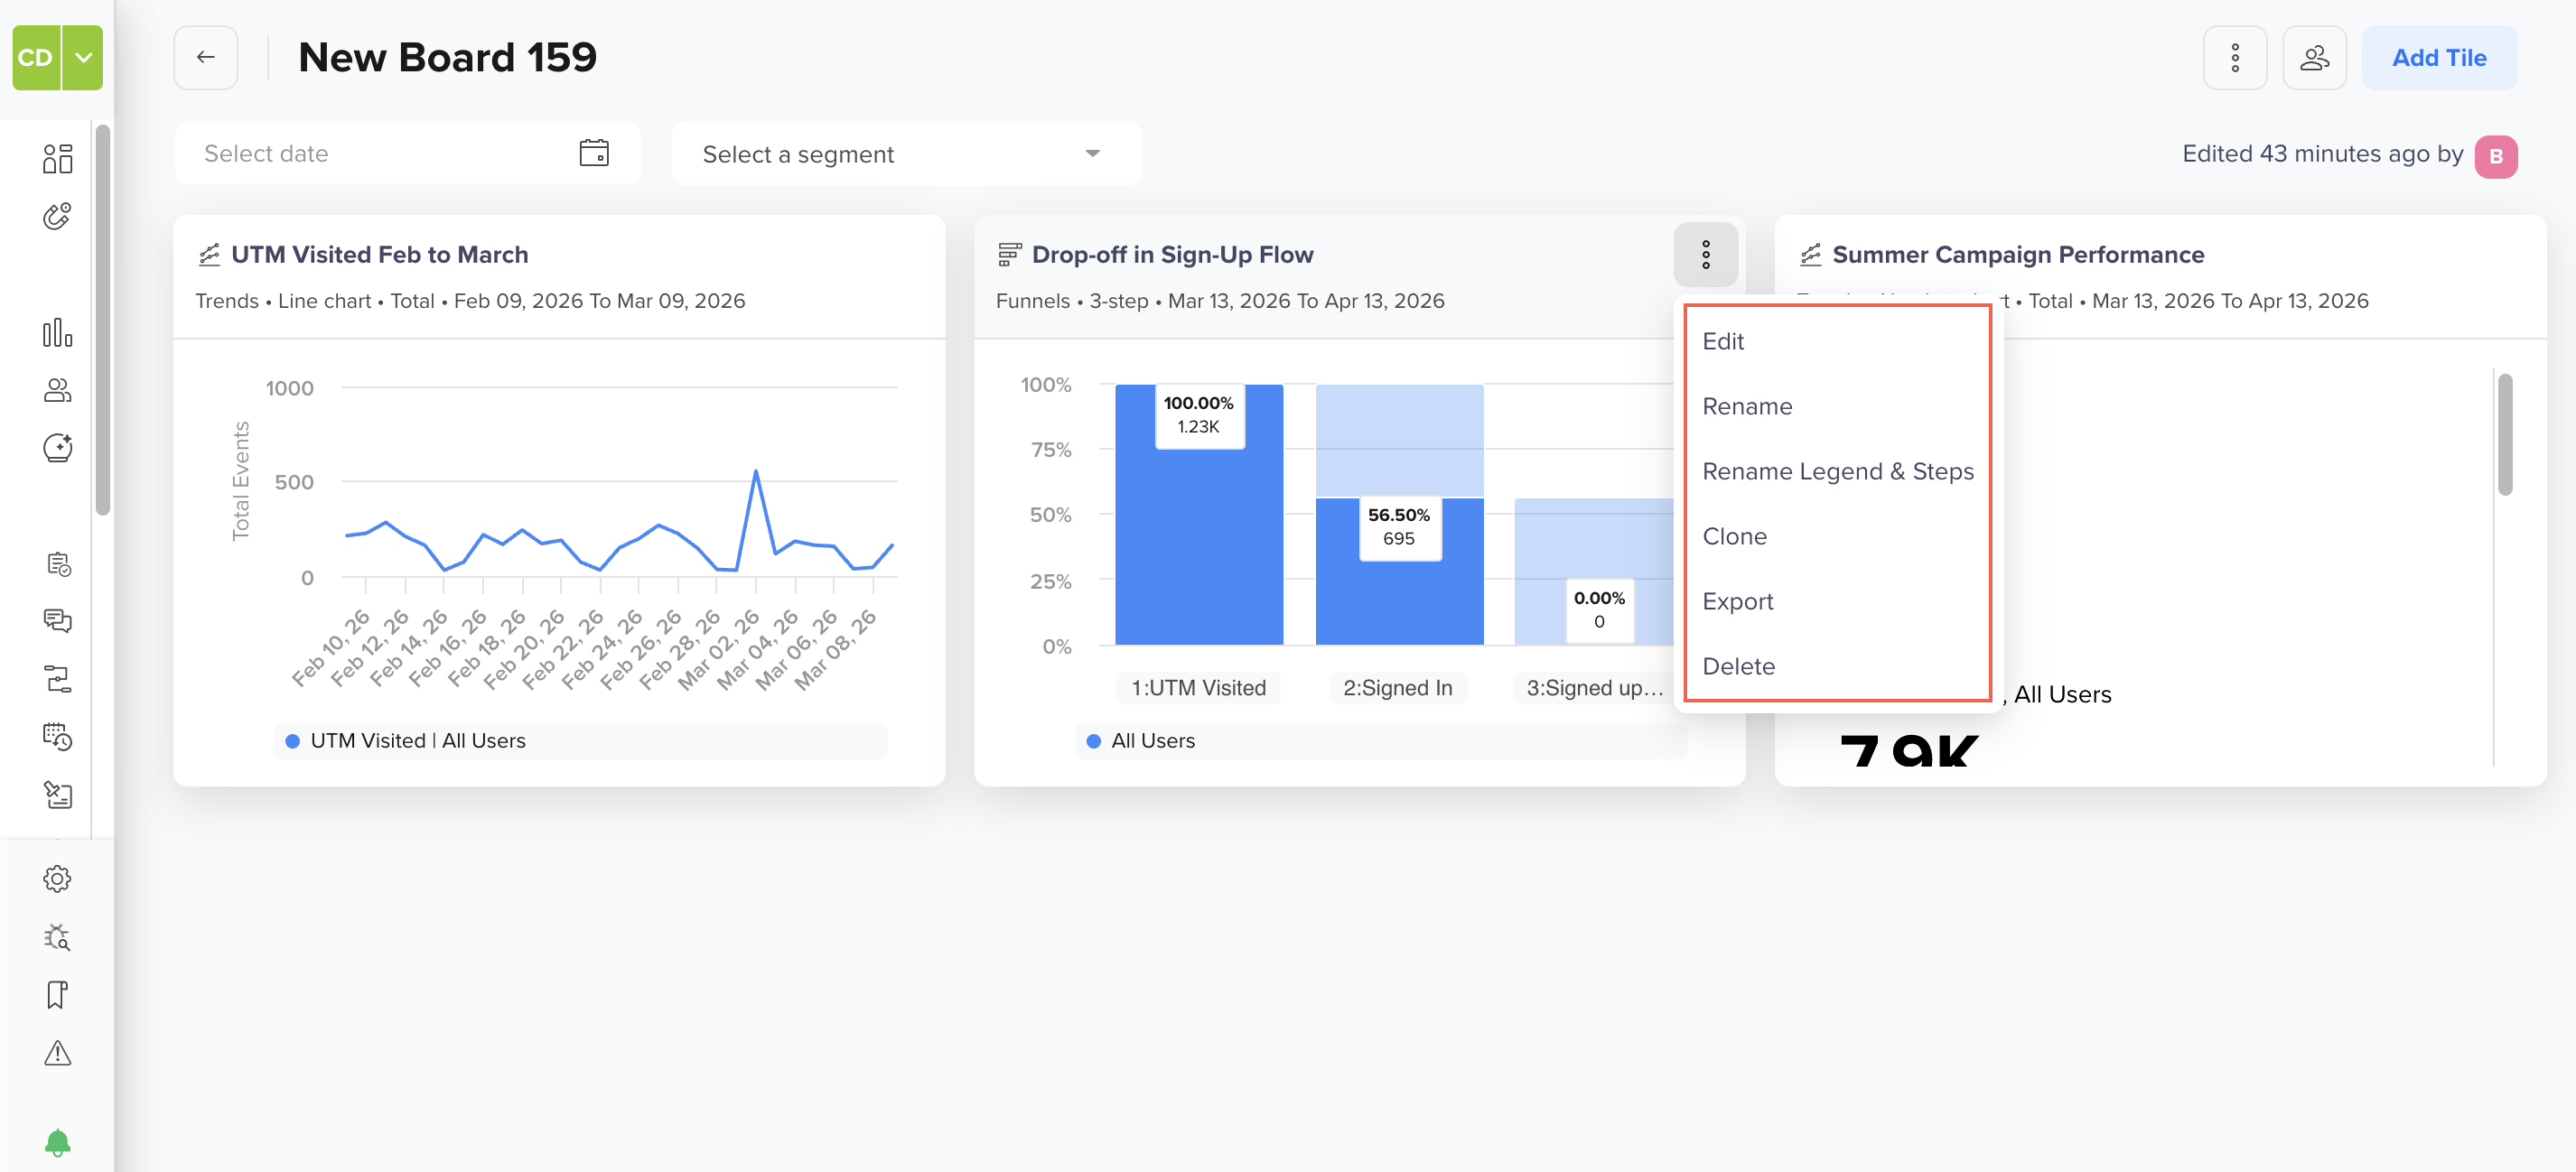
Tile Operations in a Board
Edit
Opens an underlying analysis (e.g., Trends or Funnels) in edit mode, where you can change events, filters, date ranges, or chart types. Once you save, the tile on the board updates to reflect your changes.
Use Edit when the tile configuration needs to change. For example, adding a new event to a Trends chart.
Rename
Updates a tile's display name as it appears on the board. This does not affect the underlying analysis name.
Use Rename when the default analysis name is not descriptive enough for the board context. For example, rename Untitled Trends to Weekly Signups by Channel.
Rename Legend
Updates the legend labels shown on the tile's chart. This is useful when default event or property names are too technical or ambiguous for a broader audience.
Use Rename Legend when presenting boards to non-technical stakeholders who may not recognize internal event naming conventions.
Clone
Creates a duplicate of the tile on the same board. The cloned tile retains all configuration from the original and can be edited or renamed independently.
Use Clone when you want to create a variant of an existing tile. For example, cloning a Trends tile and editing it to compare a different user segment.
Export
Downloads a tile's data as a file for offline use or sharing. Export format may vary by tile type (e.g., CSV for tables, image for charts).
Use Export when you need to share a specific chart or table with someone outside the platform, or include it in a presentation or report.
Delete
Removes a tile from the board permanently. This does not delete the original analysis, and only the tile instance on the board is removed.
NoteDeleted tiles cannot be restored. If you accidentally delete a tile, you will need to re-add it from the original analysis.
Example Use Case: Monitoring Campaign Performance
Here is a practical end-to-end example of how you might use Boards 2.0 to monitor a marketing campaign:
- Create a board called Summer Campaign Performance.
- Add the following tiles:
- A Trends tile tracking daily click-through rates from campaign emails
- A Funnel tile showing drop-off at each step of the sign-up flow
- A Cohorts tile measuring 7-day retention for users acquired during the campaign
- Apply a date filter scoped to the campaign period (e.g., July 1 to July 31) to view data only for that window.
- Share the board with your marketing team, assigning Viewer access to stakeholders and Editor access to analysts who will maintain the board.
With everything in one place, your team can track campaign performance in real time, identify funnel drop-off points, and understand retention, all without switching between separate reports.
Best Practices
To ensure smooth board management and avoid disruptions in analysis, follow these best practices:
- Group related analyses into a single board organized by goal (e.g., one board for acquisition, one for retention, one for monetization) rather than putting everything on one board.
- Use clear, descriptive tile names that explain what the data shows, including the metric, time frame, or segment where relevant (e.g., New User Signups for Last 7 Days).
- Share boards with stakeholders proactively rather than sending one-off screenshots. Boards stay up to date and allow viewers to explore the data themselves.
- Avoid overloading a single board with too many tiles. A board with more than 15 tiles can become hard to navigate. Consider splitting by audience or use case.
FAQs
Find answers to the following common questions about managing Boards:
Q. Can I add the same analysis to multiple boards?
Yes. You can add any analysis to as many boards as you like. Each instance is an independent tile and changes to one do not affect the others.
Q. Does editing a tile change the original analysis?
Yes. When you click Edit on a tile, it opens the original analysis. Any changes you save will be reflected in the tile and in the analysis itself.
Q. Why is my board-level filter not affecting some tiles?
The Flows tiles do not respond to date or segment filters. The Segment tiles only respond to segment filter changes, not date changes. For more information, refer to the Filter Behavior by File Types.
Q. Who can delete a board?
The board owner and any Editor can delete a board. Viewers cannot delete boards.
Q Can I reorder tiles on a board?
Yes. You can drag and drop tiles to rearrange them on the board layout.
Q. Is there a limit on the number of tiles per board?
Yes. You can add a maximum of 20 tiles per board.
Updated 18 days ago