View Journey Reports
Overview
Journey reports provide detailed insights into how your users move through journeys. You can analyze metrics such as entries, exits, goal conversions, and engagement trends, helping you understand the effectiveness of your journeys over time.
In the case of multiple journey versions, it also provides performance insights for each version of your journey. Whether you are analyzing a live journey or reviewing how an older version performed, the reports help you make data-driven decisions and track engagement trends over time. You can do the following:
- Track metrics for the current published version in real time.
- Access historical data for previously published versions.
- Compare engagement, conversions, and goal completions across versions.
Export Journey Reports
You can export Journey reports as CSV files directly from the dashboard. You can select one or more journeys and choose whether to include data from all versions or only selected versions of each journey.
To export journey reports, perform the following steps:
-
Select the period and the required Journeys from the Journeys list page.
-
Click the
 icon. The Email Report popup opens.
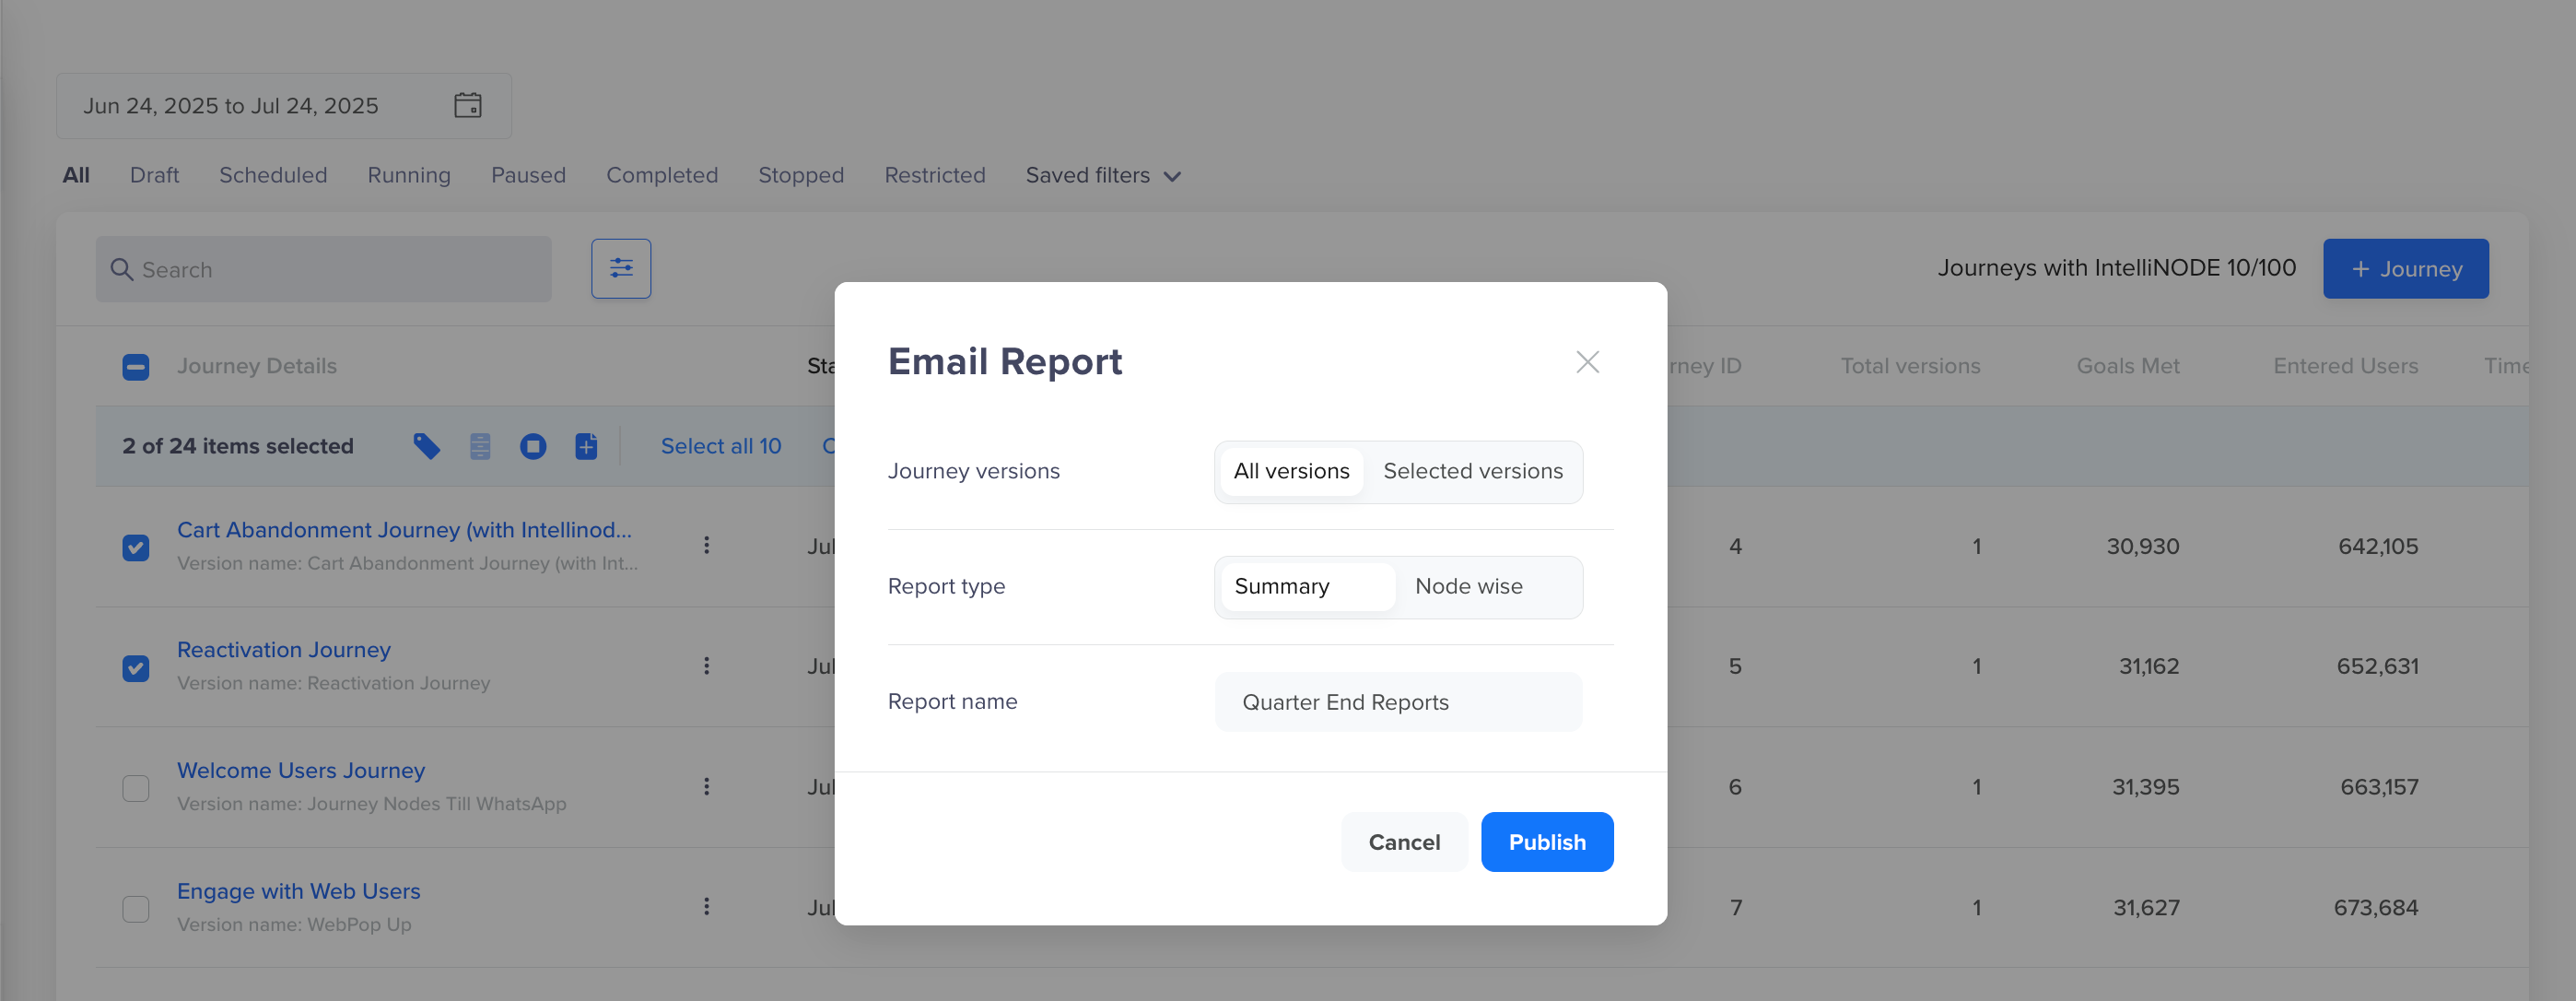
Email Journey Reports
-
Choose All versions or Selected versions of the selected journeys.
- Choose to include only specific versions of the selected journeys when:
- You only want to review performance for the most recent version.
- You need data for a particular published version that was live during a specific campaign or test.
- Choose to include All versions of the selected journey when:
- You want to analyze how the journey evolved over time.
- You are comparing performance trends across multiple published versions.
- You need a comprehensive dataset for audit, reporting, or analytics.
- You are exporting reports for long-running journeys edited and republished multiple times.
In this case, only active versions within the selected date range are available for export in the report.
- Choose to include only specific versions of the selected journeys when:
-
Select the report type: Summary or Node wise.
-
Enter a report name.
Once configured, the report is emailed to your registered email address.
NoteYou can email reports for up to 100 Journeys at a time from the dashboard.
Schedule Journey Exports
You can choose to get daily or weekly reports for any Journeys with the running status. You can choose the period and frequency from the reports section in Settings. Go to Settings > Setup > Reports.

Schedule Journey Reports
Types of Journey Reports
There are two types of Journey Reports available:
- Journey Summary Report
- Journey Nodewise Report
Journey Summary Report
This report provides a high-level summary of each journey. If a journey has multiple published versions, each version is listed as a separate row in the report.
Each row includes journey metadata, user engagement, goal conversion, and control group statistics. The data included in the report can be broadly categorized as: Journey Data and User Data.
Journey Data
This section contains journey-level metadata and configuration details. It helps identify the version and setup context for each report row.
| Report Column | Description |
|---|---|
| Journey Start Time | Timestamp when the journey started. |
| Journey End Time | Timestamp when the journey ended. |
| Journey Name | Name of the journey. |
| Journey ID | Unique identifier for the journey. |
| Journey Labels | Tags or labels associated with the journey. |
| Version Number | Version number of the journey. |
| Version Name | Display name for the journey version. |
| Version Entry Type | Entry criteria type: Live or Past Behaviour. |
| Re-entry Allowed | Indicates whether users can re-enter the journey. Possible values: TRUE or FALSE. |
| Version Status | Status of the version. Possible values: Scheduled, Running, Paused, Stopped, Completed, and Restricted. |
| Version Created by | User who created the journey version. |
| Version Created on | Date and time the version was created. |
| Version Published by | User who published the version. |
| Version Published on | Date and time the version was published. |
| Number of Nodes in the version | Total number of nodes present in this version. |
| Journey version URL | Link to access the version in the dashboard. |
User Data
This section includes user-level metrics such as entries, completions, goal conversions, and control group stats, which reflect how users engaged with a specific journey version.
| Report Column | Description |
|---|---|
| Qualified | Total users who qualified for the journey. |
| Entered | Total users who entered the journey. |
| Goal Met | Total users who met any goal. |
| Goal 1 Name | Name of the first goal. |
| Goal 1 Conversions | Users converted for goal 1. |
| Goal 1 Control Group Conversions | Control group users who converted for goal 1. |
| Goal 2 Name | Name of the second goal. |
| Goal 2 Conversions | Users converted for goal 2. |
| Goal 2 Control Group Conversions | Control group users who converted for goal 2. |
| Goal 3 Name | Name of the third goal. |
| Goal 3 Conversions | Users converted for goal 3. |
| Goal 3 Control Group Conversions | Control group users who converted for goal 3. |
| Journey Timeout | Users who timed out of the journey. |
| Force Exits | Users exited using the Force Exit node. |
| Version Exit | Users who exited the version from this node. |
| Completed | Users who completed the journey. |
| Control Group (Total) | Total users in all control groups. |
| System Control Group Conversions | Conversions in system control group. |
| Journey version Control Group Conversions | Conversions in journey-level control group. |
| Custom Control Group Conversions | Conversions in a custom control group. |
| Custom Control Group Name | Name of the custom control group. |
Journey Nodewise Report
Each row in the report represents a node from a specific journey version, including logic nodes (for example, Segment, Delay) and engagement nodes (for example, Push, Email, WhatsApp).
If a journey includes multiple campaigns, variants, or connector paths, each variation is shown as a separate row in the report.
The data included in the Nodewise Report can be broadly categorized into: Journey Data, Node Data, Node User Data, and Campaign Data.
Multiple Values for Report ColumnThe columns may contain multiple values separated by delimiters
|, depending on the node configuration (for example, multiple variants, paths, or goal definitions). Such columns have been marked with * in the tables included in the sections to follow.
Journey Data
This section contains journey-level metadata and configuration details. It helps identify the version and setup context for each report row.
| Report Column | Description |
|---|---|
| Start Date / Start Time | Timestamp when the journey started. |
| End Date / End Time | Timestamp when the journey ended. |
| Journey Name | Name of the journey. |
| Journey ID | Unique identifier for the journey. |
| Journey Labels | Tags associated with the journey. |
| Version Number | Version number of the journey. |
| Version Name | Display name for the journey version. |
| Version Entry Type | Entry criteria: Live or Past Behaviour. |
| Re-entry Allowed | Indicates whether users can re-enter the journey. |
| Version Status | Status of the version. Possible values: Scheduled, Running, Paused, Stopped, Completed, and Restricted. |
| Version Created by / on | Creator and creation timestamp for the version. |
| Version Published by / on | User who recently published the version and the time. |
| Number of Nodes in the version | Total number of nodes in this version. |
| Journey version URL | URL to open the journey version in the dashboard. |
Node Data
This section describes the node-specific attributes within a journey version.
| Report Column | Description |
|---|---|
| Node Type | Type of node, for example, Segment, Email, SMS, Push, and so on. |
| Node ID | Unique identifier of the node. |
| Previous Node* | IDs of preceding nodes connected to this node. |
| Delay before Node* | Time delay before this node is executed. |
| Connector from Previous* | Connector logic used to enter the node. Possibe values: Yes, No, and Timeout. |
| Qualifying Window | Time window to meet entry conditions at the segment node. |
| Campaign / Segment / Controller Name | Name of the campaign, segment, or controller associated with the node. |
| Campaign / Segment / Controller ID | Unique ID for the associated campaign or segment. |
| Channel / Segment / Controller Type | Type of messaging or segmentation logic, for example, Push, Email, and so on. |
| Campaign URL | Link to the campaign in the dashboard. |
Node User Data
This section includes metrics for user movement through this node and outcomes recorded.
| Column | Description |
|---|---|
| Moved Forward | Total users who progressed from this node. |
| Moved Forward via Yes / No / Node Timeout* | Users moved along specific connector paths. |
| Journey Timeout | Users who timed out at or before this node. |
| Completed | Users who completed the journey starting from this node. |
| Goal Met | Total users who achieved any goal. |
| Goal 1–3 Name* | for up to three defined goals. |
| Goal 1–3 Conversions* | Number of users who have been converted by achieving respective goals |
| Version Exit | Users who exited the version from this node. |
Campaign Data
This section is available for engagement nodes and captures delivery and interaction metrics.
| Report Column | Description |
|---|---|
| Campaign Type | Campaign configuration details. |
| Campaign Variant* | Campaign configuration details. If multiple variants are tested (for example, A/B test), multiple variant IDs may be shown, though typically each row reflects one. |
| Campaign OS* | Campaign configuration details. Lists targeted platforms, often shown as Android | iOS. |
| Global Campaign Limits Applied | Whether global send limits were applied. |
| Campaign Title / Message | Campaign title and message content. |
| Total Sent / Viewed / Clicked | Message delivery and interaction counts. |
| Total Delivered / Replied | Delivery confirmation and replies (where applicable). |
| Total Unsubscribes | Total users who unsubscribed via this campaign. |
| Conversion Event / Time | Event considered as conversion and the window duration. |
| Unique Sent / Viewed / Clicked / Converted within Conversion Time | Unique users counted within the conversion window. |
| Influenced Conversions / Revenue | Indirect conversions and attributed revenue. |
| Amplified by Push | Whether push messaging influenced engagement. |
| RenderMax Enabled | Indicates if RenderMax (rich content optimization) was used. |
| Template Name / Provider Name | Template and provider details for Email or SMS. |
| WABA Number | WhatsApp Business Account number in the case of the WhatsApp campaign. |
| Total HTML/AMP Viewed/Clicked/Unsubscribed* | Email stats segmented by HTML and AMP versions. Values can include HTML and AMP email format subfields, often tracked in separate columns (for example, Total AMP Clicked). |
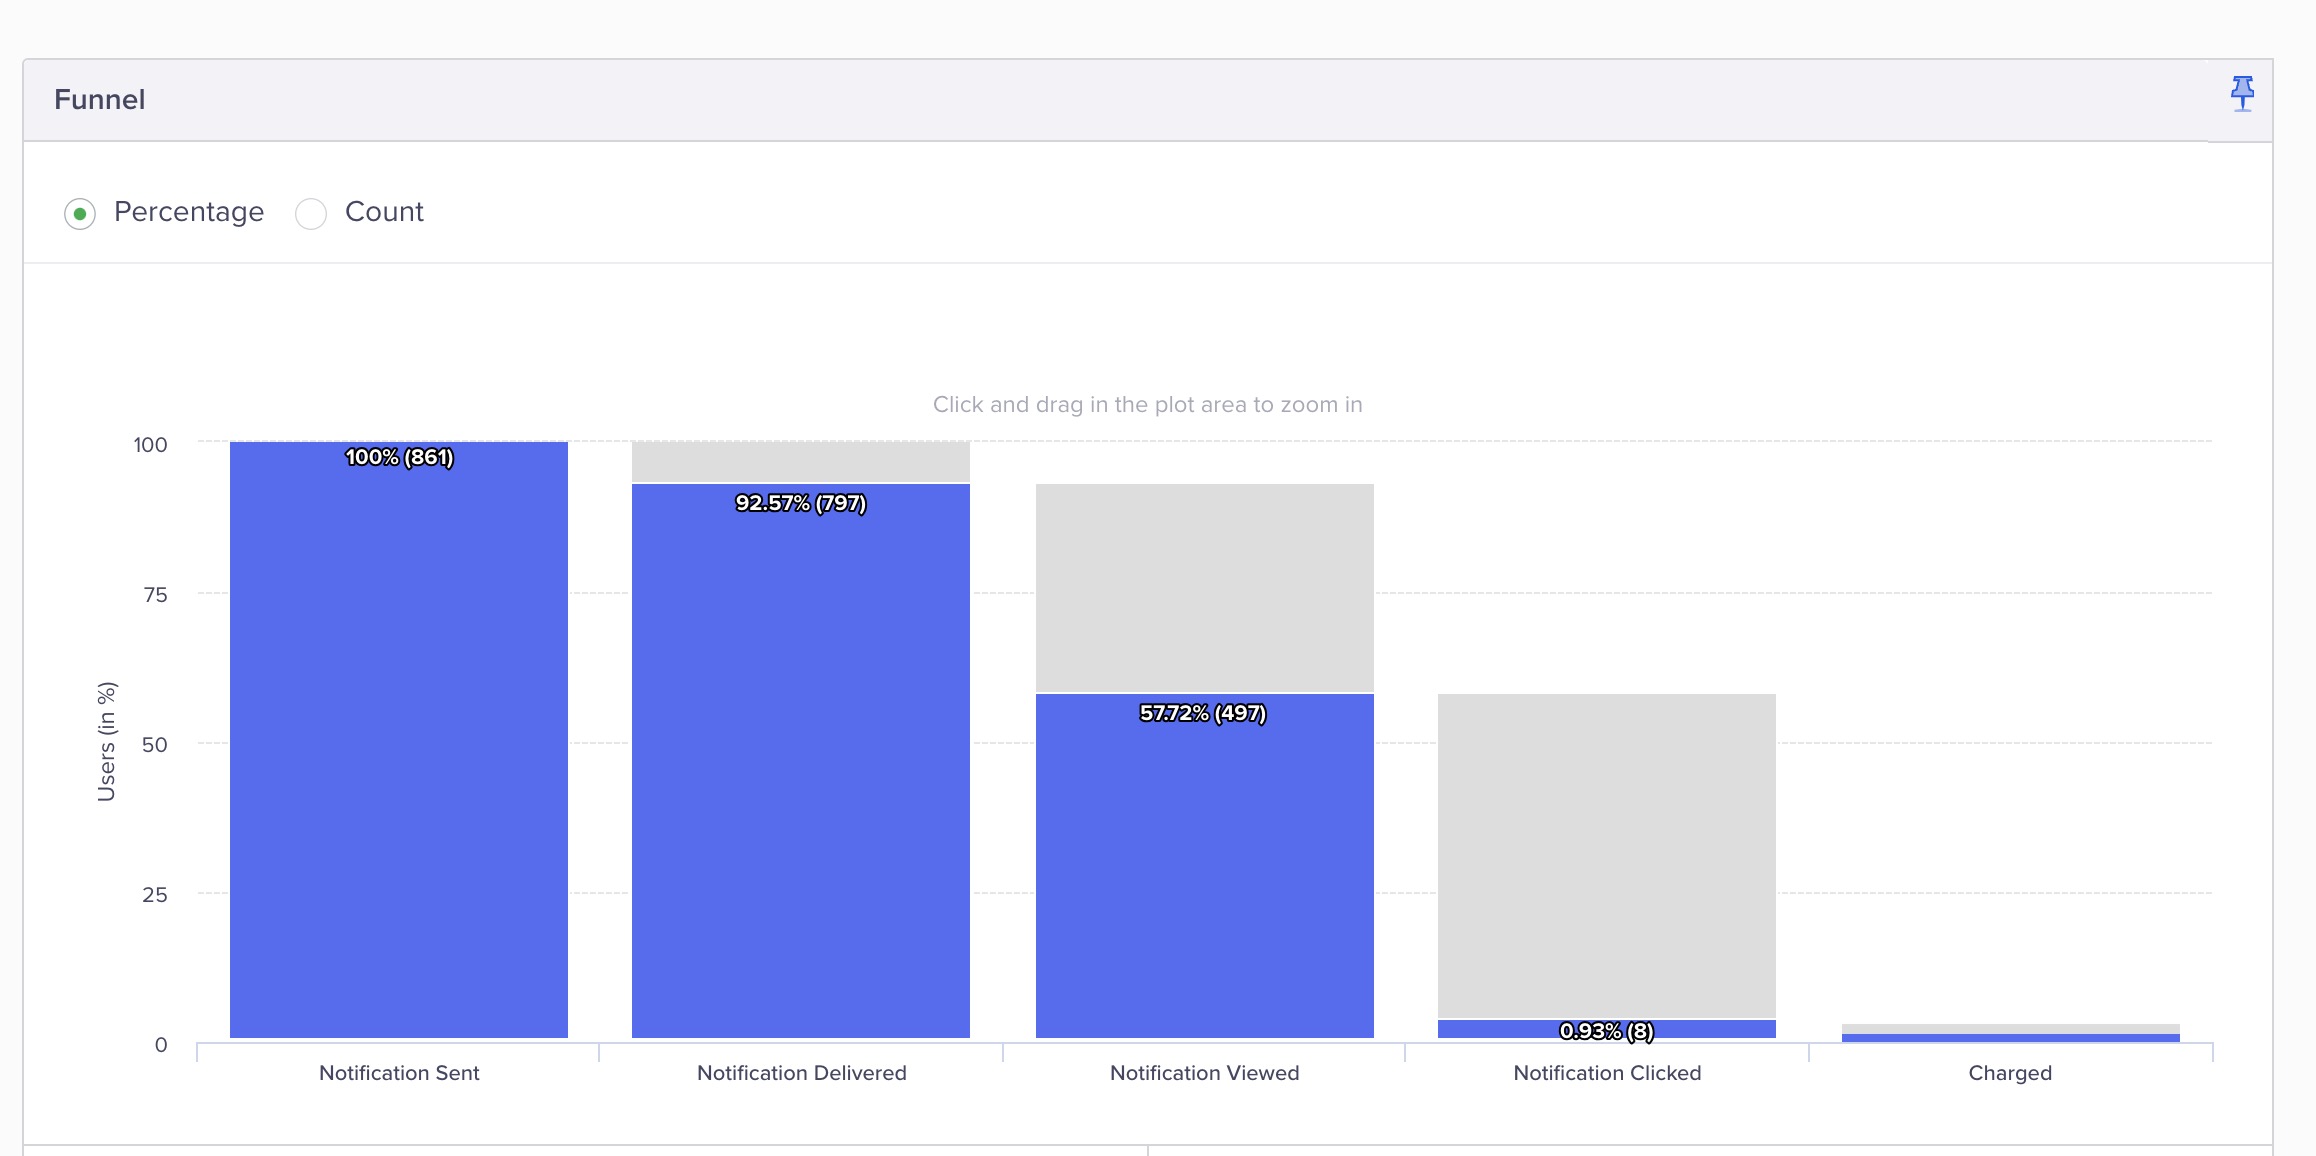
Conversion Stats for WhatsApp Nodes
CleverTap BSP allows tracking clicks on the WhatsApp message. The stats for these clicks are available under the Campaigns > Stats page. If Click Tracking is enabled, the Journey Report will display the node stats for the sent > delivered > viewed > clicked > converted funnel. However, if Click Tracking is not enabled, only the viewed data is reported for your campaign. Therefore, the funnel in this case is, sent> delivered > viewed > converted .
Click Tracking Funnel
| Campaign/Journey Data | Click Tracking Enabled | Click Tracking Disabled |
|---|---|---|
| Unique Sent within Conversion Time | sent > delivered > viewed > clicked > converted | sent > delivered > viewed >converted |
| Unique Viewed within Conversion Time | sent > delivered > viewed > clicked > converted | sent > delivered > viewed > converted |
| Unique Clicked within Conversion Time | sent > delivered > viewed >clicked > converted | sent > delivered > viewed > converted |
| Unique Converted within Conversion Time | sent > delivered > viewed >clicked > converted | 0. |
Updated 7 months ago