Email Campaign Stats
Measure the performance of your Email campaign.
Overview
Once the campaign is published, you can view the detailed campaign stats under the All Campaigns page. The Stats tab displays the overall conversion performance and errors.
View Email Campaign Stats
CleverTap provides the following key event-based metrics to help you monitor your campaign effectiveness:
- Notification Sent: Raised when the email campaign is sent to the ESP.
- Notification Viewed: Raised when the user opens the email campaign.
- Notification Clicked: Raised when the user clicks on the email campaign.
You can view its stats by navigating to Campaigns from the CleverTap dashboard. To do so:
- Click Campaigns from the dashboard. The All Campaigns page opens.
- Select the email campaign for which you want to view the stats. You can filter campaigns using the Filter button (see figure below).

Filter Email Campaigns
- Click the campaign to open it. The Stats tab displays the following campaign stats:
Overall Campaign Performance
This section displays a high-level overview of the entire email campaign performance. Each card displays the count and percentage for key performance indicators of your email campaign, providing a comprehensive view of engagement, and conversions across all recipients (refer to the following image):

Campaign Stats
Each stats card displays the total count and the percentage for different metrics. You can track the following stats for your email campaign:
| Email Metric | Description |
|---|---|
| Sent | Displays the total number of emails sent, excluding emails sent to CC and BCC recipients. |
| Viewed |
|
| Clicks |
|
| CTR | Indicates the Click-through Rate of the campaign. It is calculated as
. |
| Converted users | Displays the percentage of total users who performed the conversion event, such as purchasing an item. It also shows the number of users who converted after receiving the campaign. |
| Errors | Displays the number of errors for the campaign. These can be technical errors, such as email provider errors, or non-technical errors, such as Message Frequency Exceeded . |
| Control group | Displays the number of users considered part of a control group for the campaign. |
| CC Sent | Displays the total number of emails sent to recipients under the CC field. This feature is currently in Private Beta. To gain access, contact your customer support manager and for more details, refer to Email Campaign Stats for CC BCC . |
| BCC Sent | Displays the total number of emails sent to recipients under the BCC field. This feature is currently in Private Beta. To gain access, contact your customer support manager and for more details, refer to Email Campaign Stats for CC BCC . |
| CC Errors | Displays the total number of emails that failed to be sent to recipients under the CC field. This refers to errors encountered when sending email campaigns from CleverTap to the Email Service Provider (ESP). |
| BCC Errors | Displays the total number of emails that failed to be sent to recipients under the BCC field. This refers to the errors encountered when sending email campaigns from CleverTap to the Email Service Provider (ESP). |
| Global Unsubscribes | Displays the total number of unsubscriptions. The unsubscription is attributed to the primary recipients who qualify for the campaign only if you use the
method to unsubscribe from an email campaign . |
NoteTracking delivery related errors like Unsubscribes, Bounces, and Report as Spam are not available for CC/BCC recipients.
Message Trend
Click Message Trend to view the the performance trends of your campaign over time. It typically visualizes key metrics such as the number of emails Sent, Viewed, or Clicked across a specified time frame.
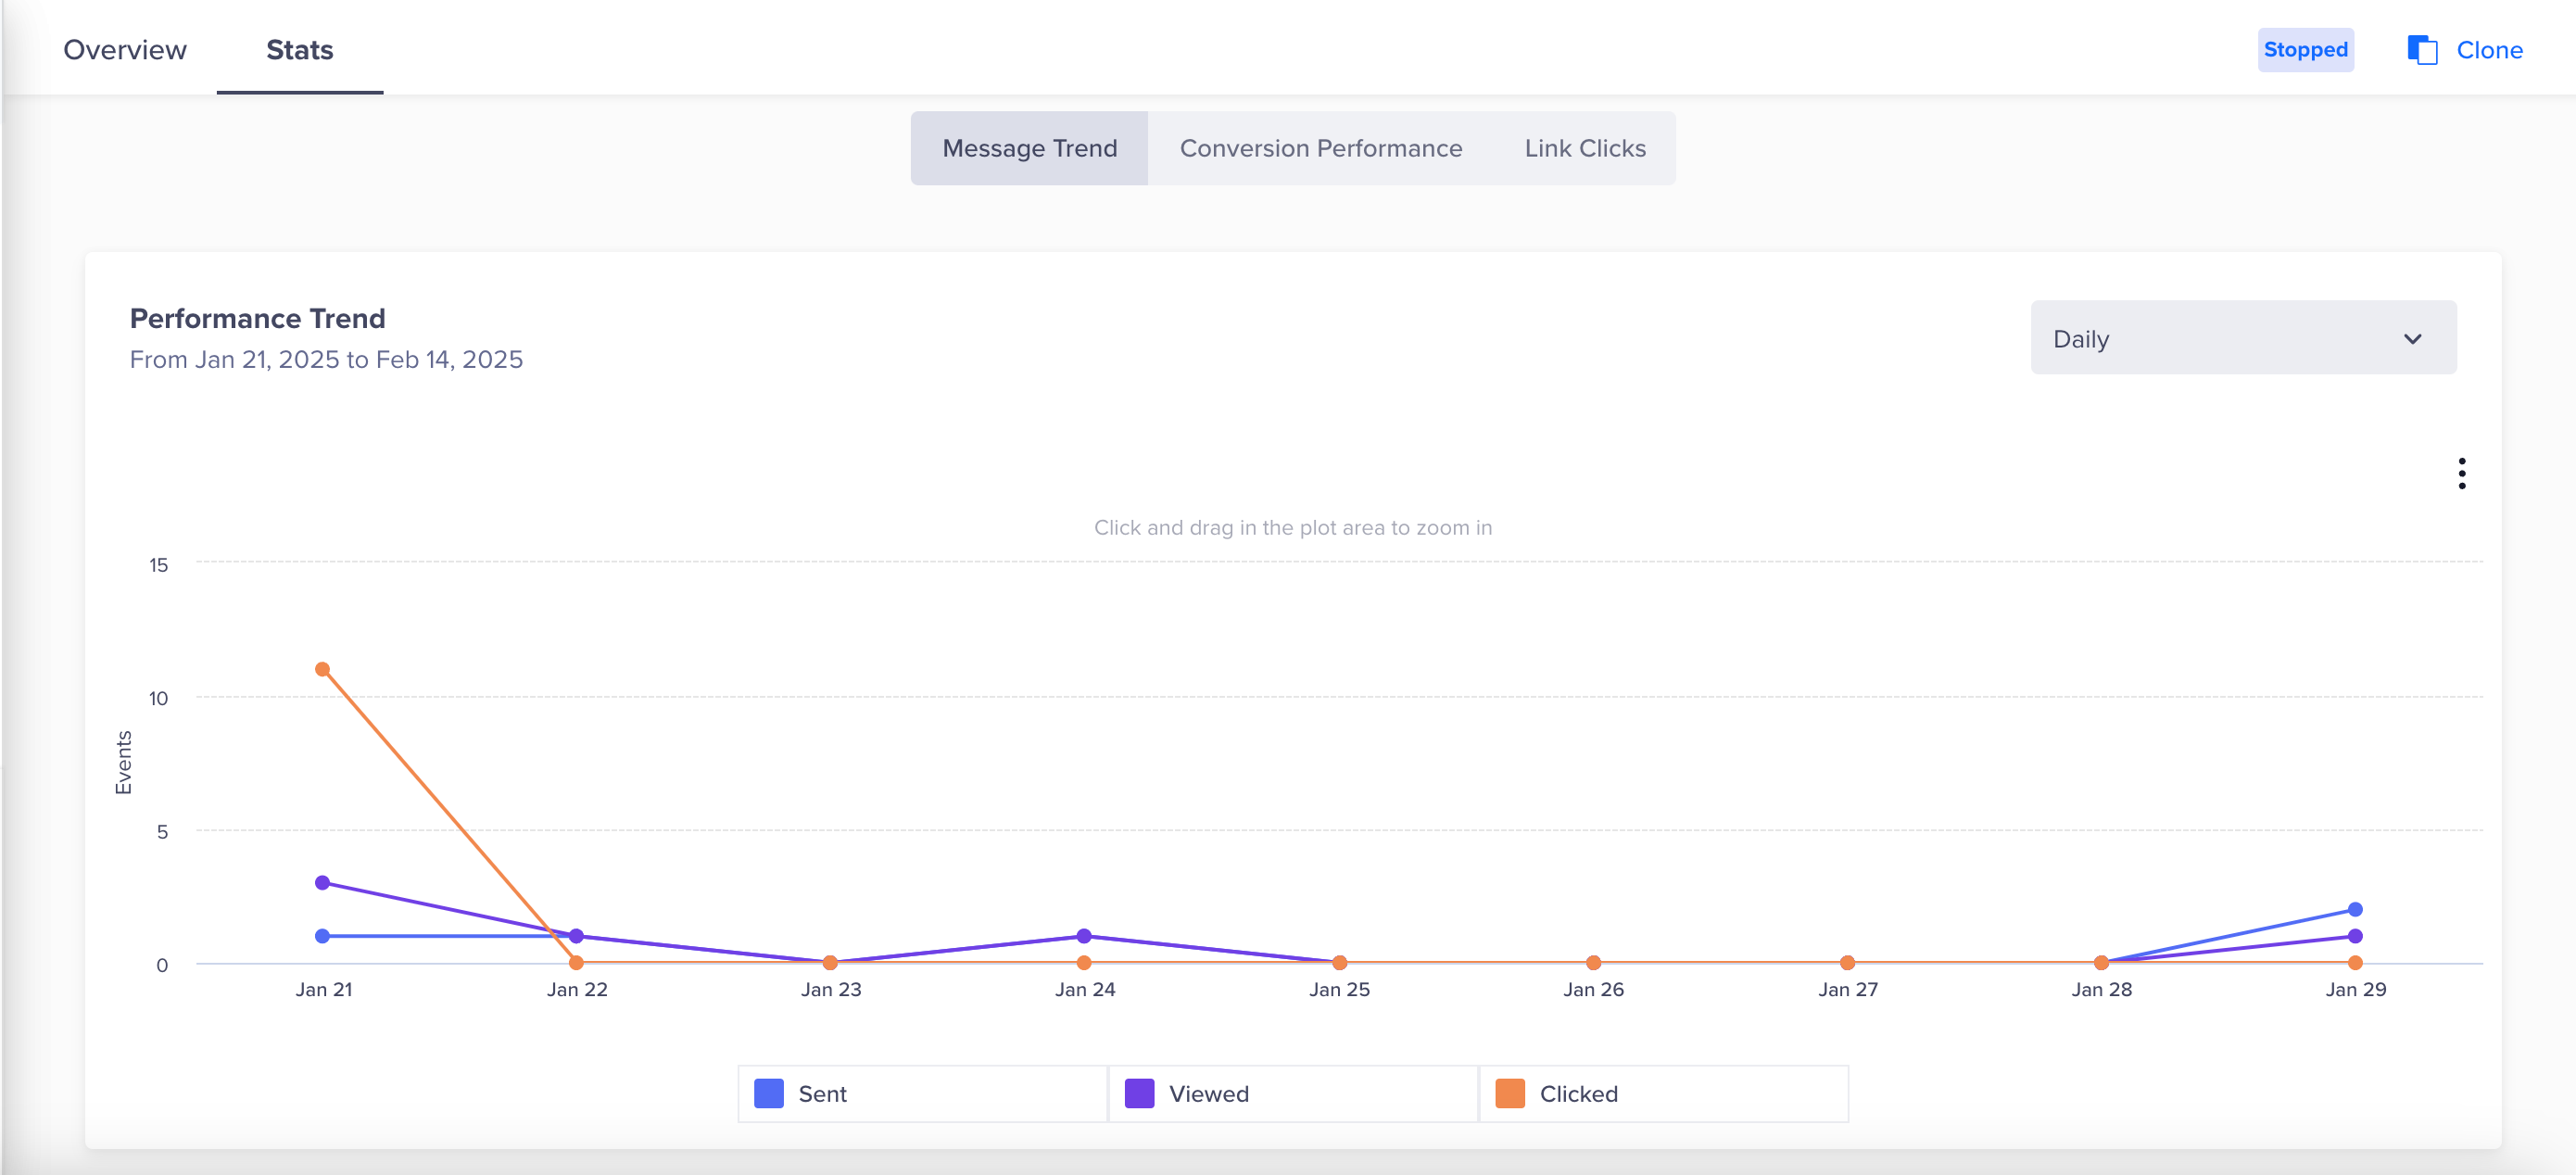
Message Trend
Variant Comparison
This section provides detailed performance insights for each variant in multivariant campaigns, such as A/B Tests, Split Delivery, or Messages based on User Properties.
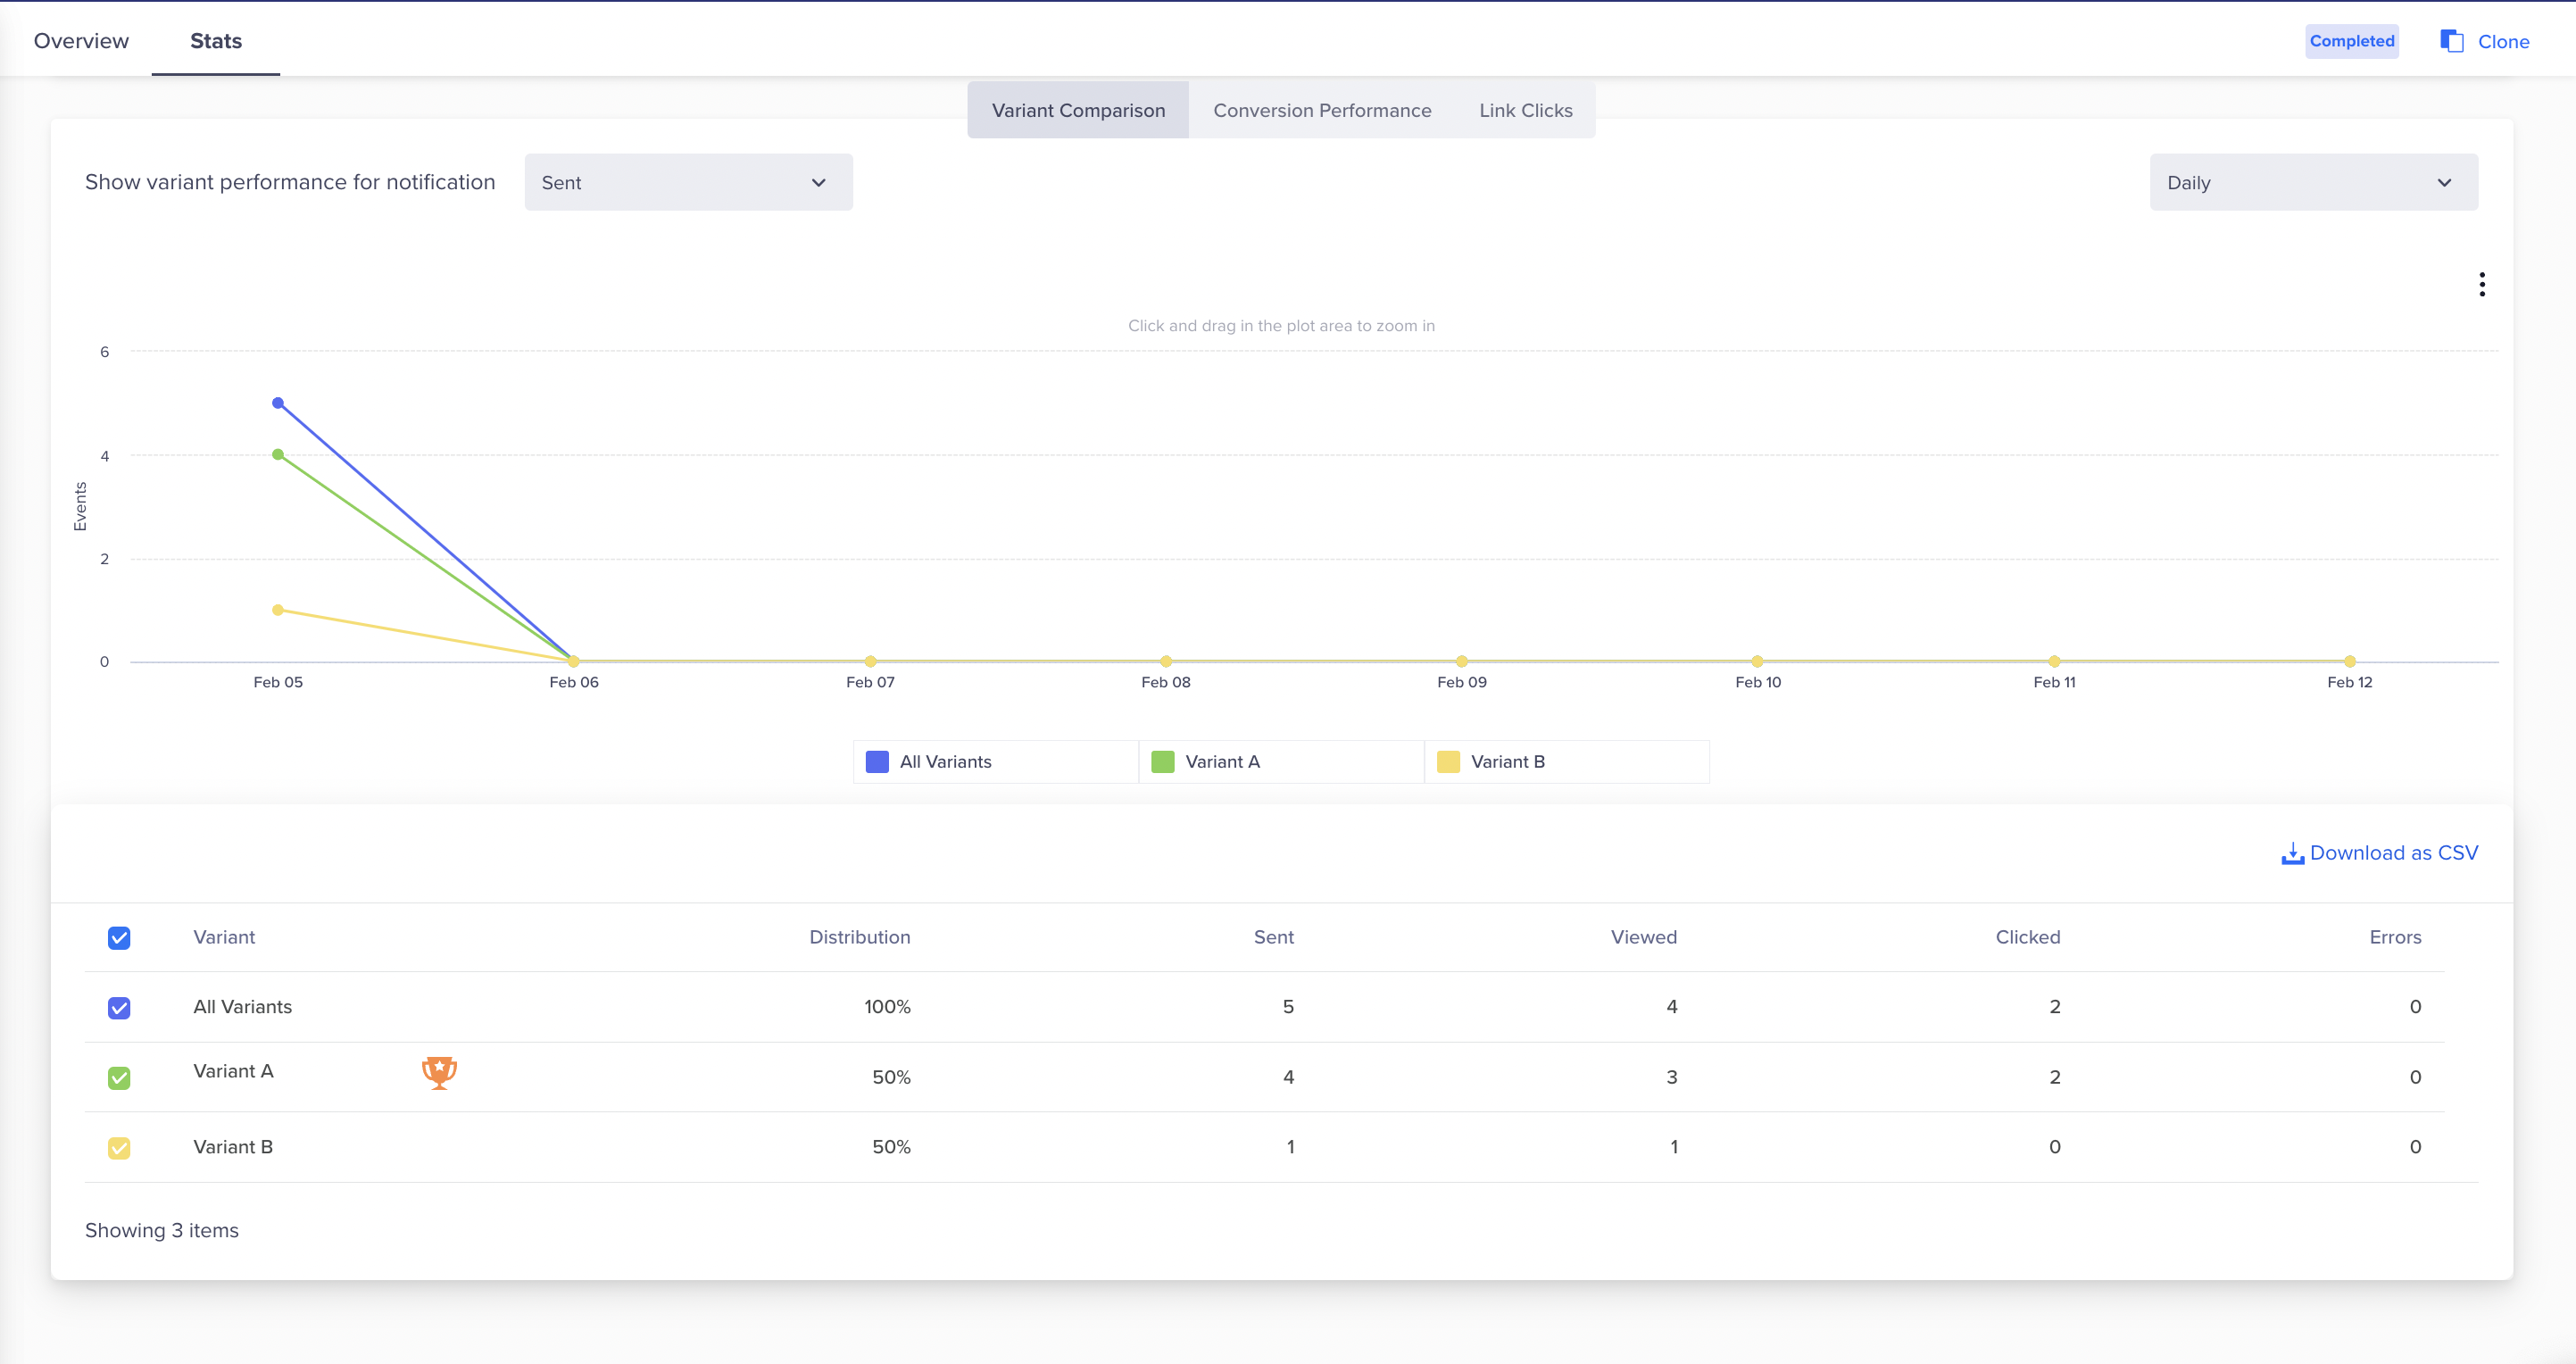
Variant Comparison
You can analyze the stats for the following metrics: Sent, Viewed, or Clicked. The graph illustrates trends for the selected metric over the selected time period. The table below the graph provides a breakdown of the following metrics for each variant: Sent, Viewed, and Clicked.
Conversion Performance
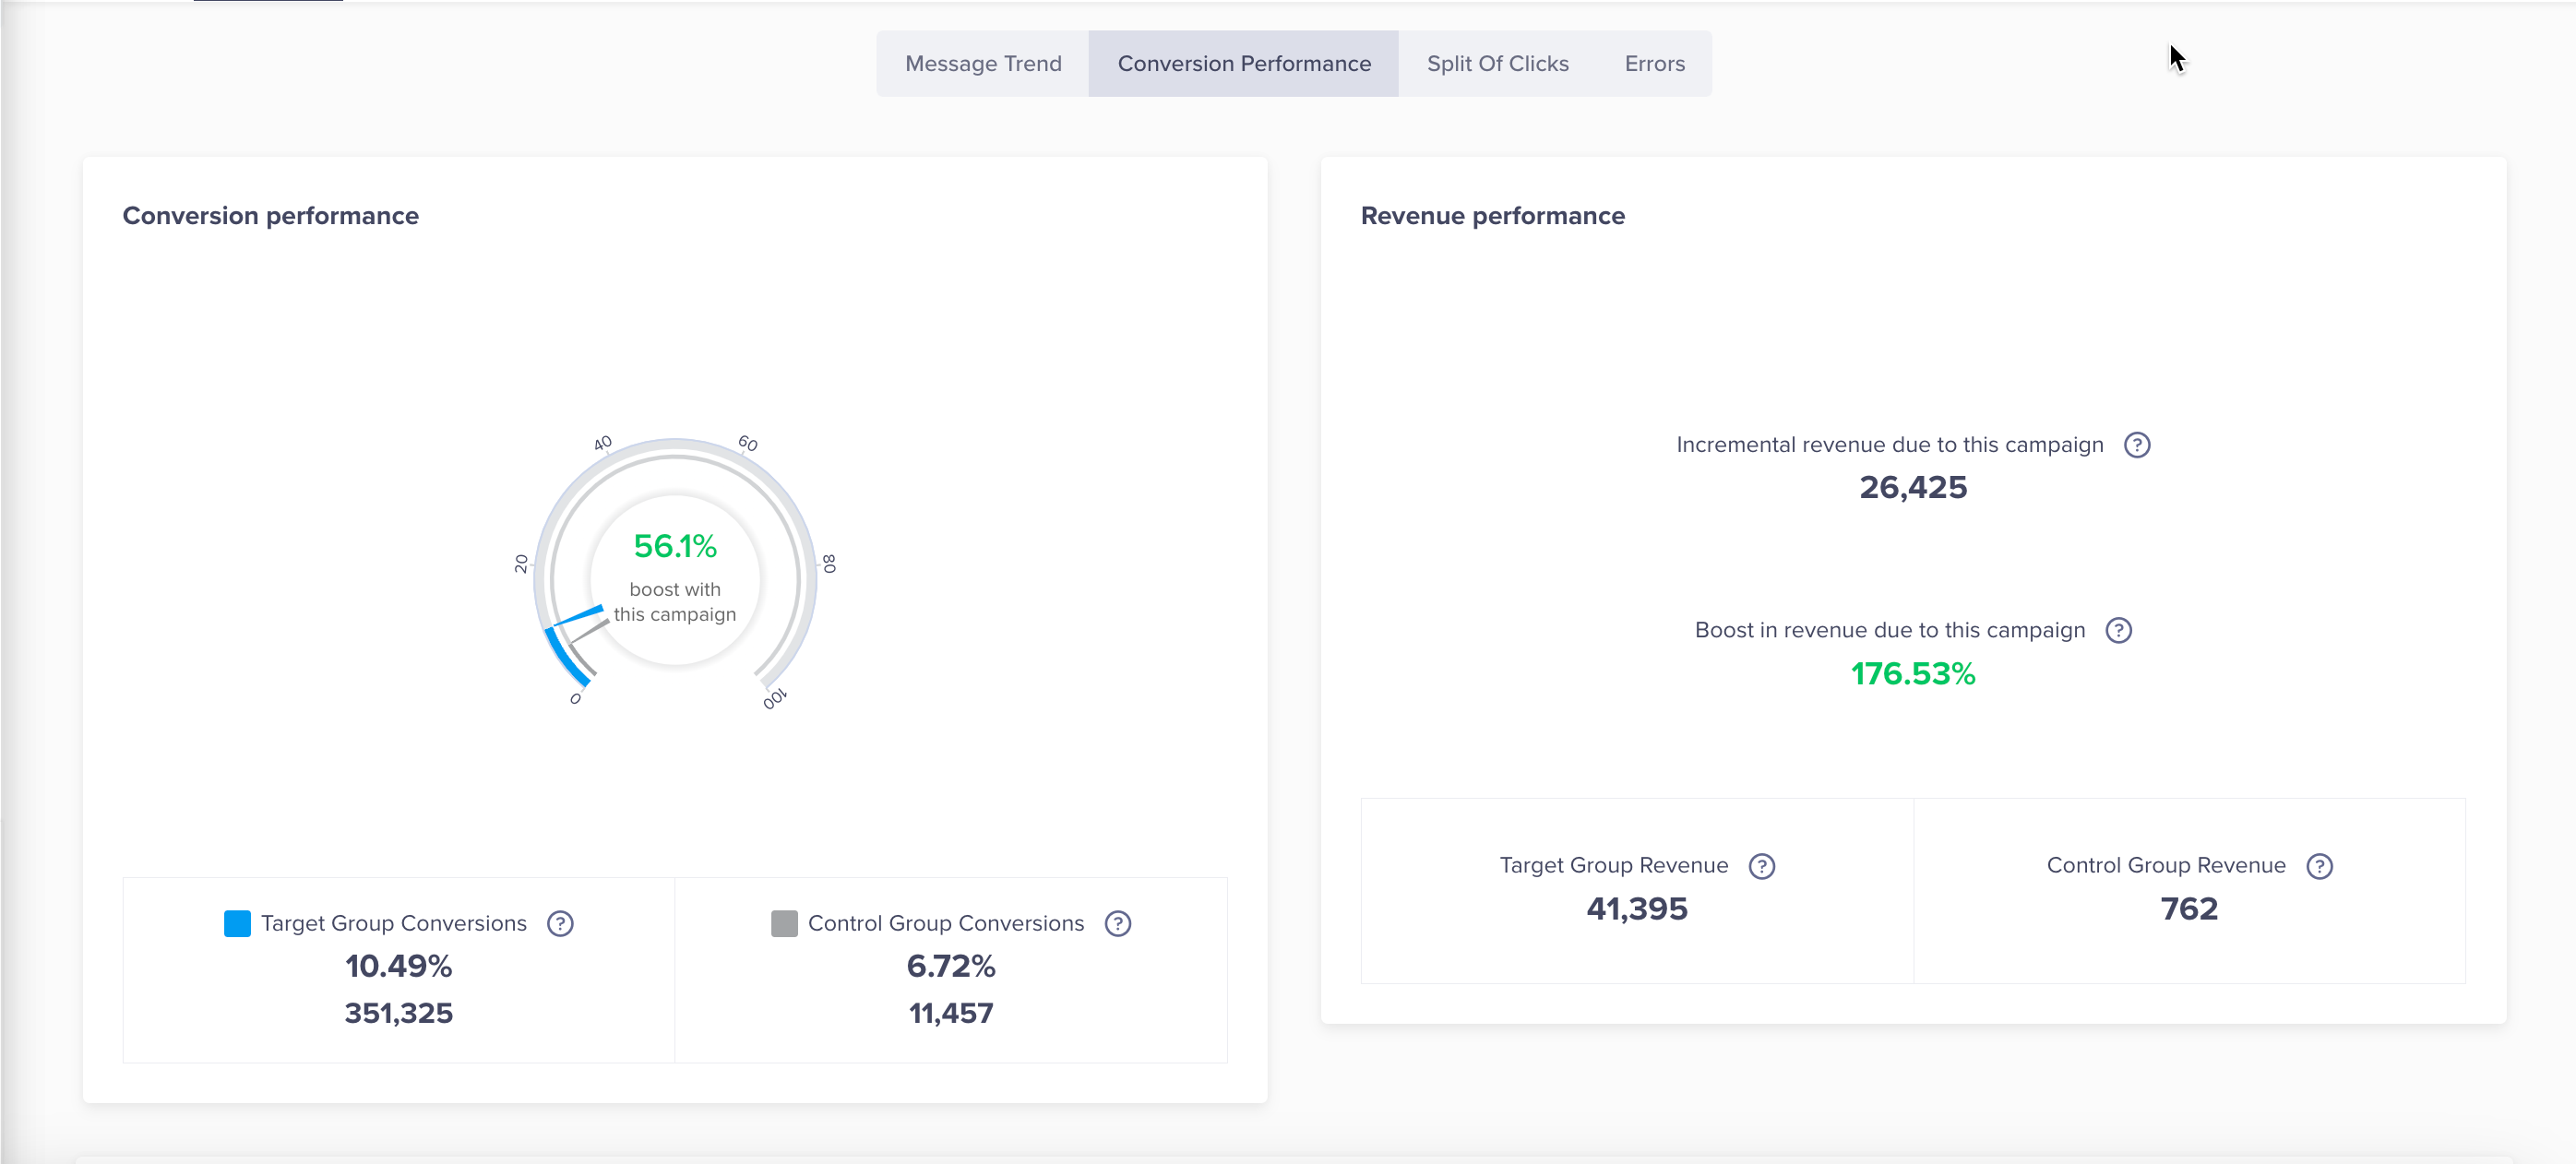
The Conversion Performance section is divided into two key insights: Conversion Performance and Revenue Performance. These metrics help track user actions and measure the impact of your campaigns on conversions and revenue.
Click Conversion Performance to view Conversion performance, Revenue performance, and Users' conversion funnel.
Conversion Performance
You can view stats for each variant under the User conversion funnel for A/B Test, Split Delivery, and Message on User Property campaigns.
Click Conversion Performance to view Conversion performance, Revenue performance, and Users' conversion funnel.
Conversion Performance
The conversion performance section shows the conversion boost your campaign achieved. You can compare your campaign conversions with the control group conversions to see the impact of your campaign.

Conversion Performance Stats
Revenue Performance
The Revenue Performance section shows the revenue boost achieved from your campaign. The following information is displayed in this section:
- Incremental revenue due to this campaign: Indicates the additional income directly attributed to a specific campaign. It is calculated as:
[(ARPU of Target Group – ARPU of Control Group) x Number of Users to whom the campaign was sent], where ARPU is calculated as: (Revenue generated / Number of users to whom the campaign was sent) - Boost in revenue due to this campaign: Indicates the percentage increase in revenue achieved from running the campaign compared (revenue generated from Target Group) to the baseline revenue that would have been generated without it (revenue generated from Control Group). It is calculated as:
{[(Target Group ARPU – Control Group ARPU) / Control Group ARPU] x 100} - Target Group Revenue: Indicates the total revenue generated by users targeted by the campaign.
- Control Group Revenue: Indicates the total revenue generated by users not targeted by the campaign (control group).
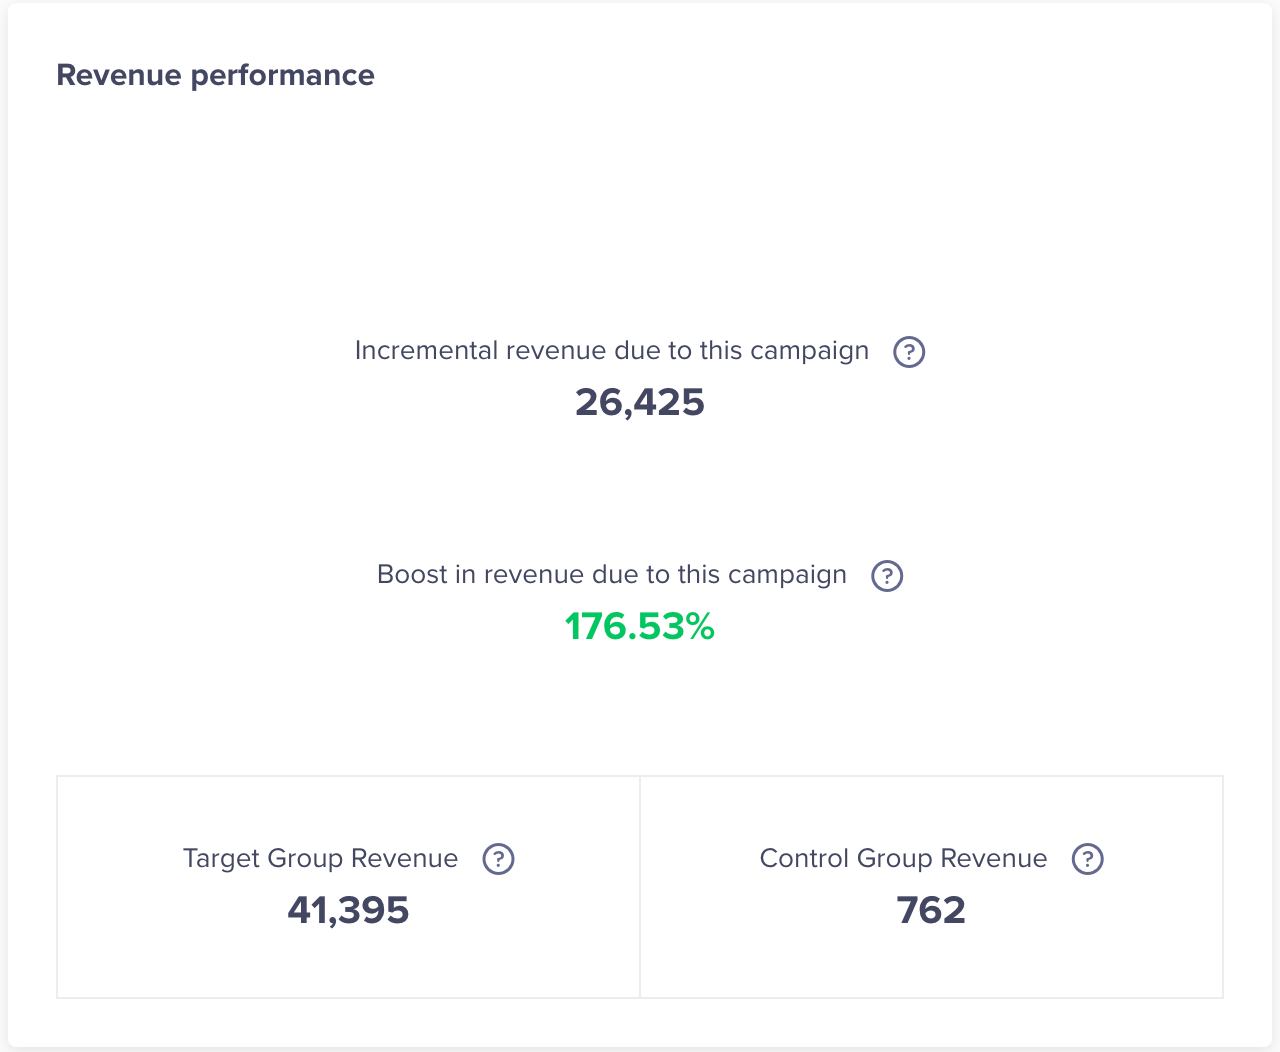
Revenue Performance
Users Conversion Funnel
Shows the conversion funnel, that is, Sent > Viewed > Clicked > Converted. This helps you understand the drop-offs at each step more effectively.

Users' Conversion Funnel
You can view stats for each variant under the User conversion funnel for A/B test, Split delivery, and Message on user property campaigns.
Based on your tracking requirement, you can select to hide the Viewed step.

Hide Viewed Funnel
Key Points to RememberThe Conversion Performance number for All Variants may be equal to or less than the combined Conversion Performance number for each individual variant. For example, if the Conversion Performance number for All Variants is 10500, with Variant A at 5575 and Variant B at 5053, the total for Variants A and B combined is 10628, exceeding the total for All Variants.
This scenario can occur due to the following reasons:
- For Live campaigns, different variants are delivered to various devices, identified by different GUIDs for the same user. Consequently, the Conversion Performance number for All Variants might not match the sum of the Conversion Performance numbers for each variant. For instance, a user may receive Variant A before uninstalling the app and then receive Variant B after reinstalling it until their identity is established.
- For Recurring campaigns (user property campaigns), the user can qualify more than once when and receive different message copy each time. For example, the user upgrades to a new plan. In this case, the message copy received by the user before and after upgrading the Membership type can be different.
In both the cases, the same user is counted twice, once for Variant A and once for Variant B. However, when calculating the Conversion Performance number for All Variants, each user is counted only once.
Link Clicks
You can evaluate the performance of different links in a single email campaign using a Click Map for a visual overview and a Breakdown for detailed tabular insights.
Click Map
The Click Map provides a visual representation of your email, highlighting the links that users have clicked. This feature enables you to identify high-performing links and optimize link placement within your email campaigns. By analyzing these insights, you can make data-driven adjustments to your content for improved engagement.
The Click Map overlays your email with color-coded indicators for each link, displaying the total number of clicks. This allows you to evaluate how link placement effectively influences campaign performance.
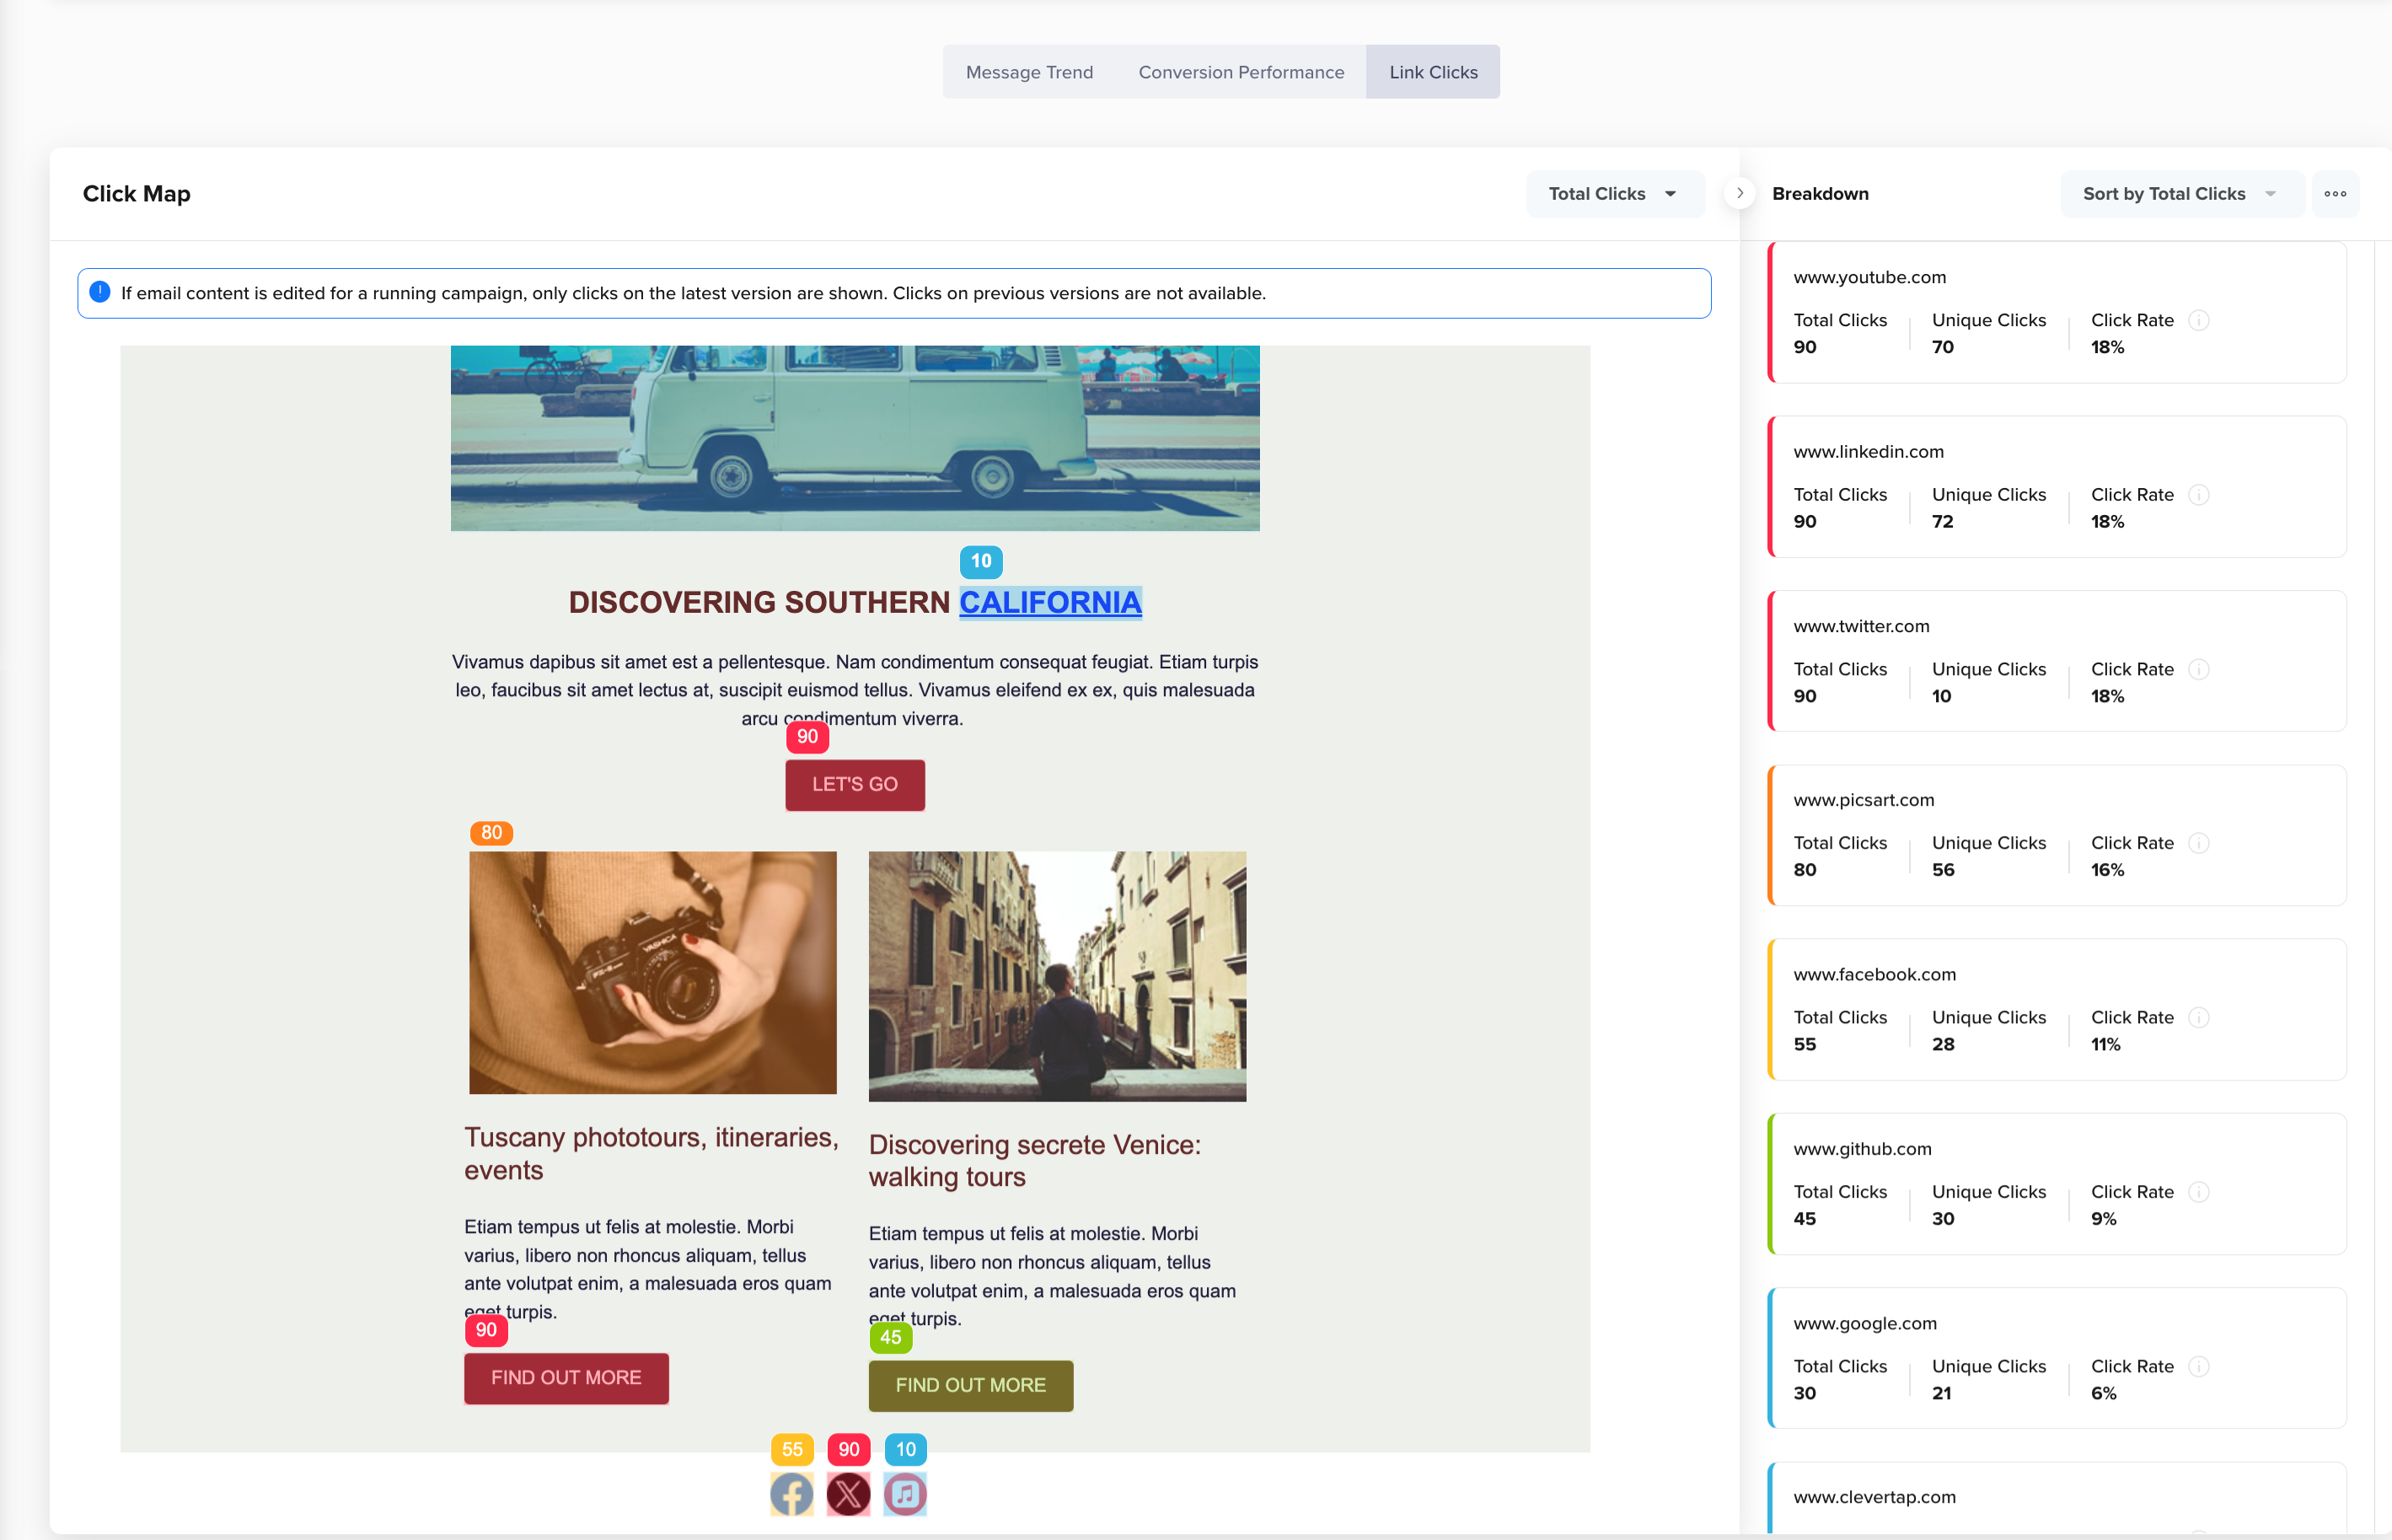
Color-Coded Indicators for Links in Campaign
Color coding offers an intuitive way to quickly assess click activity across the links in your email. Each color corresponds to a different level of engagement, making it easier to identify which links are performing best. The red color represents the highest number of clicks, followed by orange, yellow, green, and blue, indicating decreasing levels of engagement, while gray represents links with no clicks at all.
If your campaign includes multiple variants, select the email variant from the dropdown to analyze the variant of your interest within the campaigns.
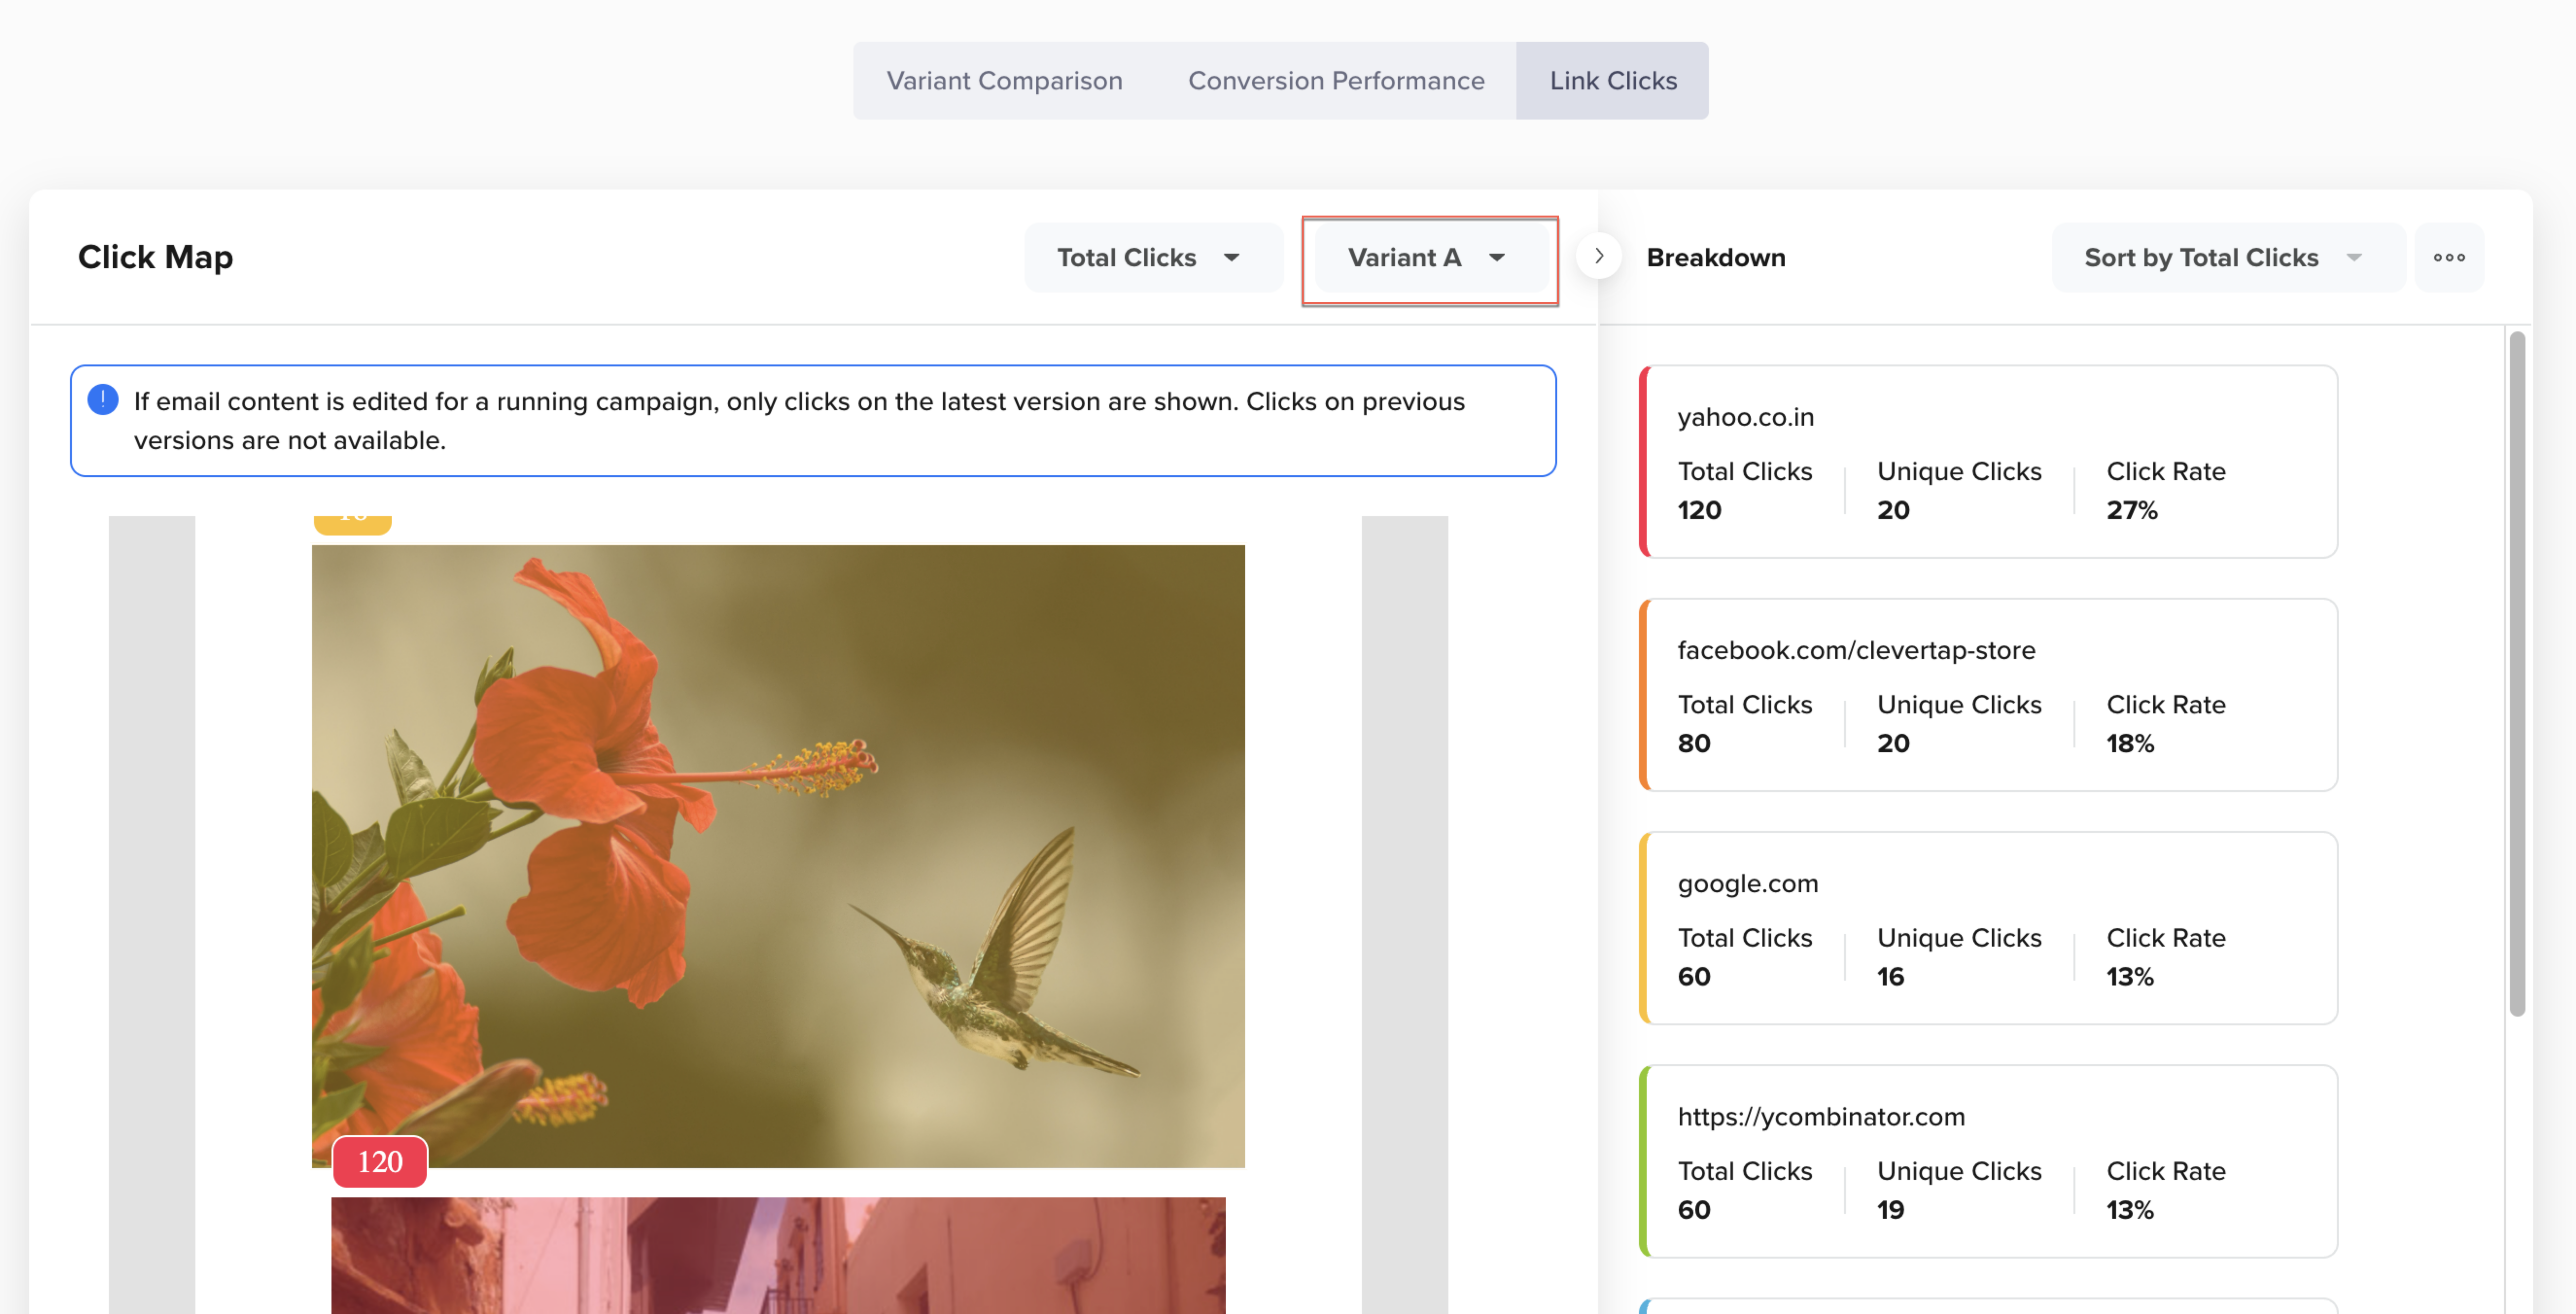
Variant wise Breakdown
For AMP email campaigns, you can switch to the AMP email by selecting it from the dropdown. By default, it is set to HTML, so ensure you change this setting to AMP to analyze metrics specific to the AMP version of your email.
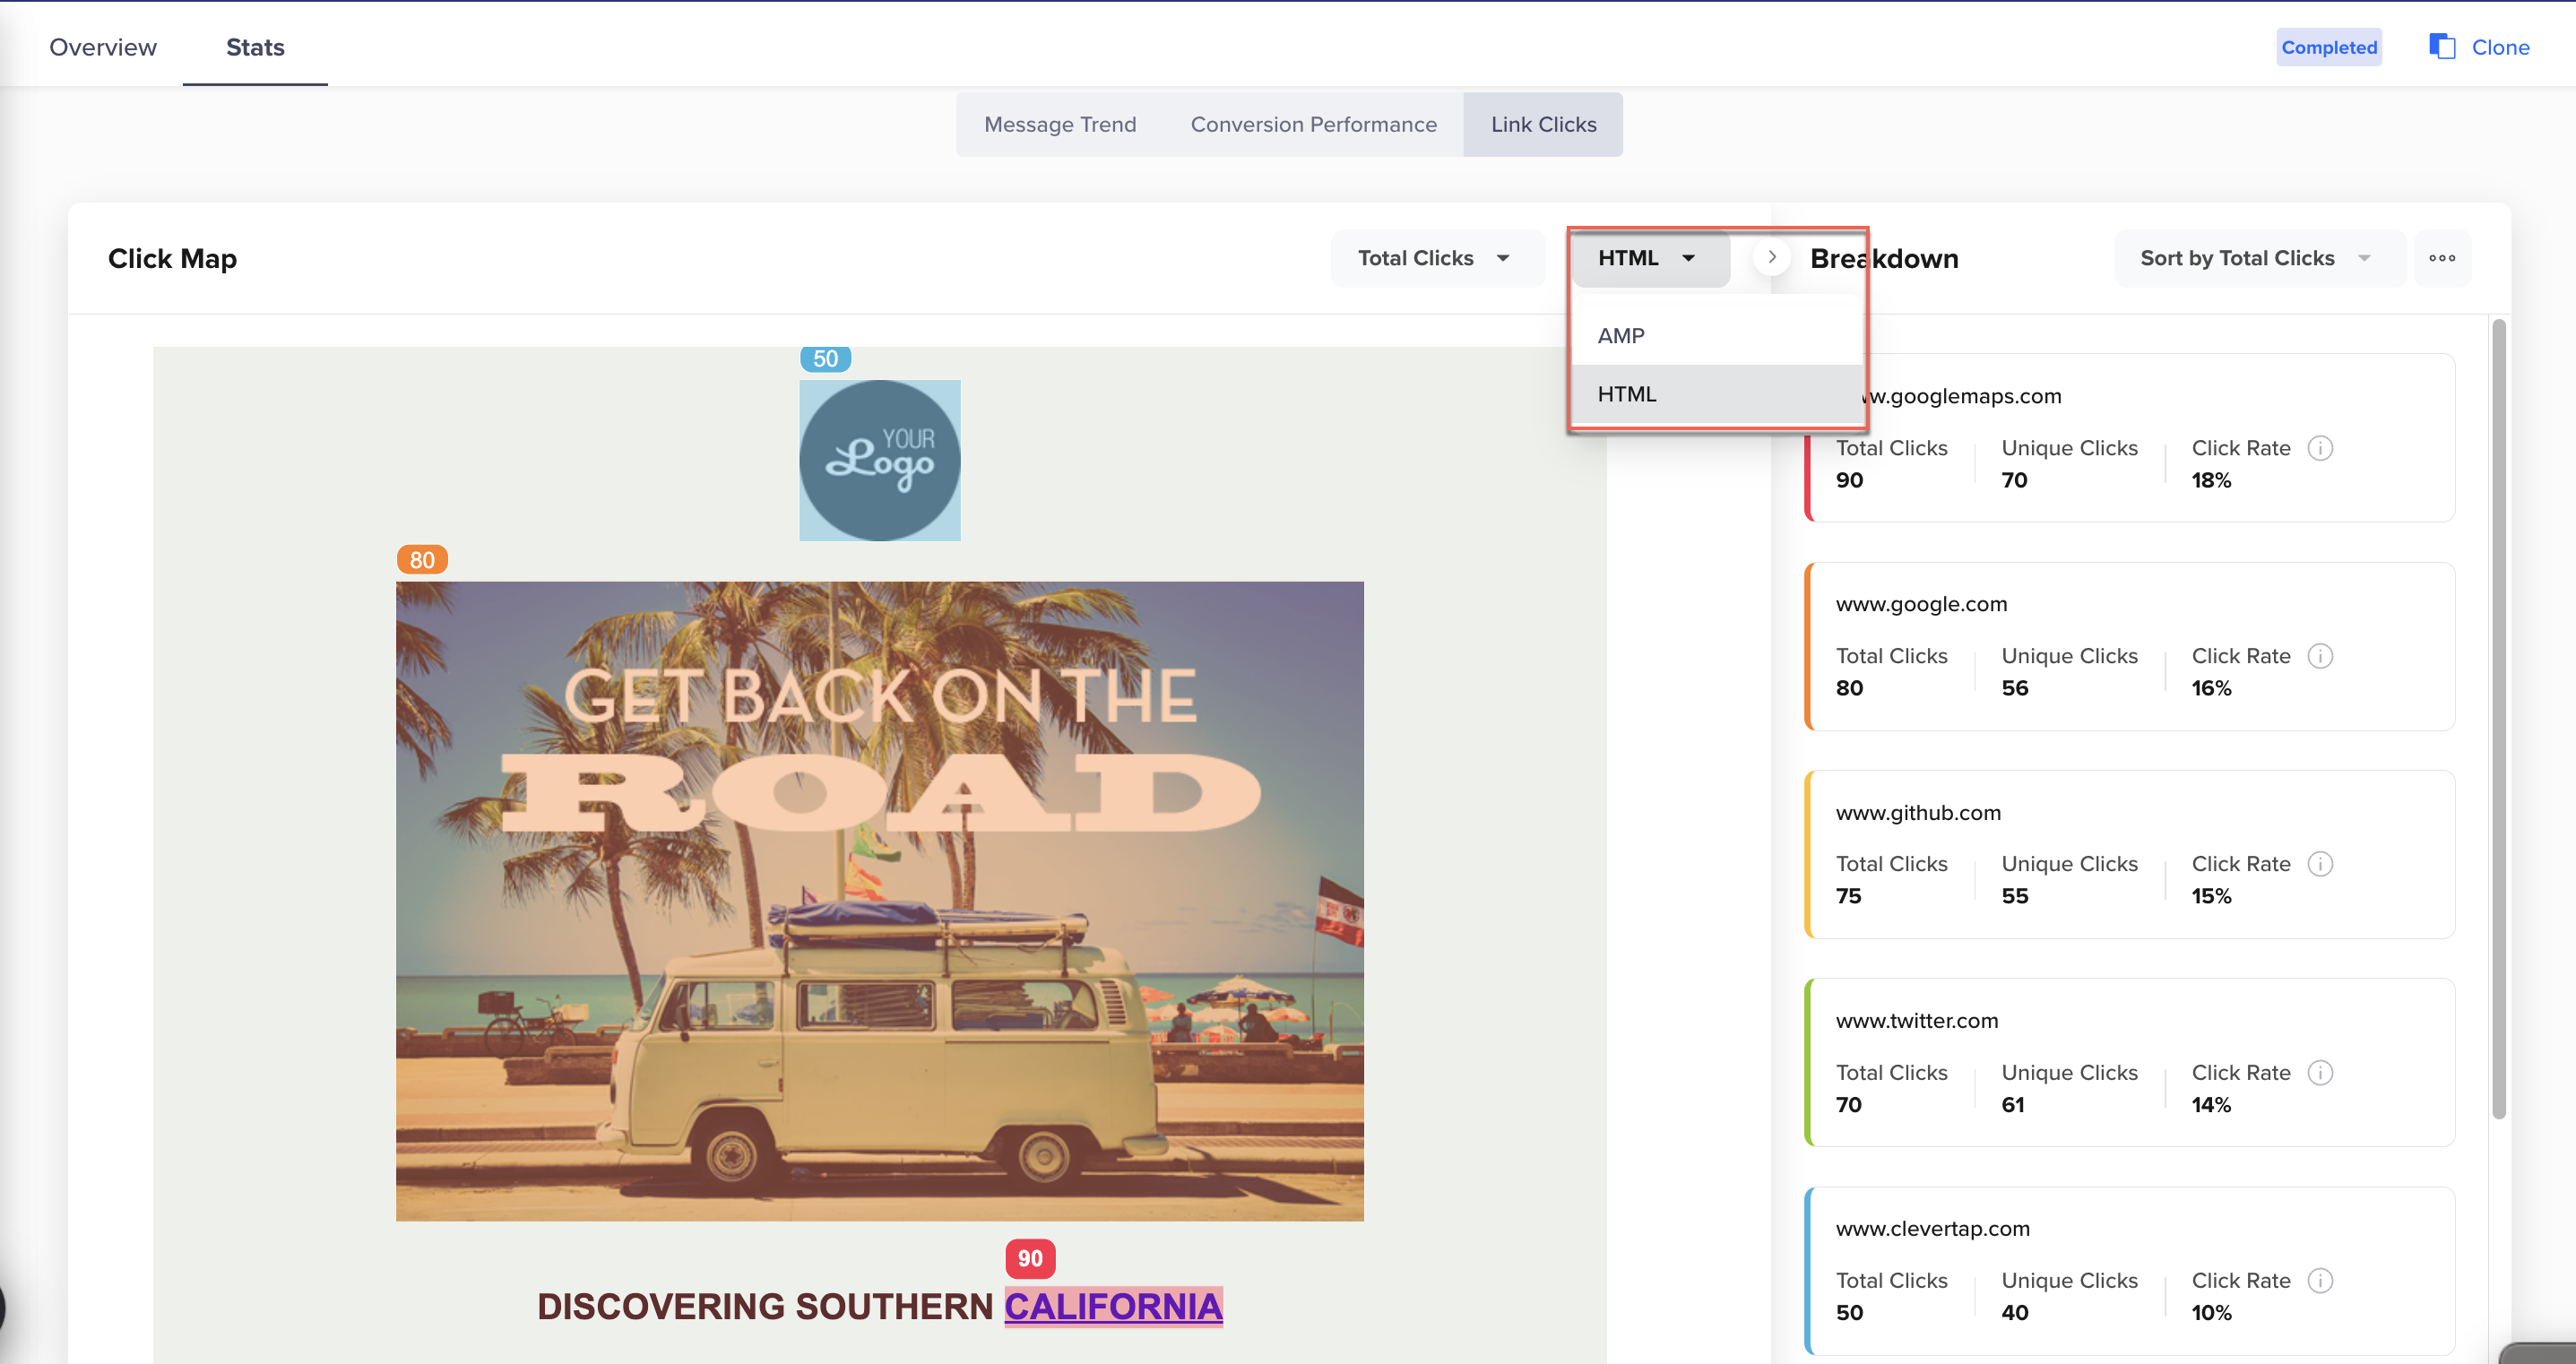
AMP and HTML Templates
The Click Map also provides click performance insights based on metrics such as unique clicks and click percentages. You must select metrics from the dropdown list, as shown in the following image:
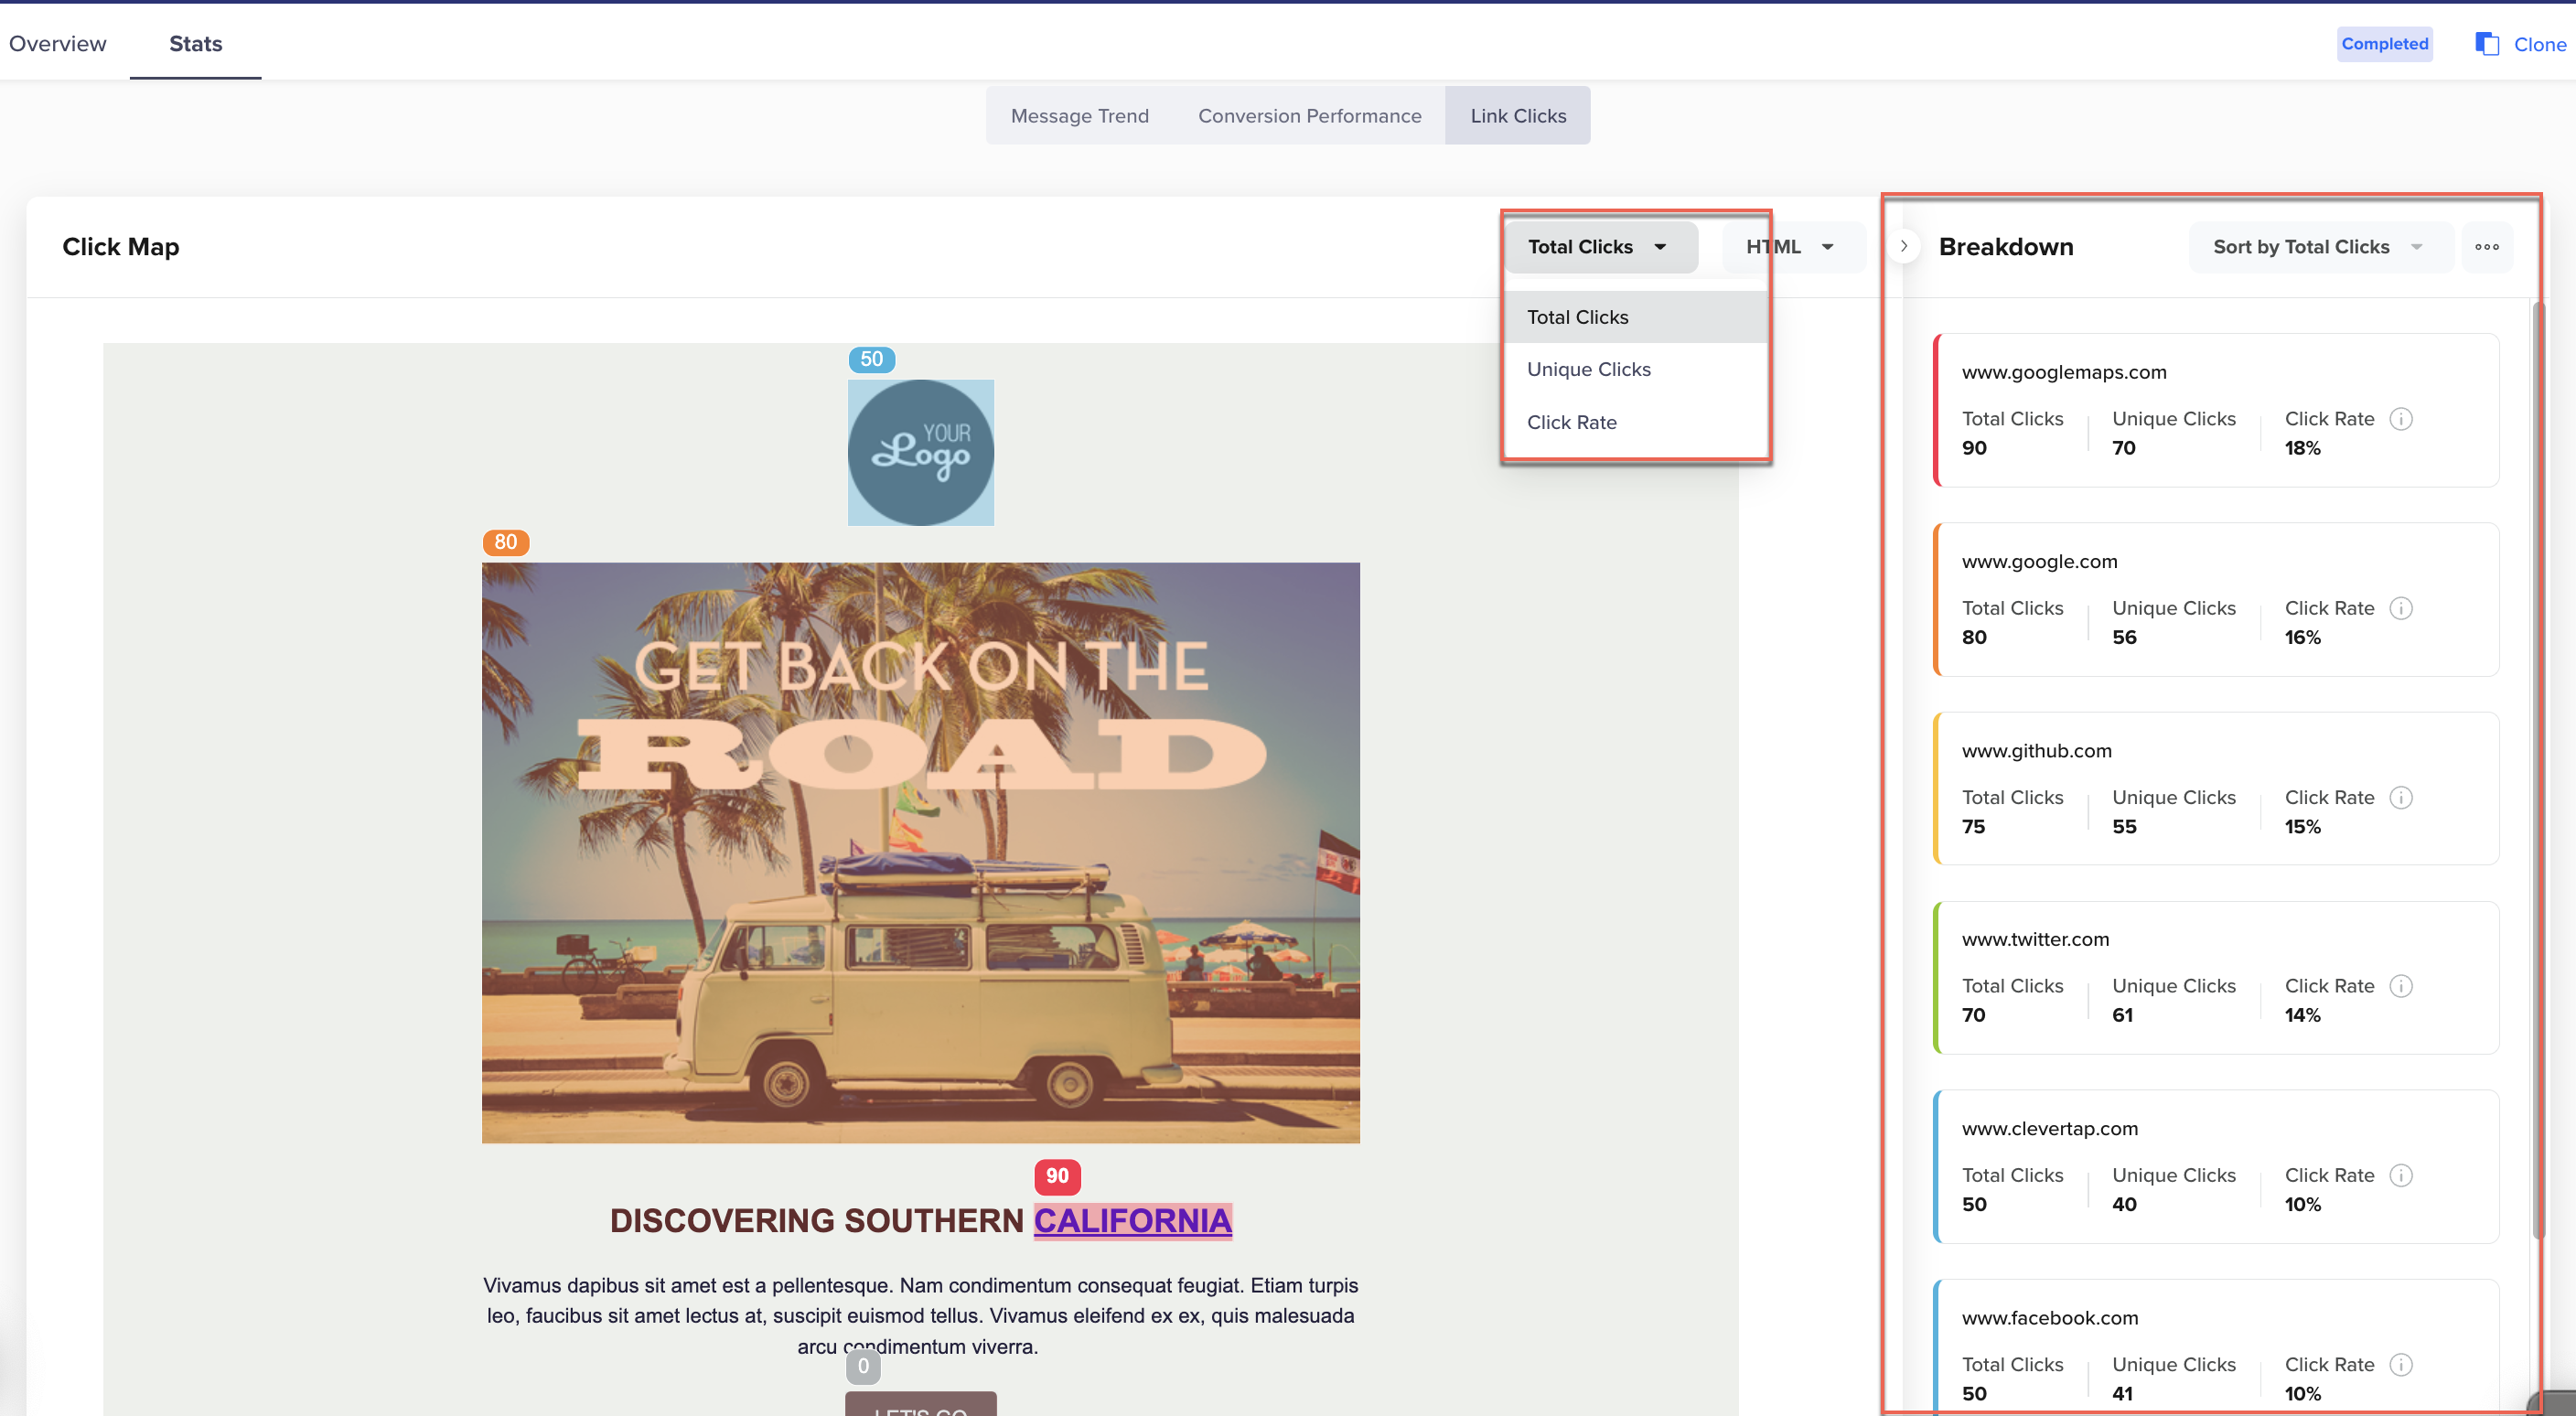
View Detailed Insights for Click Map
You can select from the following metrics:
- Total Clicks: Displays the total number of clicks for each link in the email, including multiple clicks by the same recipient.
- Unique Clicks: Displays the number of clicks made by unique users, ensuring each user is counted only once.
- Click Rate: Click rate represents the percentage of total campaign clicks attributed to a specific link. It is calculated as
[(Clicks on a specific link / Total link clicks in campaign) * 100].
The Breakdown section displays link click details in a tabular format, organized by color to represent the highest to lowest number of clicks.
Under the Breakdown section, you can also view the details of users who clicked on your email campaign. Additionally, you can sort the data by total clicks, unique clicks, and click rates for better analysis.
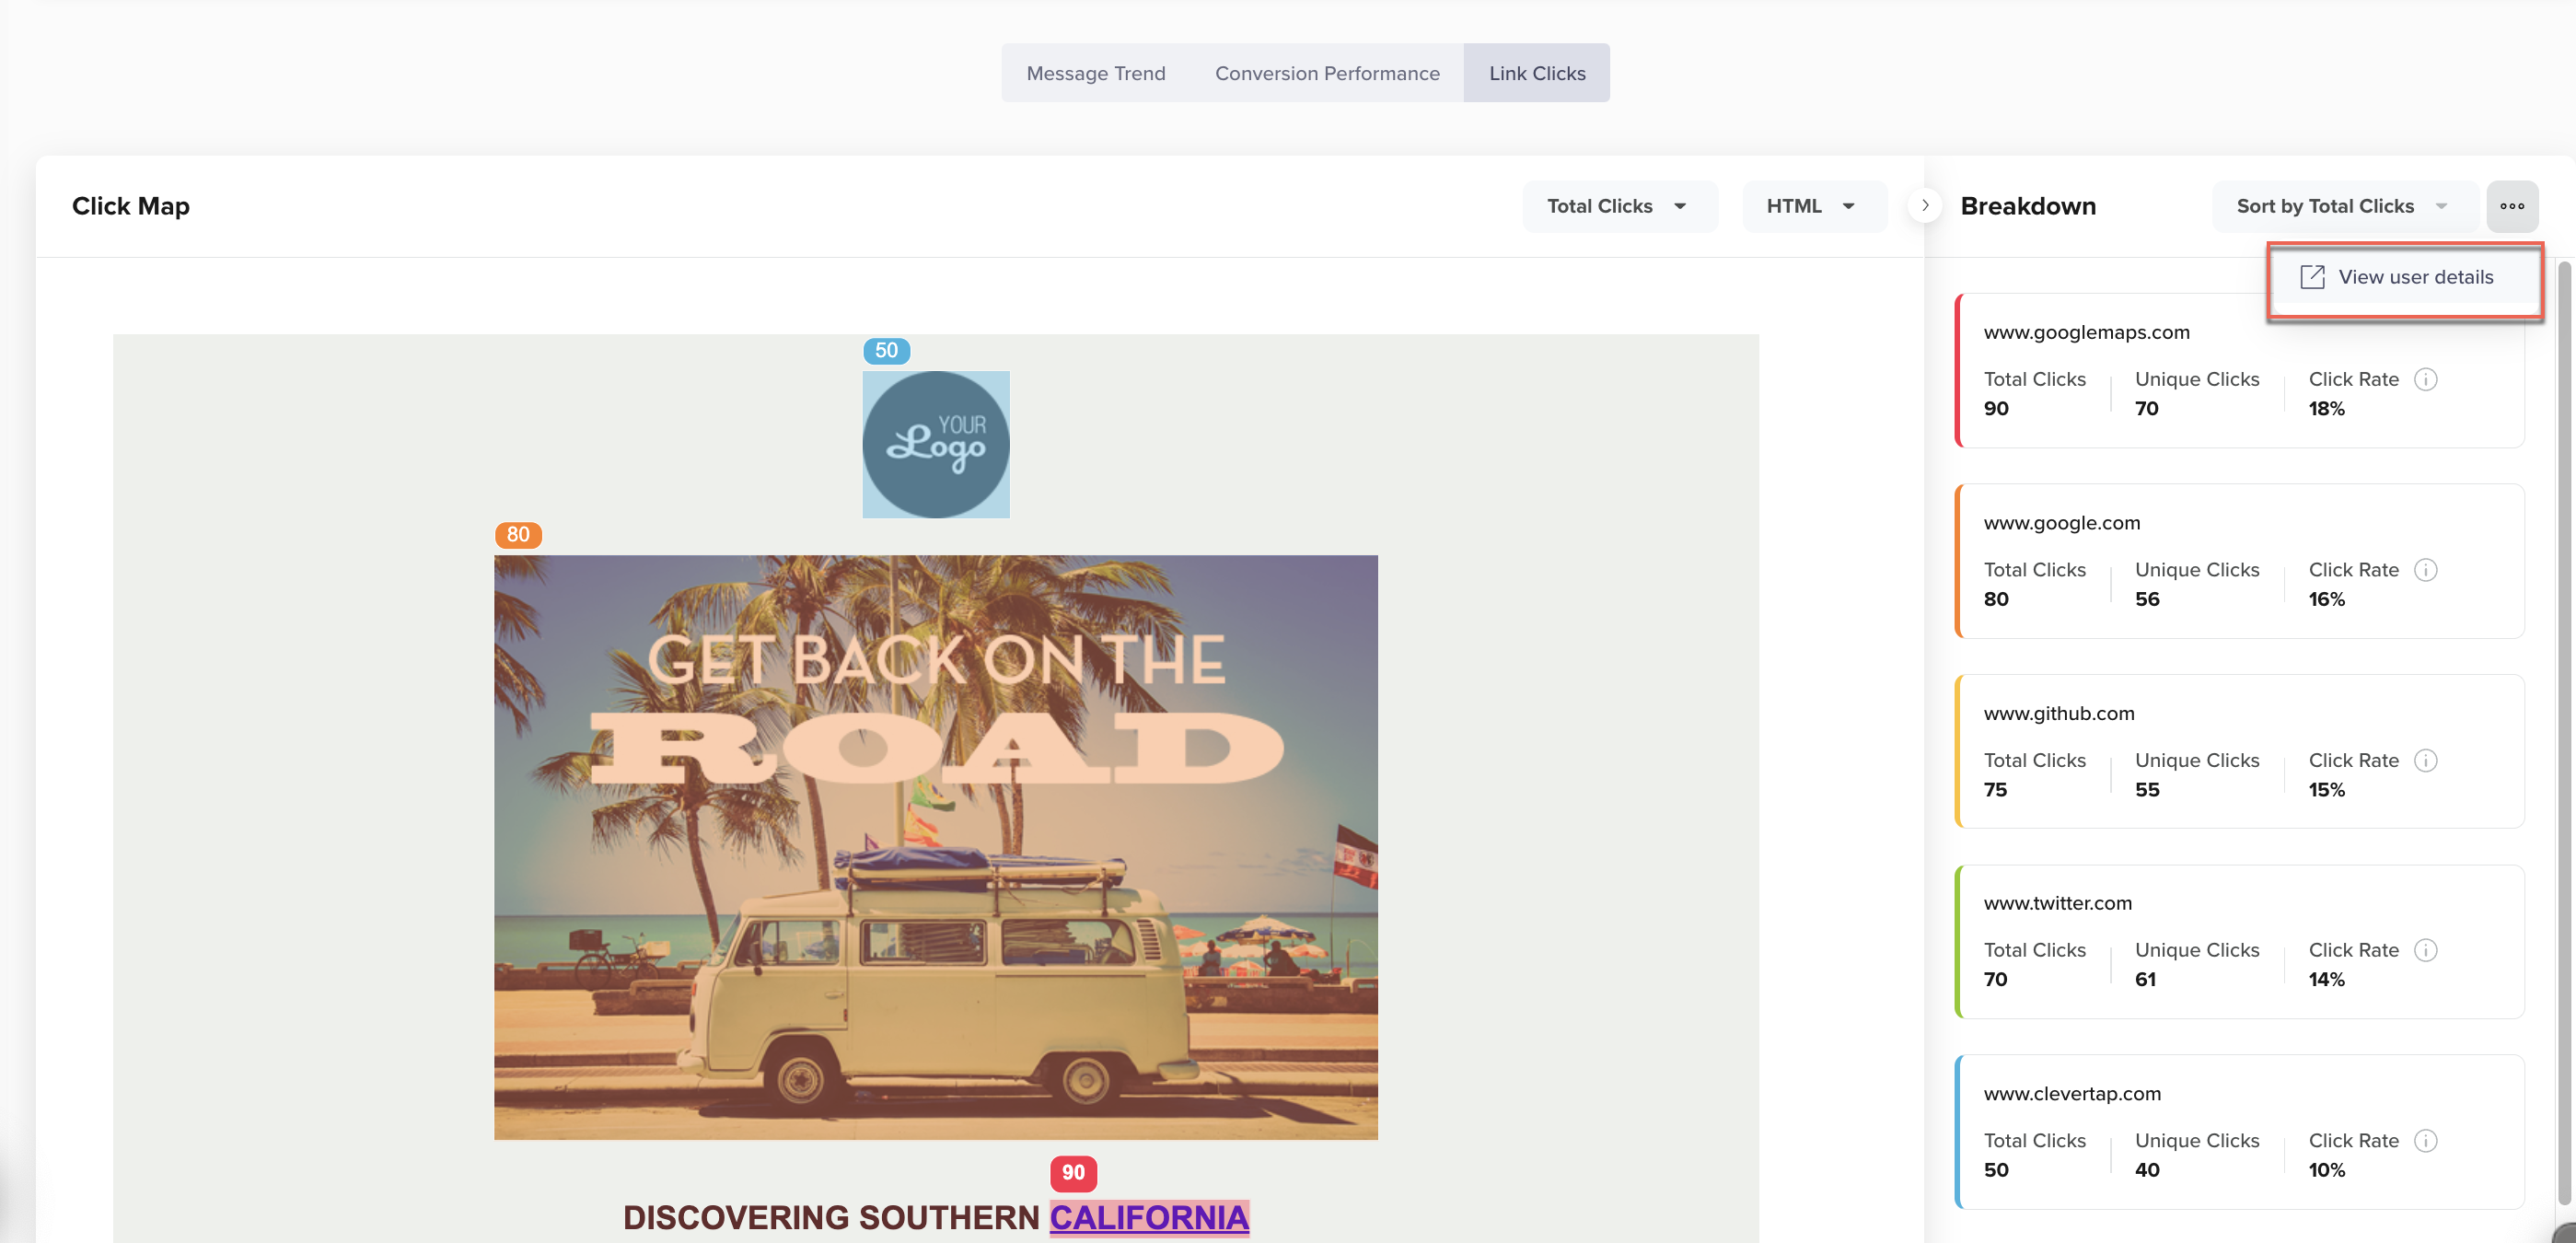
View User Details
Click the View User Details link to navigate to the Events page. Select the People tab to access detailed user information.

Event Analysis for Link Clicks
Click Map Data Reflects Latest EditsIf you edit the email in a recurring or live campaign and publish the changes, the Click Map reflects data for the latest version of the campaign. The statistics displayed are based on the updated version, and previous data will not be retained.
Errors
You can view campaign errors from the Stats > Errors tab.

Email Campaign Errors
Delivery Errors
Delivery errors occur when the ESP reports a failure in delivering the email to the recipient's inbox. These errors typically happen after the email has been successfully dispatched to the ESP but cannot be delivered to the end user. Common reasons include:
- Soft Bounce
- Hard Bounce
- Dropped
Soft Bounce
A soft bounce indicates that mail bounced due to one of the following reasons even though the email address was valid and the email message reached the recipient's mail server:
- The mailbox was full (the user has exceeded their storage quota)
- The recipient server was down
- The message was rejected as spam
- The message was too large for the recipient's inbox.
CleverTap campaign reports include soft bounces and do not mark the users as unsubscribed.
Hard Bounce
A hard bounce indicated that the email was returned to the sender and was completely undeliverable. However, common reasons it got rejected include:
- The email address does not exist
- The recipient's email server has rejected the email permanently
CleverTap campaign reports include hard bounces and mark the users as unsubscribed.
Deferred emailsThe time for retrying a deferred email and the number of retries depend on the ESP. For SendGrid, the retry period is set to 72 hours.
View Detailed Engagement Stats
You can also view the user details for notifications sent, viewed, clicked, and bounced from the Analytics page of the CleverTap dashboard. For more information about viewing such stats, refer to Analyze an Event .

Event Analysis for Notification Viewed
FAQ
Why are my Viewed and Clicked numbers unusually high? (Why is this in title casing?)
The Viewed and Clicked numbers in your email reports may be inflated due to spam filters, email forwards, or bot activity that automatically opens or clicks links. These interactions are not always from real users and can distort campaign performance data. To minimize false clicks, analyze engagement patterns and use CleverTap’s tracking tools. For more details, refer to Unusually High Email Opens and Clicks.
Updated 8 months ago