NPS Board
Learn how the NPS board helps you analyze your customer feedback
Overview
What is NPS?
NPS is an acronym for Net Promoter Score. It is a customer loyalty and satisfaction measurement that asks customers how likely they are to recommend your product or service to others on a scale of 0 to 10.
Aggregating NPS scores helps businesses gauge customer satisfaction and improve service, customer support, delivery, etc., to increase customer loyalty.
CleverTap's Net Promoter Score (NPS) dashboard provides a detailed view of the overall NPS feedback received from your customers. To view the NPS dashboard, navigate to Dashboard > Boards > NPS.
NPS Board
The NPS board represents the following data points:
- Overall NPS score
- Total responses received from the customers
The overall NPS score is calculated as the difference between the percentages of Promoters and Detractors (NPS = % of Promoters - % of Detractors).
At a high level, the NPS feedback for a question is categorized into three buckets - Detractors, Passive, and Promoters.
On a scale of 0-10 :
- A Detractor is anybody who gives a score between 0-6.
- Passive is anybody who gives a score of 7 or 8.
- Promoter is anybody who gives a score of 9 or 10.
Let us understand this with an example. For a standard NPS question, "How likely are you to recommend us on a scale from 0 to 10?” If 70% of respondents are Promoters and 10% are Detractors, then you have an NPS of 60.
You can filter the data by campaigns or using the date filter.
Refer to the following bar chart representing data for respective NPS buckets of Detractors, Passives, and Promoters.
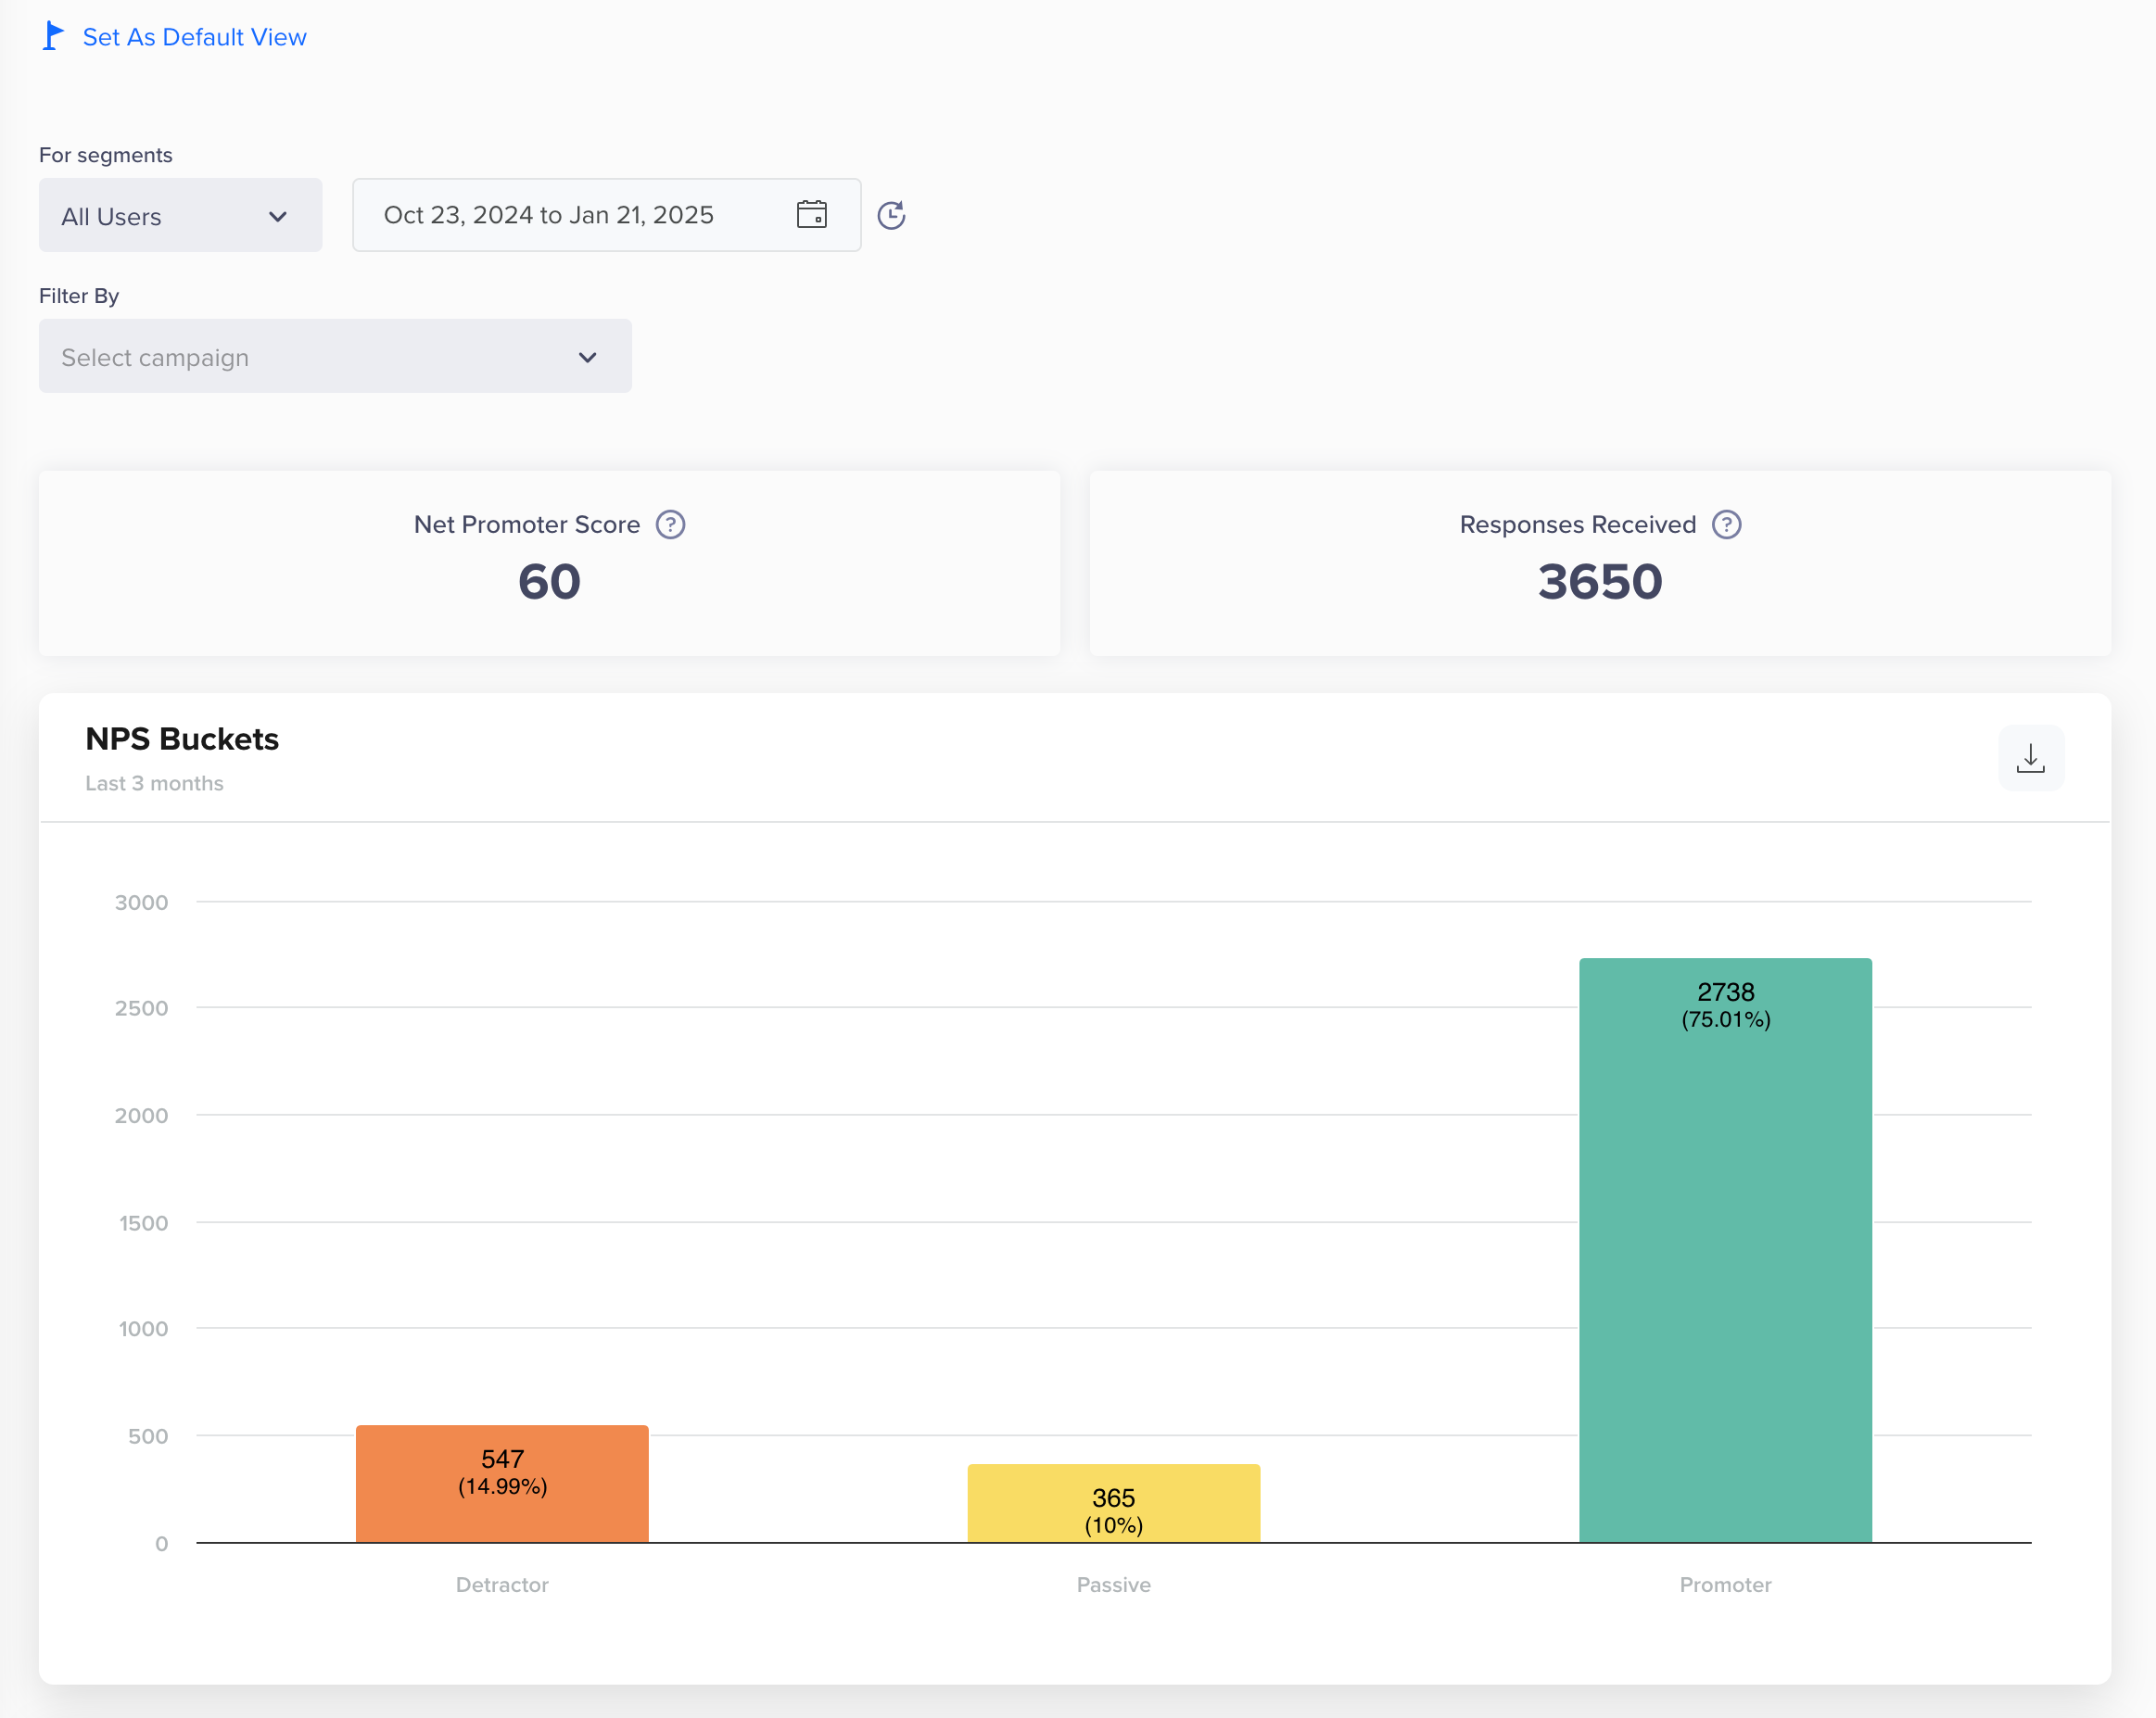
View NPS for All Users
The NPS board also provides:
- NPS Score Trend over a specific period (daily, weekly, monthly).
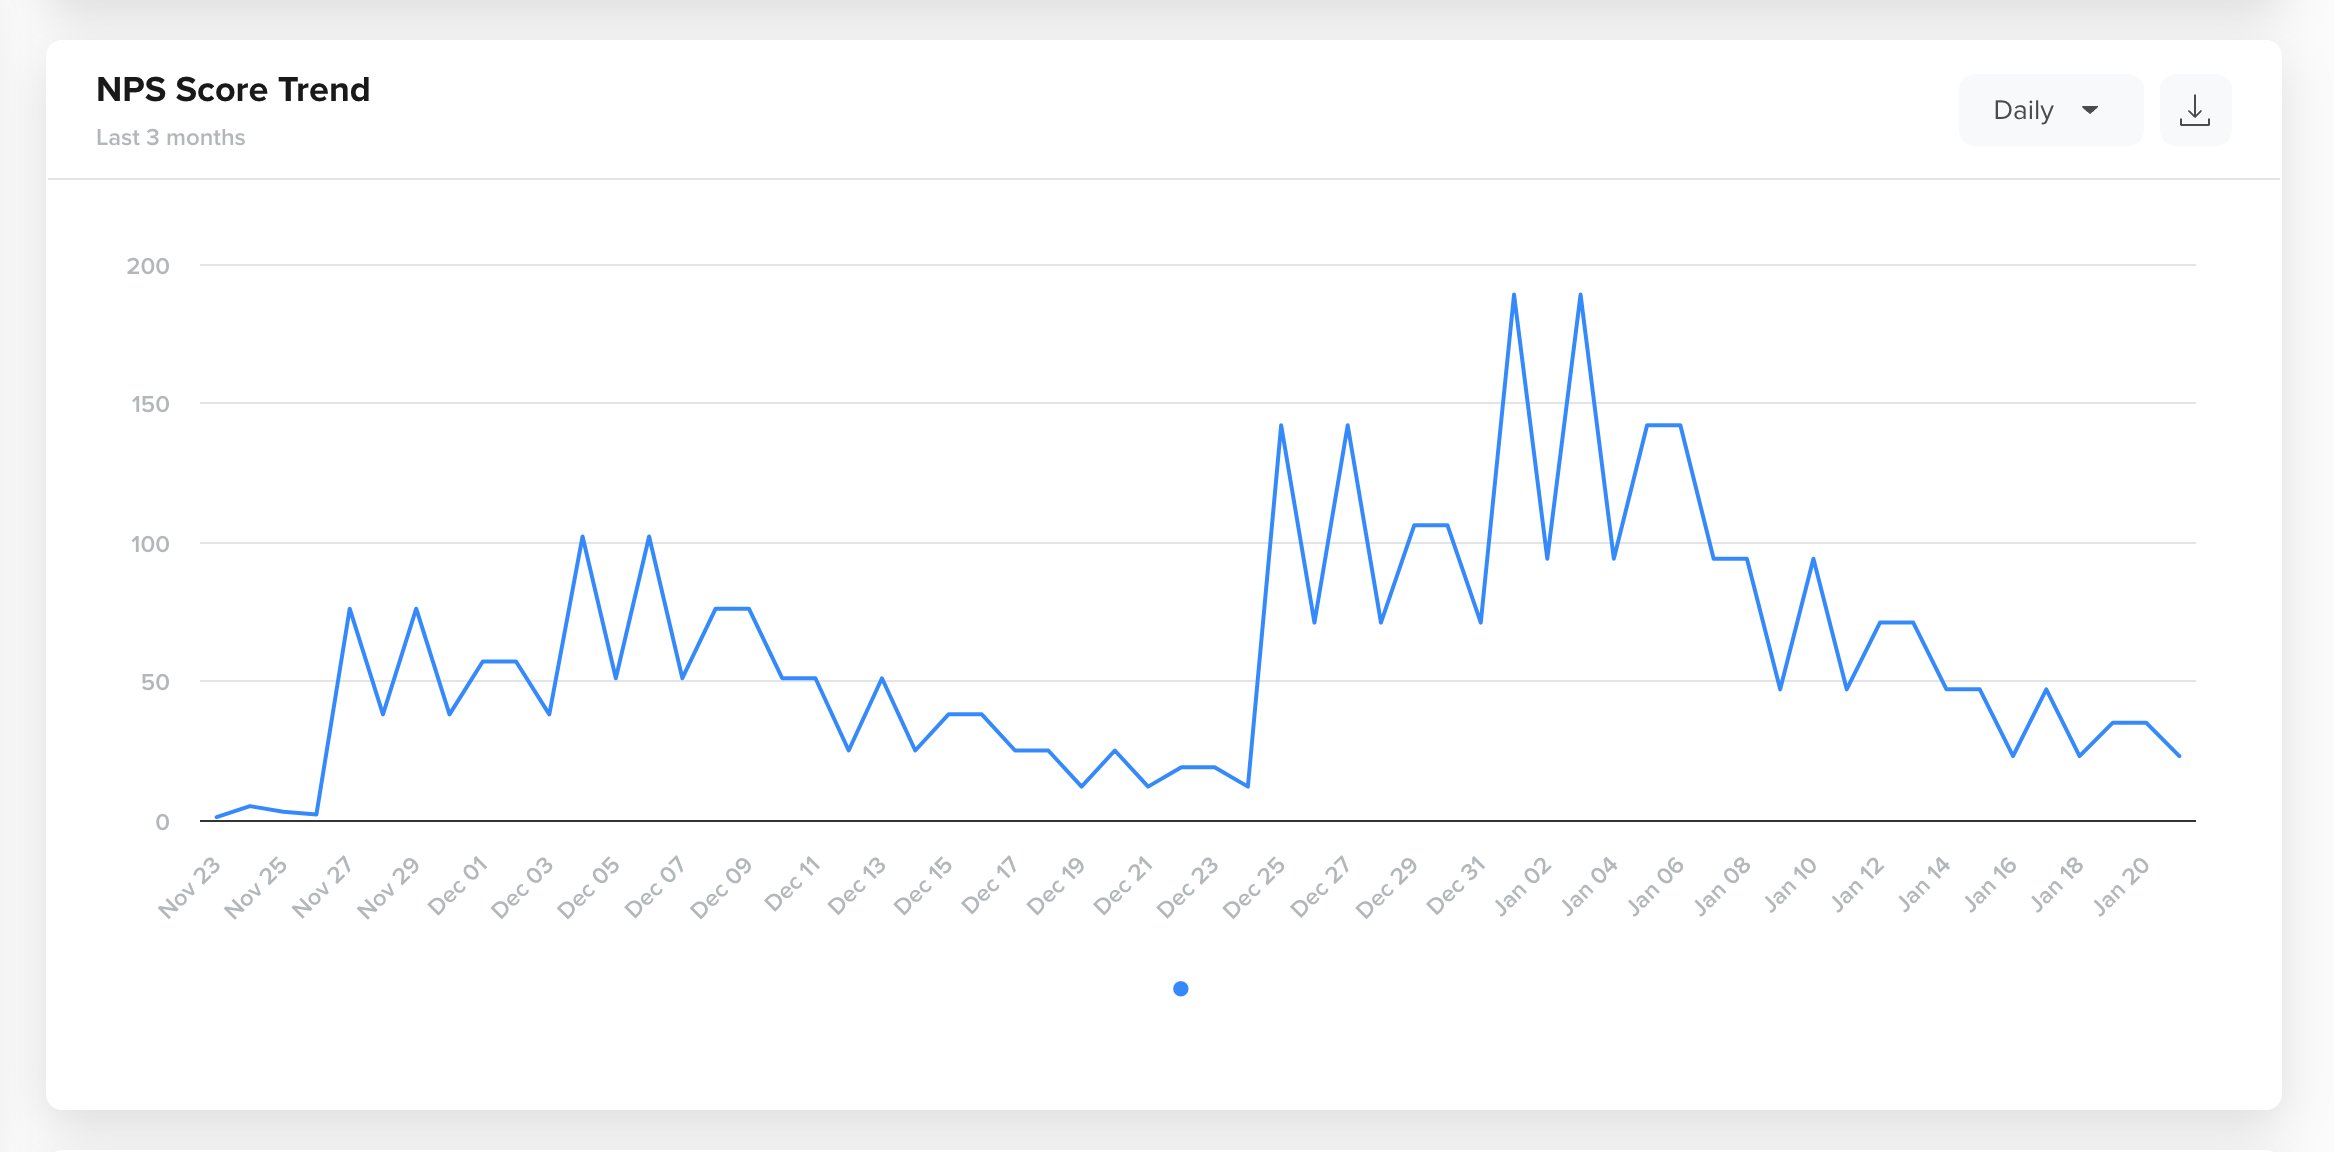
NPS Score Trend
- NPS Buckets Trend for Detractors, Passives, and Promoters over a specific period (daily, weekly, monthly).
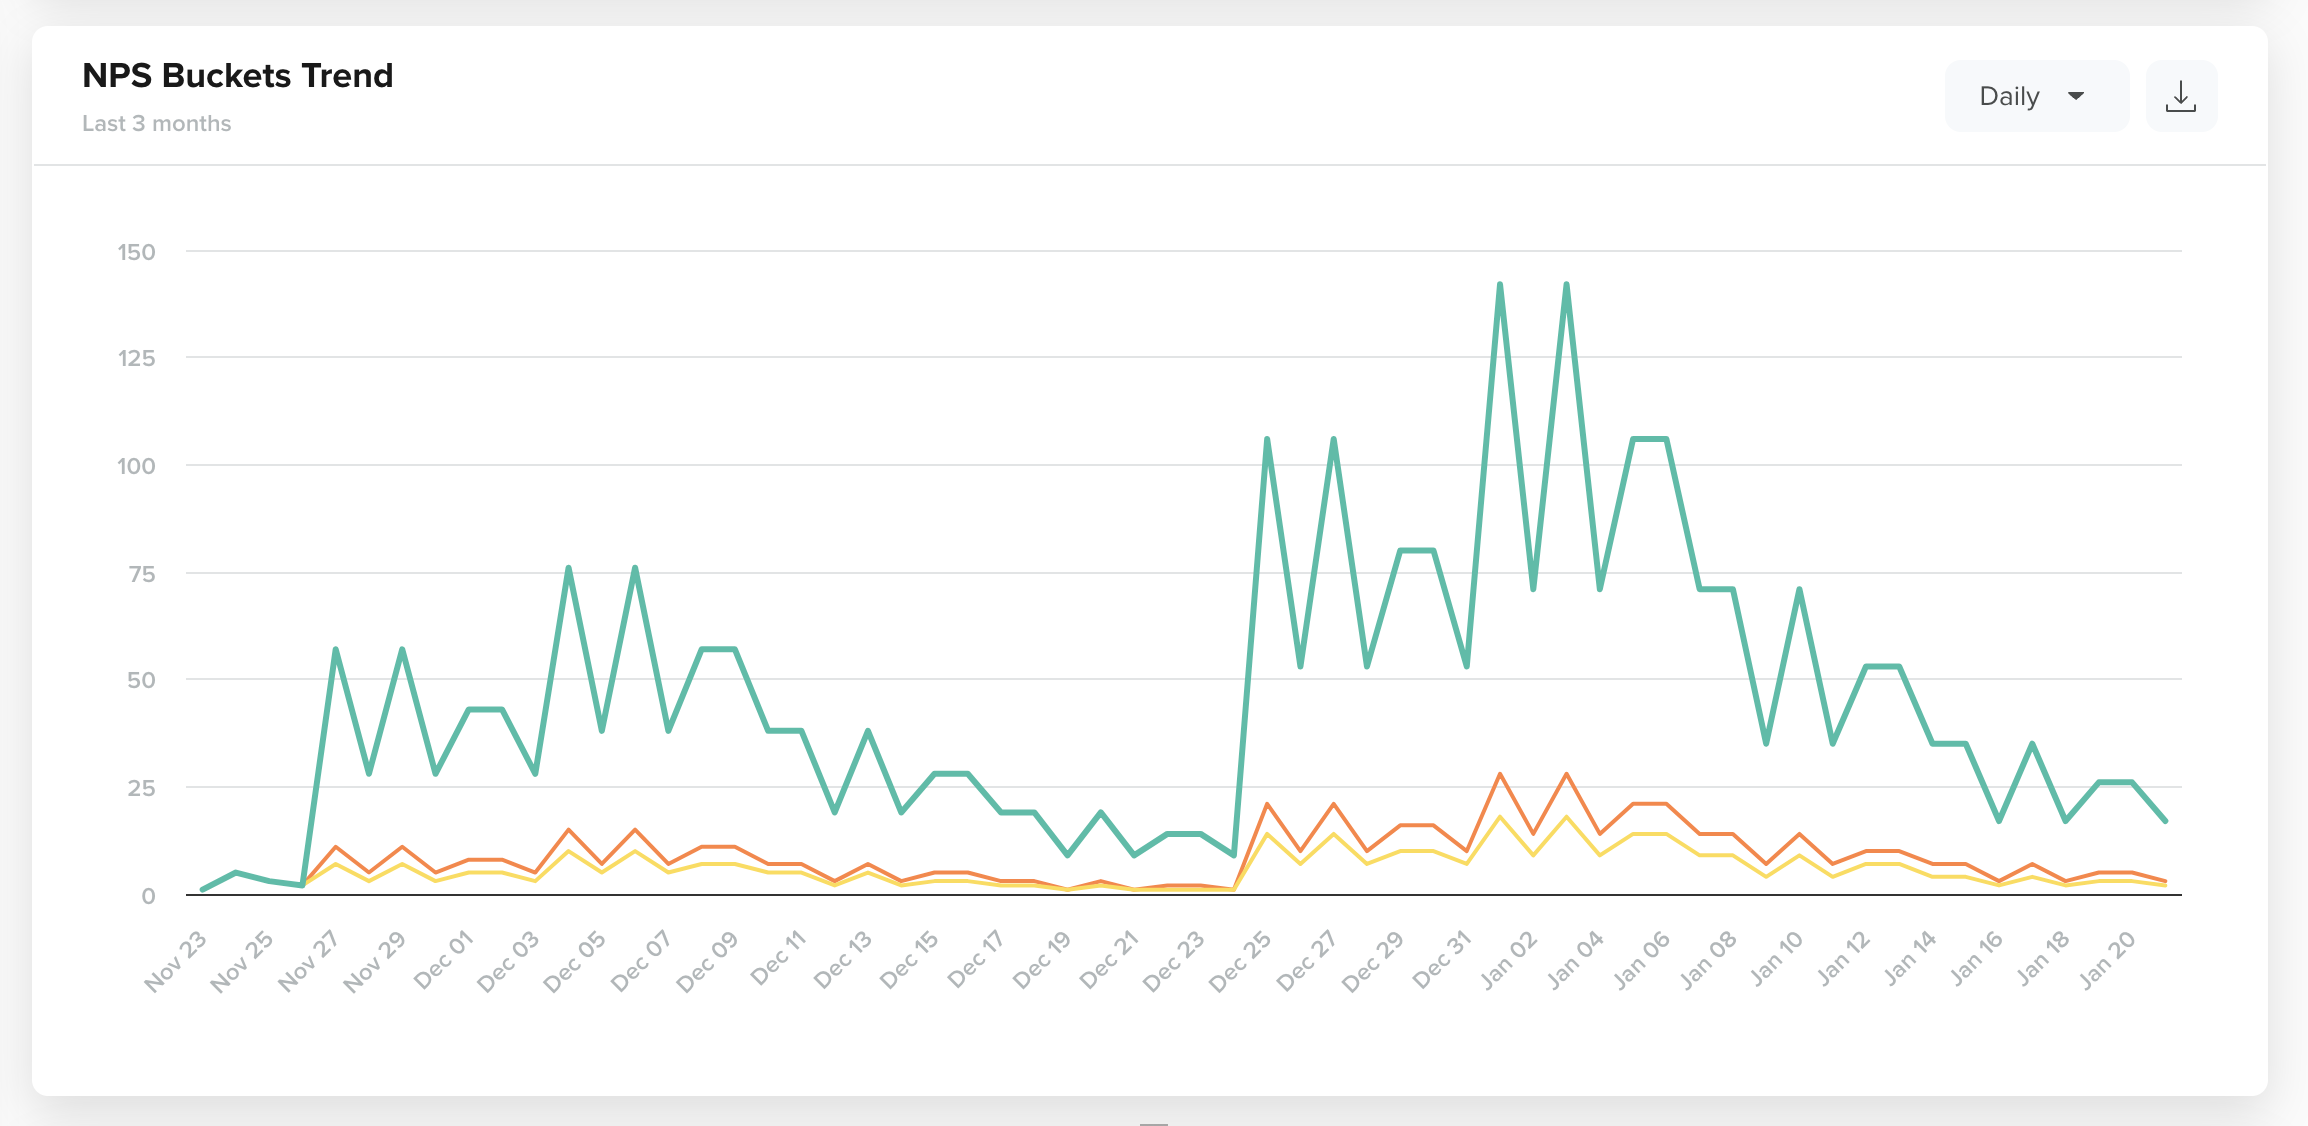
NPS Comparison
- A bar graph view of the Ratings Distribution for the selected duration
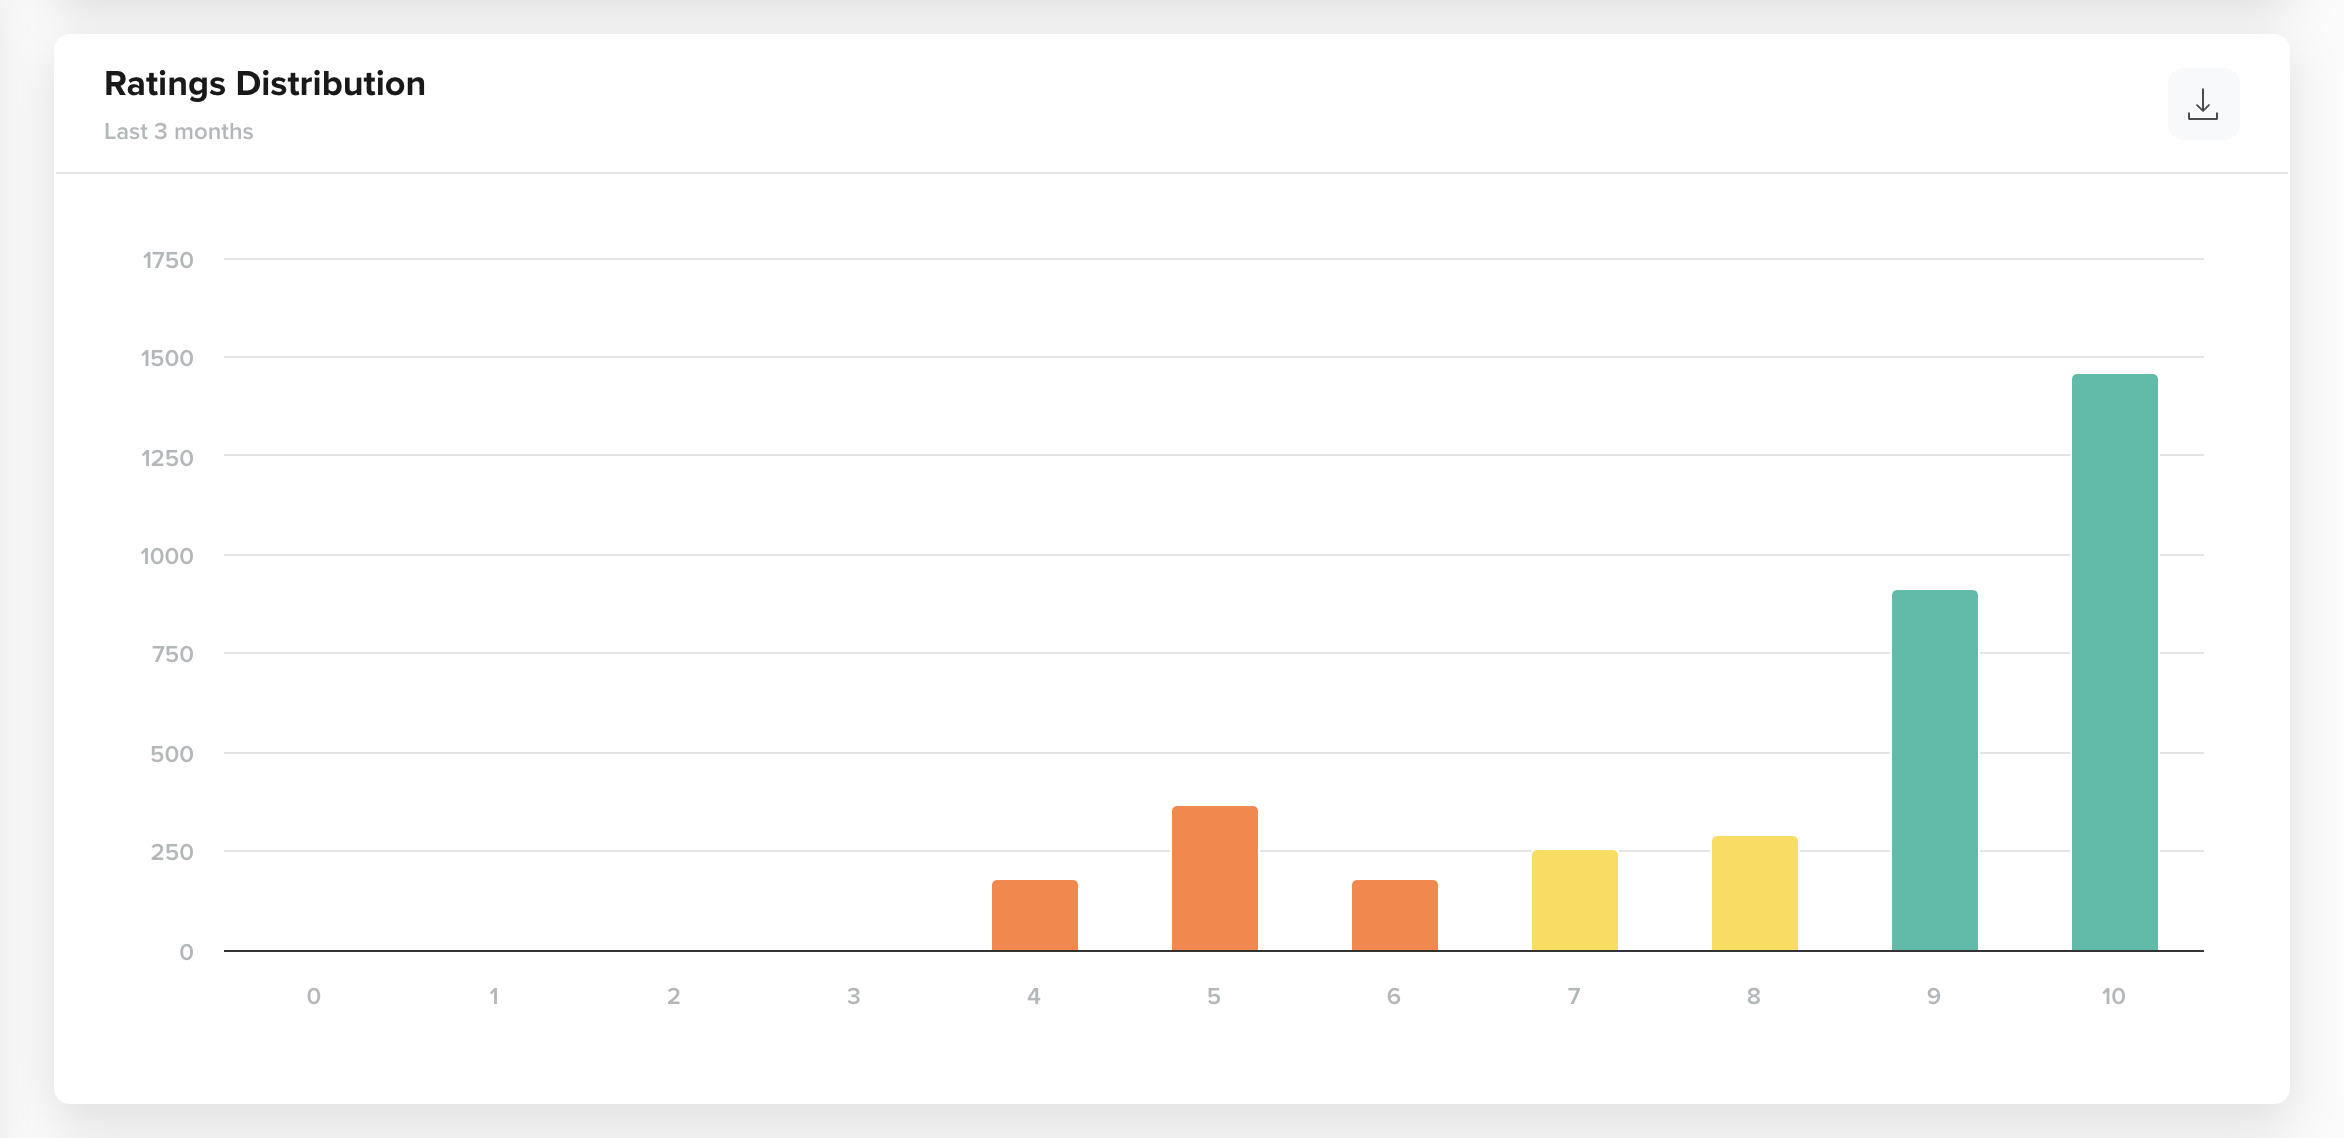
NPS Comparison
Additionally, you can view the trend chart for Total Responses Received on a daily, weekly, and monthly basis.

Total User Responses
To understand event-related information in detail, refer to user ratings.
Updated 3 months ago