Trends
Overview
Trends provide you the capability to understand how users are using the platform. By using its functionality, the customer can display data in a number of ways using all the powerful building blocks in CleverTap such as events, event properties, user properties, and segments.
With trends, the user can do the following:
- Plot a trend of event occurrences.
- Compare the trend of multiple events to reveal and understand the underlying patterns.
- Compare the trend across multiple event property values of an event.
- Compare the trend of events across user properties.
- Summarize the trend by event properties.
- Compare trends by multiple segments.
View a Trend
To set up a trend analysis, select the event you would like to analyze. As an option, you can restrict your analysis further to a specific property of that event.
To view a trend, perform the following steps:
- Navigate to Analytics > Trends.
- Select an event to analyze and view a trend. You can also filter your analysis further by the event property.
- Click View trend.
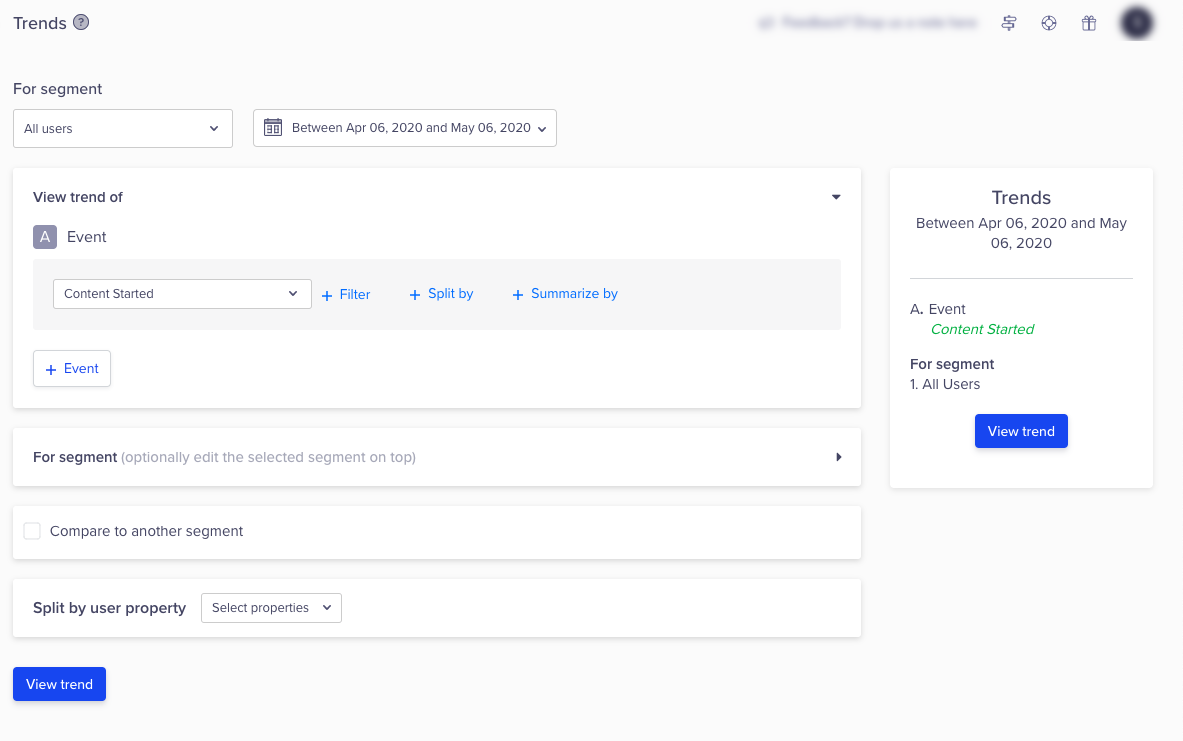
Select Trend Options
The trend results displays:
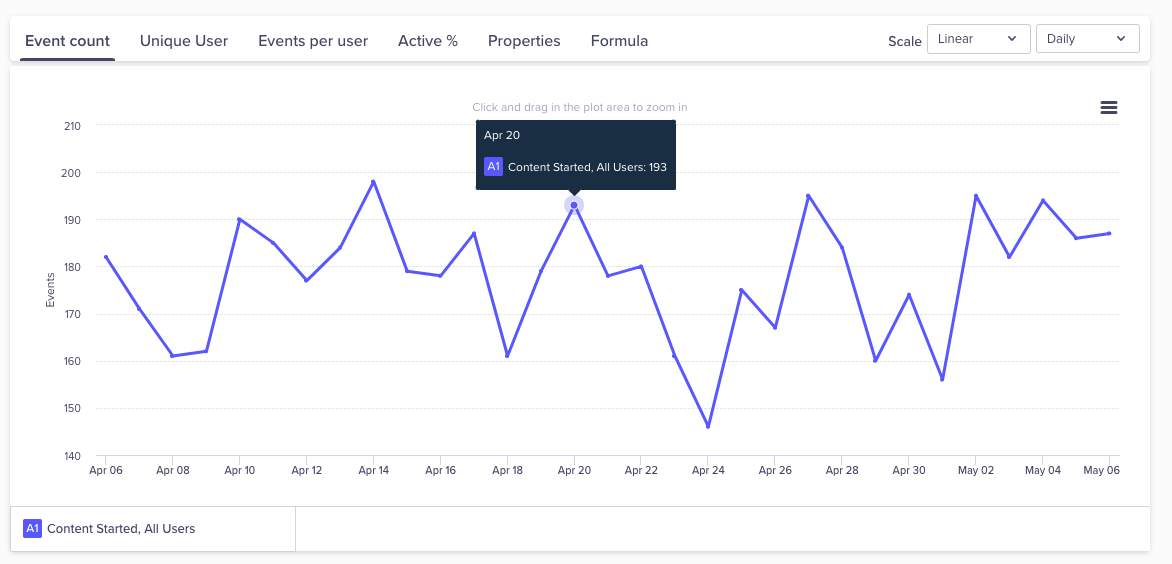
View a Trend Results
Filter by Event Property
When selecting an event for analysis, it is possible to narrow the search criteria by filtering the underlying event properties. All subsequent analysis is performed on these filtered event properties. All other event properties of the selected are not considered.
Advanced Filtering
Advanced filters restrict your analysis to a specific segment of users. Create a segment based on any combination of past behaviors in combination with any set of user properties.
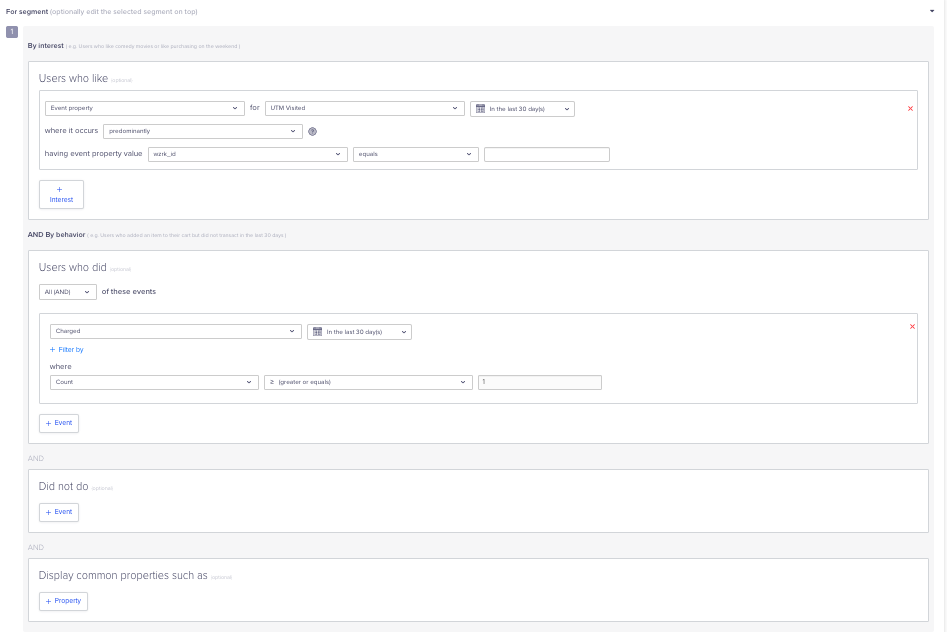
Advance Filtering for Trend
The trend result displays.
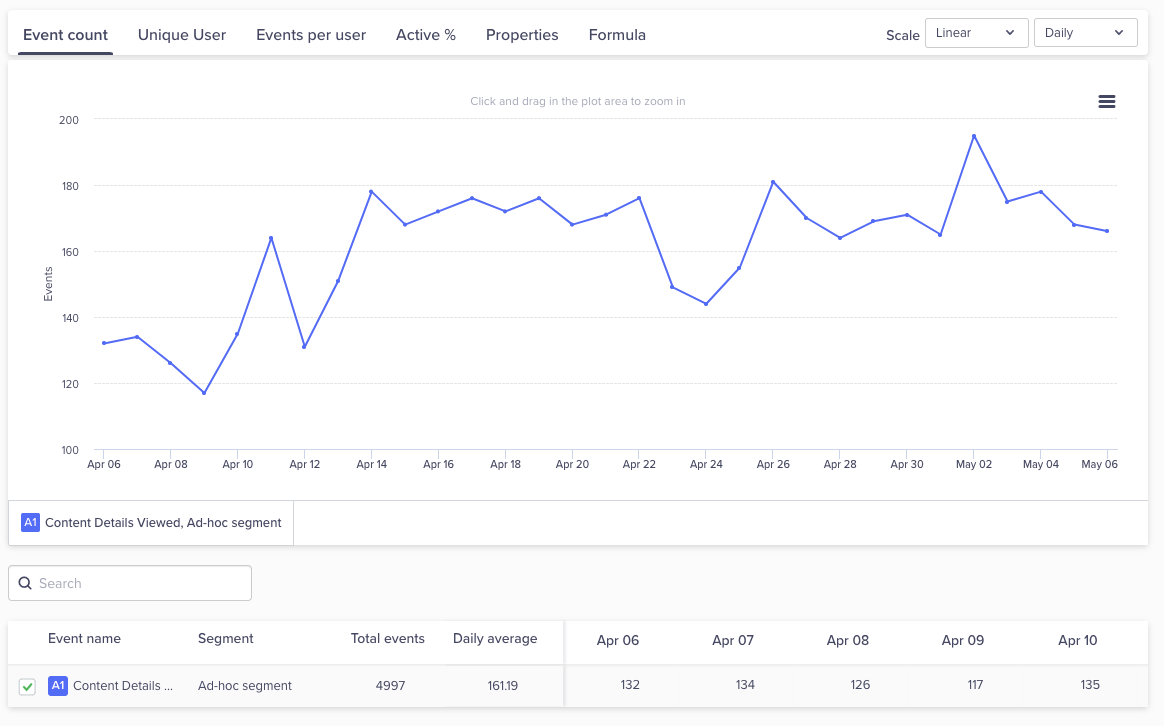
View Filtered Trend Results
Feature Availabilities
The advanced filter is a general feature available for all analytics features and most campaigns. Read more in the Segments guide.
Add Trends
You can view trends for multiple events. For example, you can understand the correlation between two events, such as song played and song downloaded.
To view a trend, perform the following steps:
- Navigate to Analytics > Trends.
- Select an event to analyze and view a trend. You can also filter your analysis further by the event property.
- Click + Event to add an event.
Note
You can add up to five events for analysis.
- Click View trend.
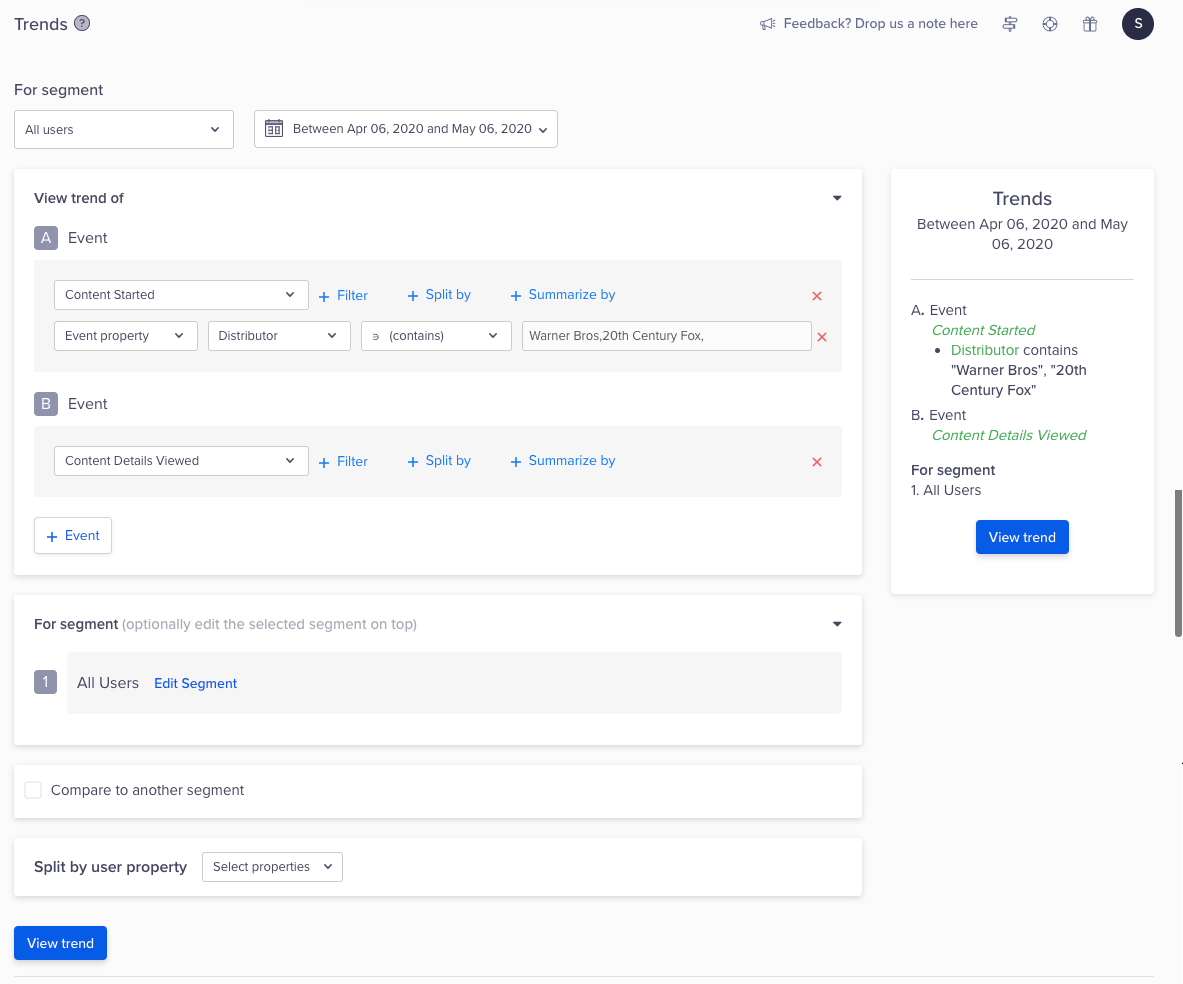
Add Trends
The trends for the selected events displays.
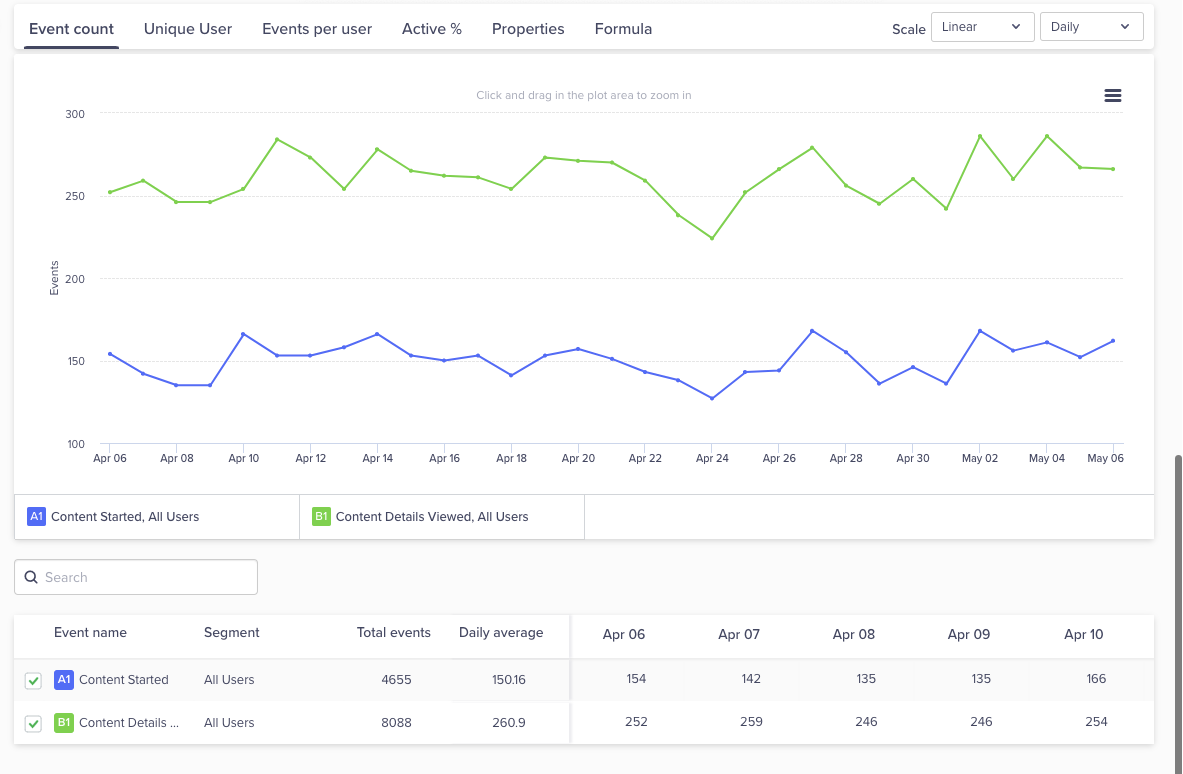
View Trend Results
Split by Event Property
You can split the analysis of your event by the underlying event properties. For example, consider the event Content Started which indicates the user started watching content. Here, you can split this event by its underlying event properties such as Primary Genre. Now, this will split your single Content Started trend line into multiple trend lines, so each trend line displays the event property value for each of the event property. For example, Primary_Genre displays trend lines for values such as Romance, Drama, Action, and so on.
To split a trend by event property, perform the following steps:
- Navigate to Analytics > Trends.
- Select an event to analyze and view a trend.
- Click + Split by the link to filter the trend by the event properties.
- Click View trend.
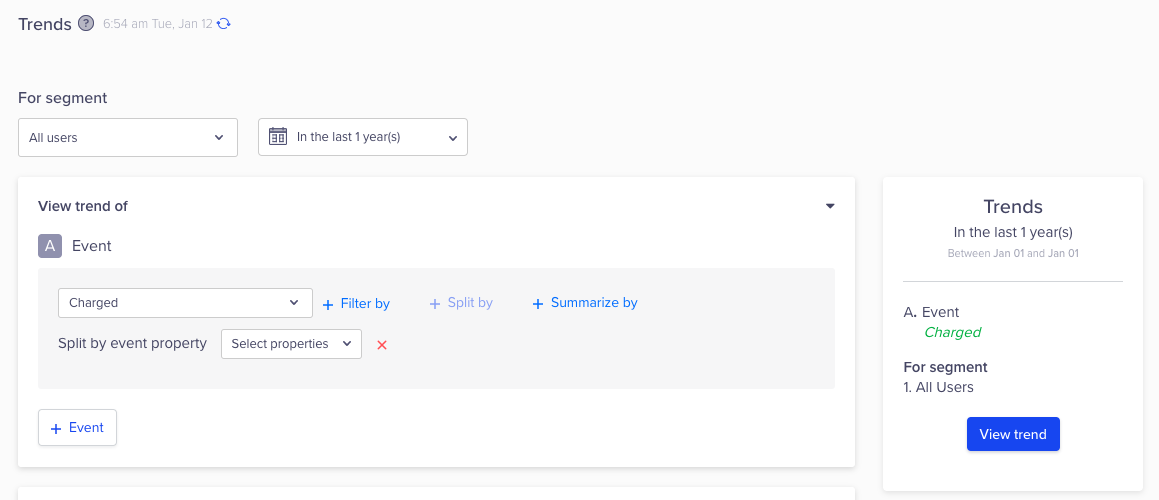
Split by Event Property
The trend for each event property displays.
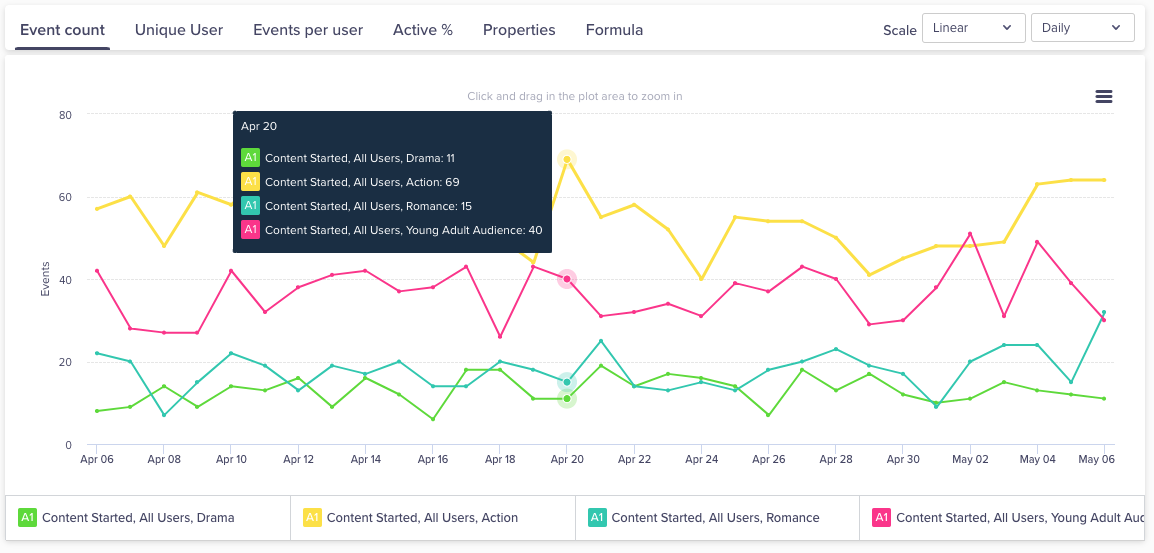
View Split Trend Results
All the split event properties are listed at the bottom. You can do the following:
- Search through the listed event properties using the search box.
- Select or clear the event properties from the trend by selecting the specific checkbox.
- Sort the event properties from highest to lowest value and vice versa using the arrows.
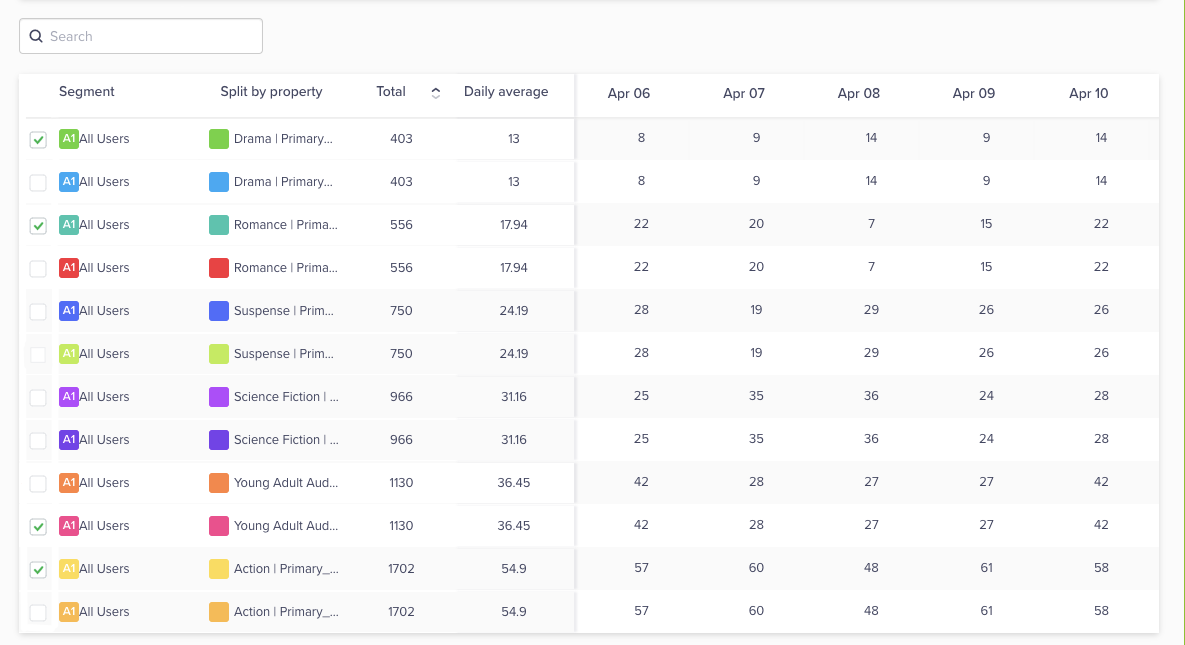
View Split Event Properties
Maximum Split
You can split by a maximum of three event properties per event.
Split by User Property
You can analyze your trend by the underlying user properties. For example, consider the event Content Started which indicates the user started watching content. Here, you can split this trend by its underlying user properties such as Customer_Type. This splits your single Content Started trend line into multiple trend lines, so each trend line references the user property value. For example, the user property Customer_Type is split by user property values such as Subscribers, Free Users, and so on.
To split a trend by user property, perform the following steps:
- Navigate to Analytics > Trends.
- Select an event to analyze and view a trend.
- Select the user property from the Split by user property list.
- Click View trend.
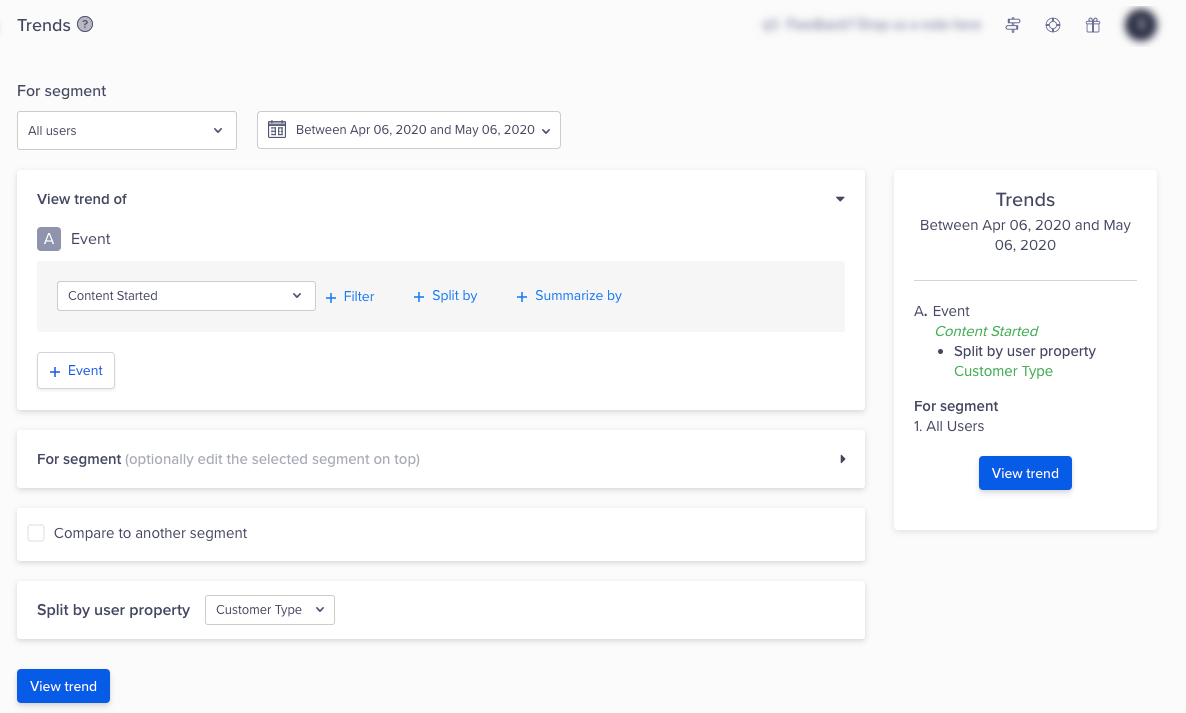
Split by User Property
The trend for each user property displays.
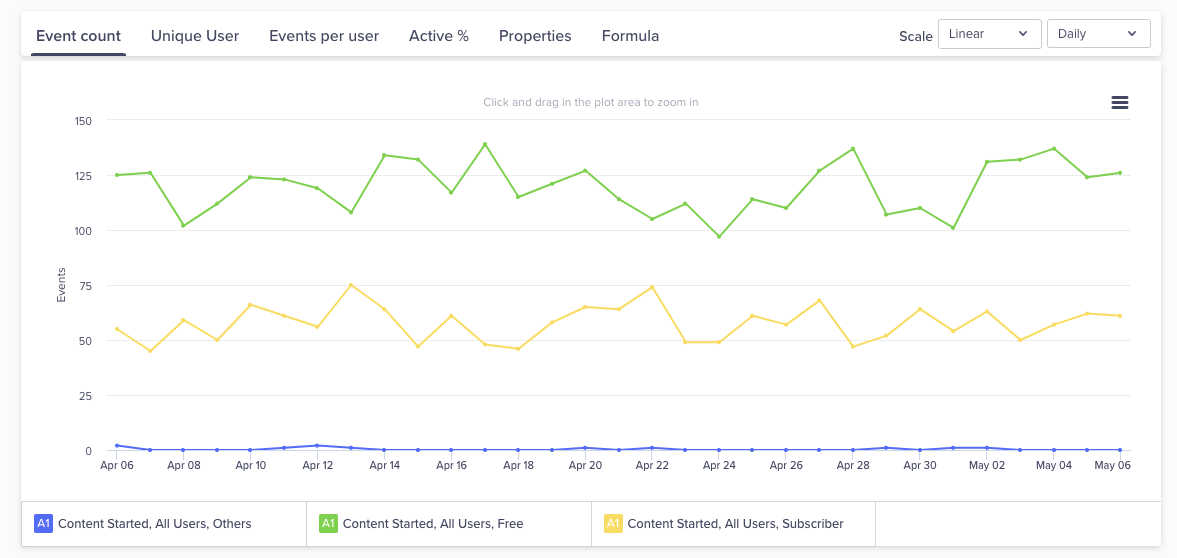
View Split Trend Results
All the split user properties are listed at the bottom. You can do the following:
- Search through the listed user properties using the search box.
- Select or clear the user properties from the trend by selecting the specific checkbox.
- Sort the user properties from highest to lowest value and vice versa using the arrows.

View Split User Properties
Maximum Split
You can split by a maximum of two user properties.
Compare Trends Across Segments
You can choose to compare your event trend with different segments. For example, compare the trend for the Content Started event across the New York Users segment and the London Users segment. The differences in the segment trends could reveal a difference in your users' behavior in each segment resulting in invaluable insights. For example, you can compare the trend of content watched by users in both cities. If the trend in either of the cities is lower, you may want to check for competing content in that city.
To compare trends across segments, perform the following steps:
- Navigate to Analytics > Trends.
- Select an event to analyze and view a trend. You can also filter your analysis further by the event property.
- Select the Compare to another segment box.
- Select a segment from the list or create an ad-hoc segment. For more information, refer to Segments.
- Click View trend.
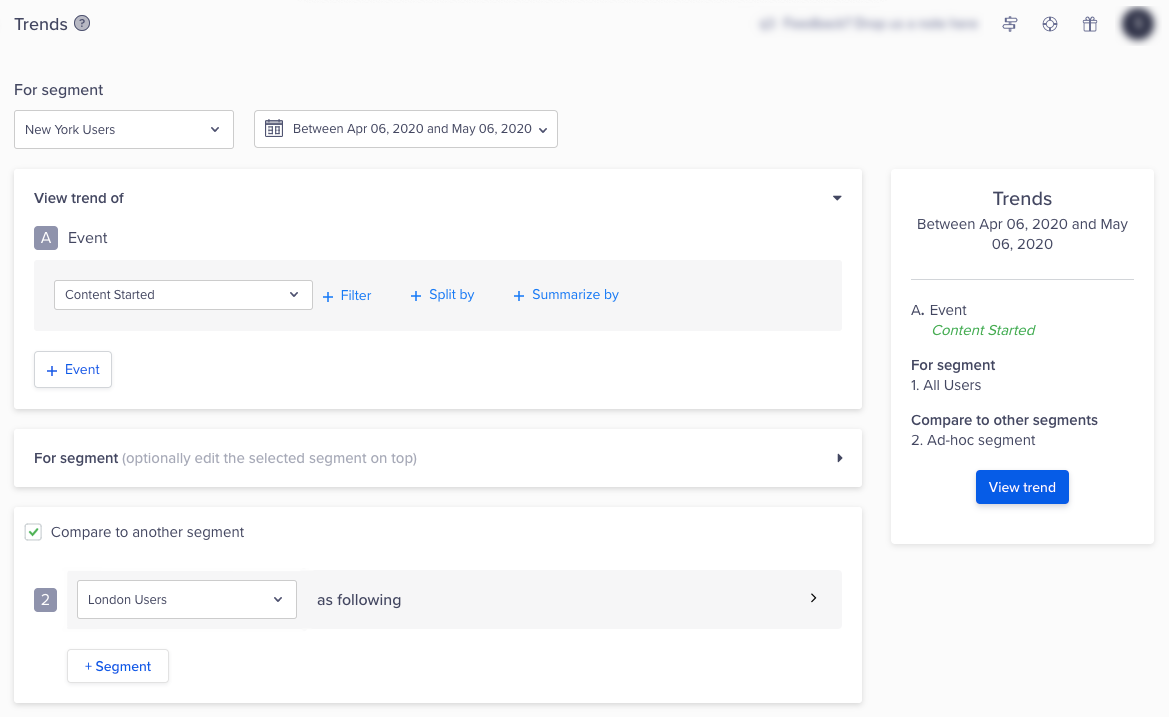
Compare Trends Across Segments
The trend results display.
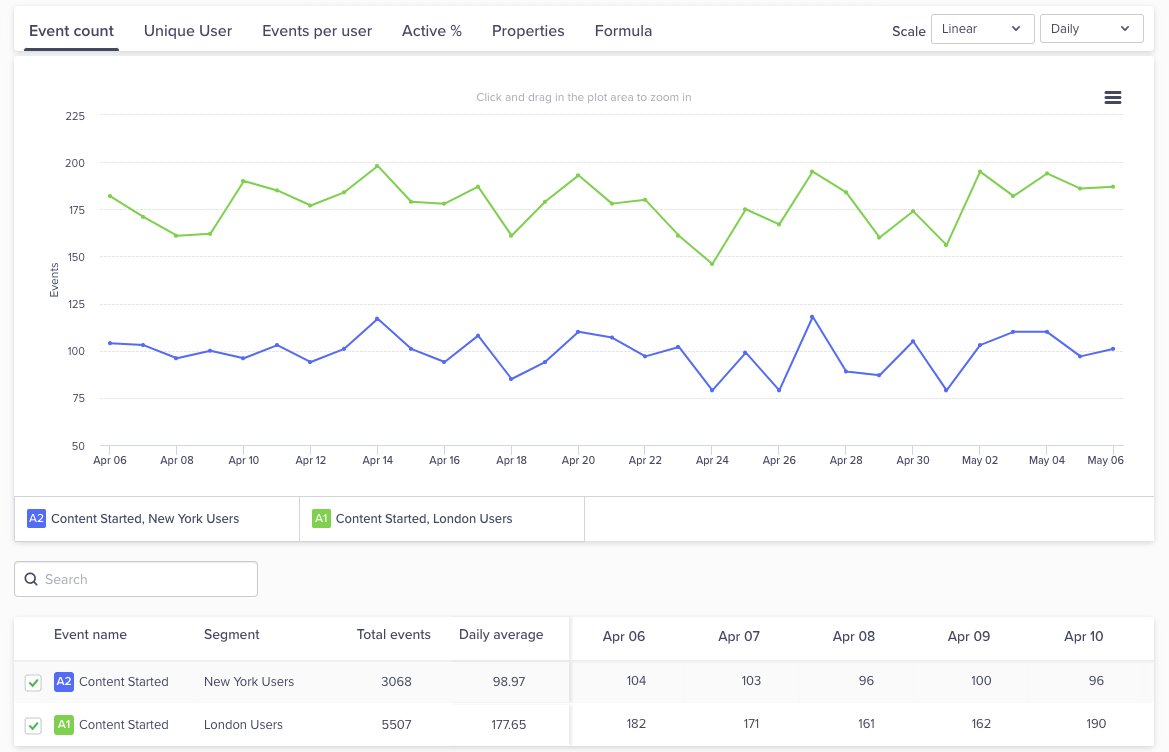
View Trend Results
Comparison Considerations
When comparing, consider the following:
- You can compare by a saved or an ad-hoc segment.
- You can compare a maximum of five segments.
- You cannot simultaneously split the trend by user property and compare the trend by segments.
Read the Trend
The trend has various tabs and statistics that provide the ability to read treads.
To read a trend, perform the following steps:
- Navigate to Analytics > Trends.
- Select an event to analyze and view a trend.
- Click View trend.
The trend appears with the stats at the bottom.
Scale
You can select the scale from the list on the top right of a trend. The trend is scaled in two ways:
- Linear: The data is scaled with an absolute count.
- Relative: The data is scaled with relative percentages.
Frequency
You can change the frequency of the trend on an hourly, daily, weekly, or monthly basis:
- Hourly: The trend is plotted on an hourly basis. The subsequent table also shows data points on an hourly basis. Hourly trends are only available when the date range selected is less than 30 days.
- Daily: The trend is plotted on a daily basis. The subsequent table also shows data points on a daily basis.
- Weekly: The trend is plotted on a weekly basis. The subsequent table also shows data points on a weekly basis.
- Monthly: The trend is plotted on a monthly basis. The subsequent table also shows data points on a monthly basis.
Event Count
This tab displays the trend for the count of events. For example, the number of Content Started events that occurred in the selected period.
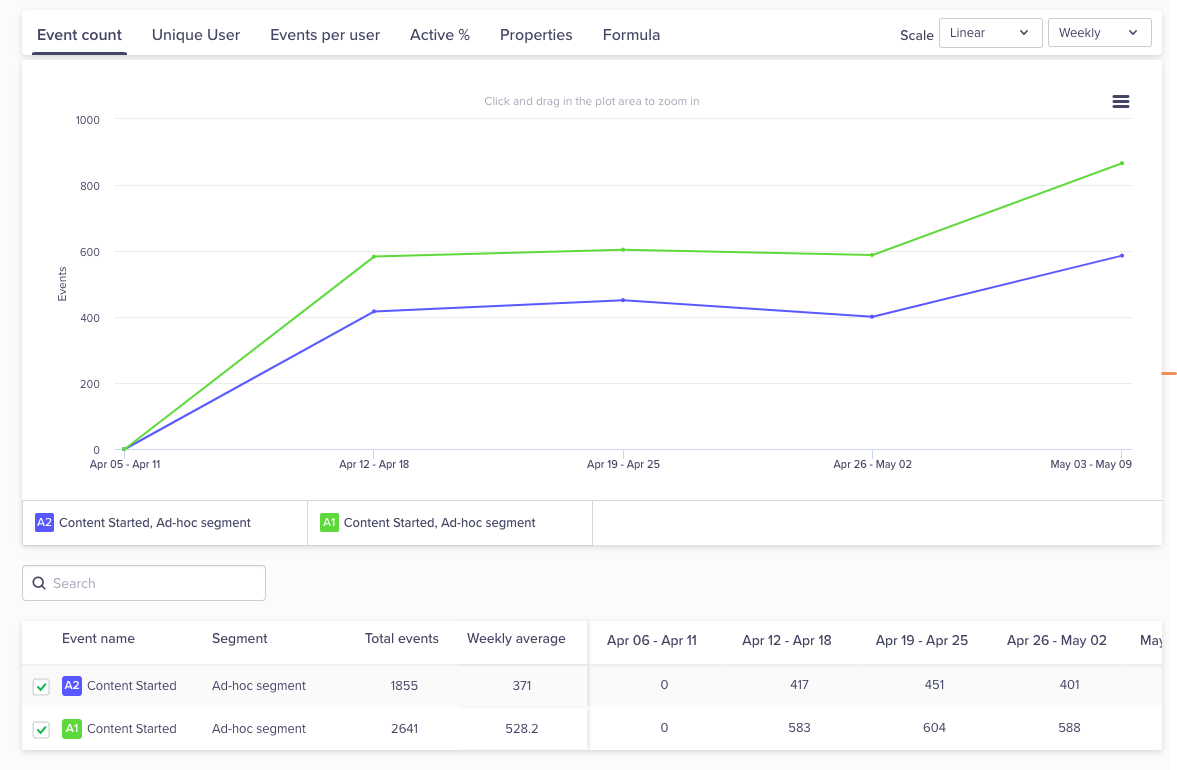
Trend Event Count
The stats available on this tab are:
- Total events: Sum of events in the selected period.
- Daily average: Total events/number of days in the selected period.
Unique User
This tab displays the trend for the number of unique users who performed the chosen events in the selected period.
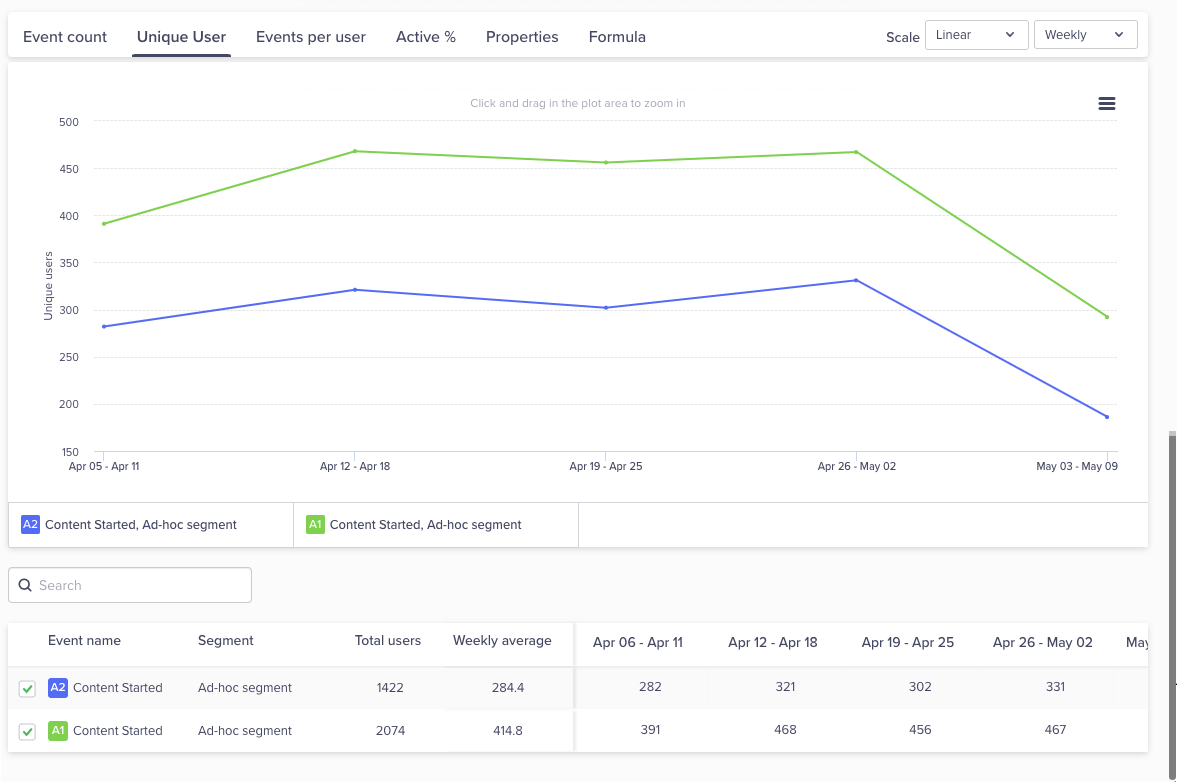
Trend Unique Users
The stats available on this tab are:
- Total users: The total number of users who performed selected events throughout the specified period. If a user performs events multiple times, each occurrence is accounted for separately in the total count. For example, if user A performs an event on Week 1, user B performs the event on Week 1, and again on Week 2, the Total users count will be cumulative, showing 3 for those two weeks combined.
- Average: The average number of users per the selected frequency (e.g., Daily, Weekly). The average is calculated as:
(Sum of users in selected frequency) / (Total number of occurrences in the specified frequency)
For example, the selected frequency is Weekly, and the selected event count is 100, 80, and 90 times on Week 1, Week 2, and Week 3, respectively. In this case, the Weekly average will be calculated as: {(100 + 80 + 90/3)}.
Events per User
This tab displays the trend for the number of events per user in the time period.
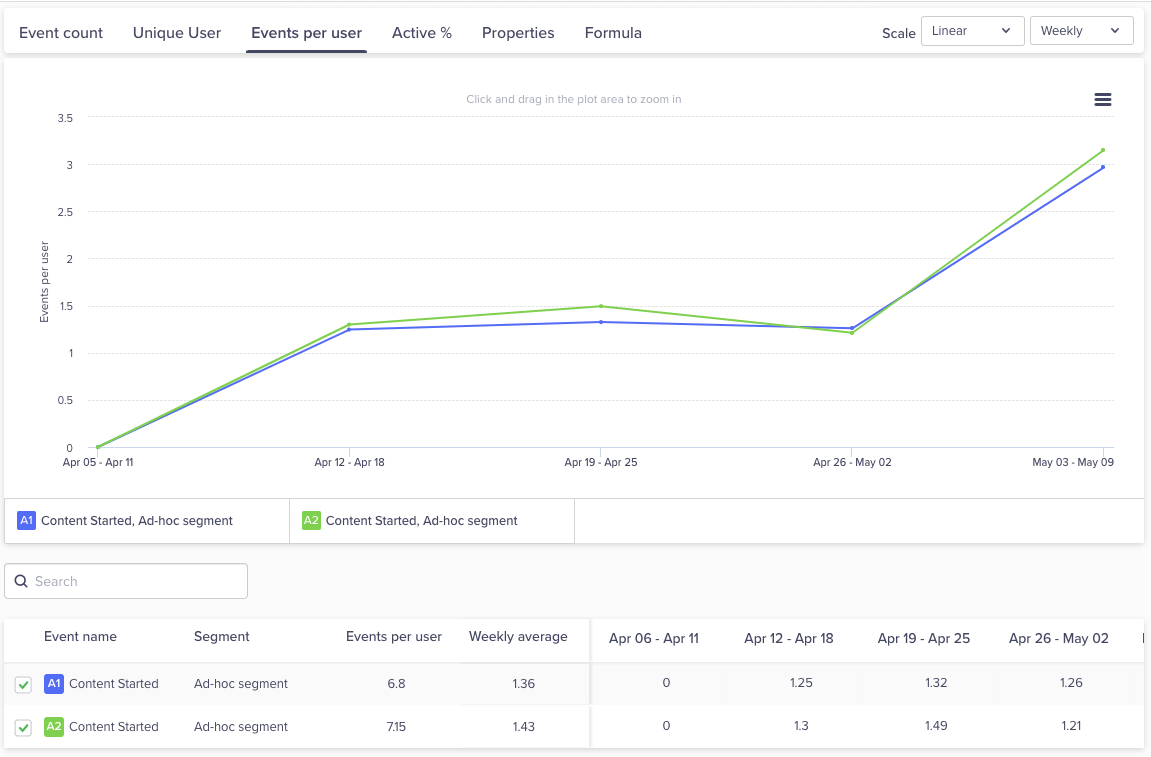
Trend Events per User
The stats available on this tab are:
- Events per user: Sum of total events/number of unique users in the period.
- Daily average: Sum of daily events per user/number of days in the period.
Ignored Split
If the trend analysis is split by an event or user property, then this split is ignored on this tab.
Active %
This tab displays the trend for the count of the users who have performed the selected event as a proportion of the active users.
For example, if you have 100 users who launched your app, these are your active users; however, you want to find out the percentage of active users who actually made a purchase. If a total of 40 users made a purchase, this means that 40% of your active users made an actual purchase.
Set the Qualifying Event
You can set the qualifying event with the following steps:
- Navigate to Settings > Schema > Events > Qualifying event.
- Select a qualifying event.
- Click Save.
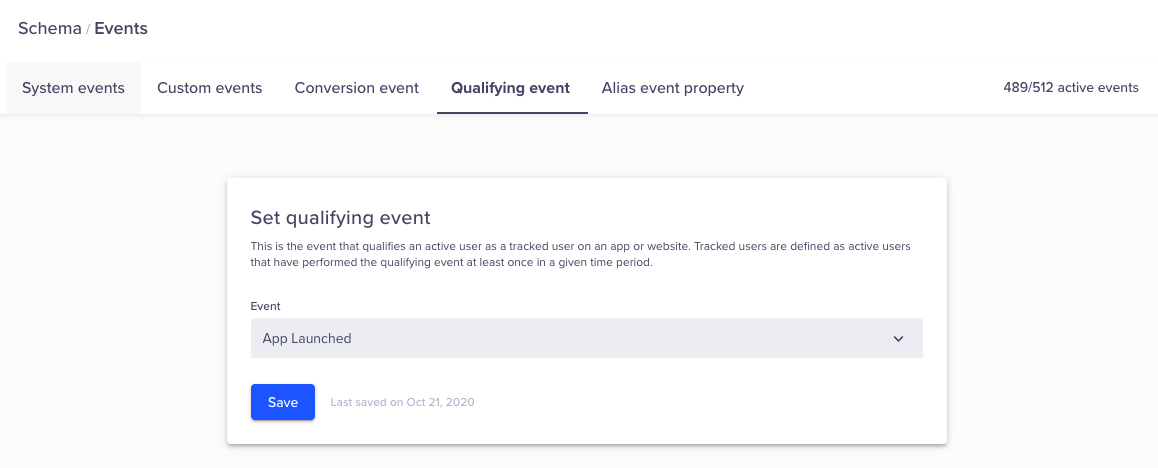
Set Qualifying Event
View Trend and Stats
To view the trend results on the Trends page, refer to View a Trend.
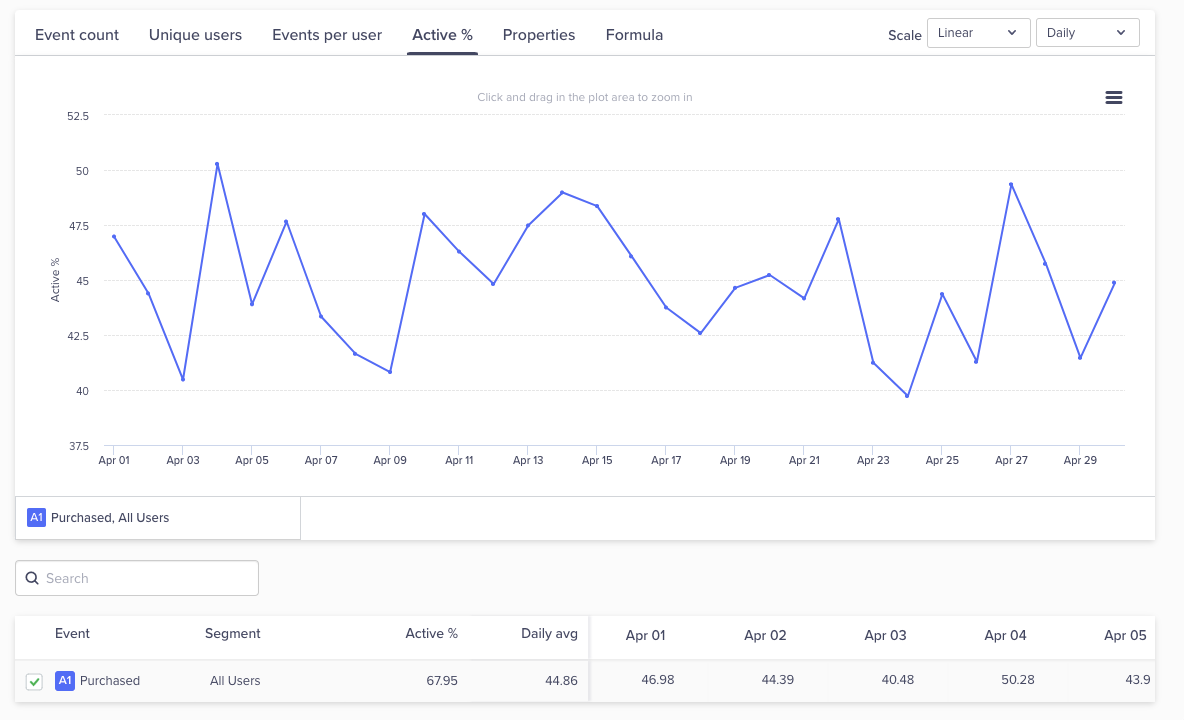
View Trend and Stats
The summary stats available on this tab are:
- Active %: Unique users who performed the chosen event/total unique active users in the whole period.
- Daily avg: Unique users/total unique active users calculated per day and averaged over the period.
Properties
You can summarize the trend by an event property. This is available in the Property tab. For example, consider the trend for the event Content Started. It has a property called duration that stores the duration of the content watched. You can view the trend by Sum of property value or Average of property value.
Sum of Property Value
This trend displays the sum of the value of the property.
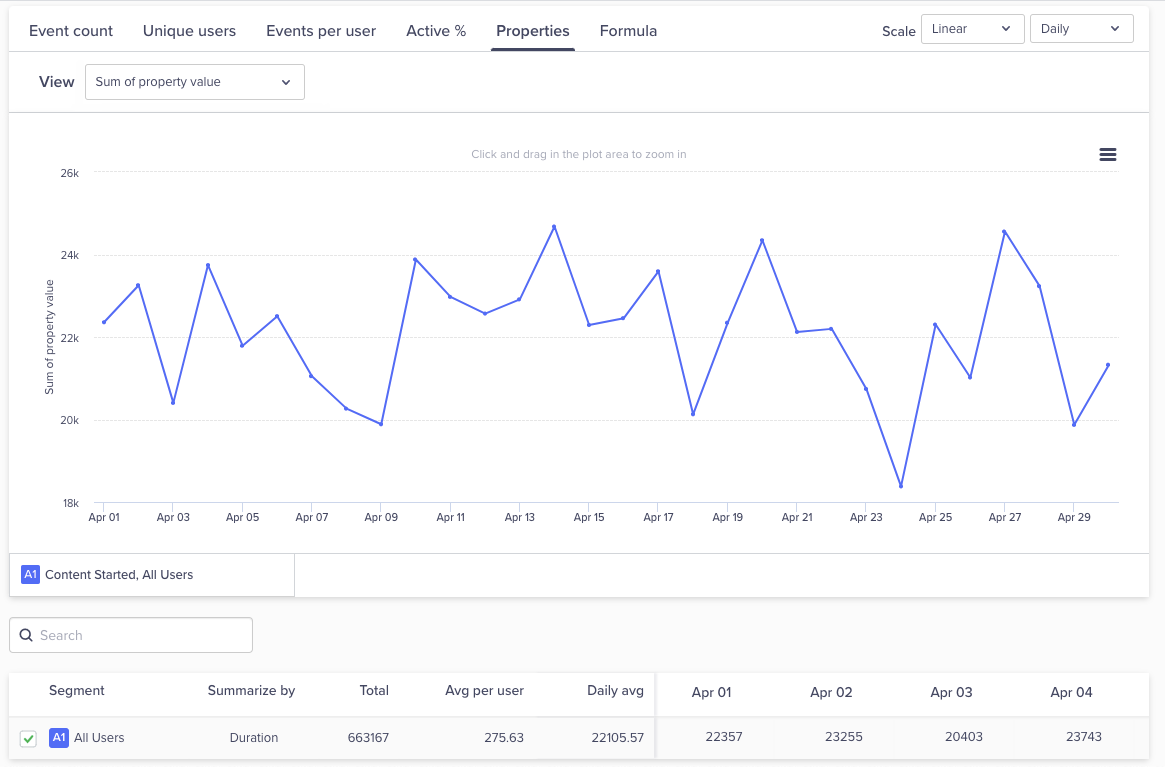
View Trend for Sum of Property Value
The summary stats available on this tab are:
- Total: Sum of property in the period.
- Avg per user: Sum of property/number. of unique users in the period.
- Daily avg: Sum of property/number of days in the period.
Average of Property Value
This trend displays the average of the property value.
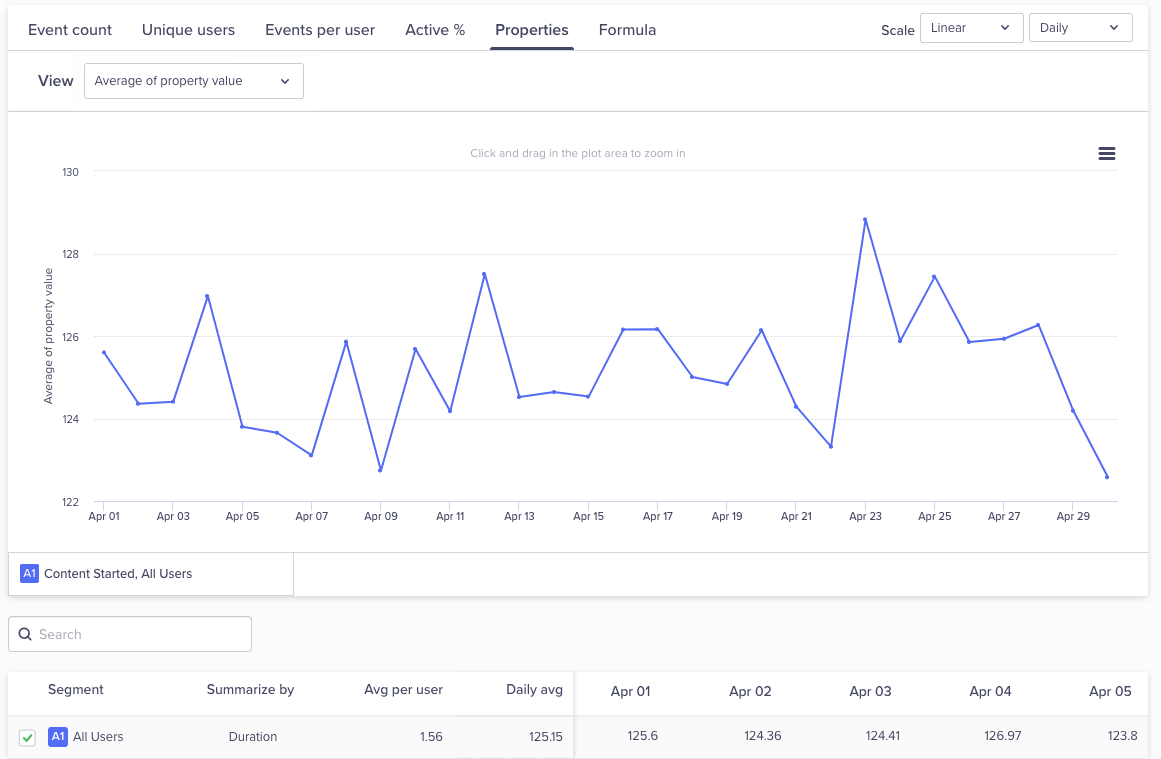
View Trend for Average of Property Value
The summary stats available on this tab are:
- Avg per user: Sum of property/number of unique users in the period.
- Daily avg: Sum of property/number of events calculated per day and averaged over the period.
Custom Formula
Custom formulas provide the ability to track metrics that are unique to your business. You can create these custom formulas using our event or property level functions. For example, you want to find out the popularity of a movie genre, such as Action. You can analyze the trend for this genre using a ratio of the watched time for action movies (A) to the watched time for all movies (B). The ratio A/B gives you the popularity of action movies compared to all movies and its trend.
You can also use formulas to track metrics that are a part of other tabs on the trends graph simultaneously. For example, you can view event count and unique users simultaneously on the same graph.
Create Formula
To create a formula, perform the following steps:
- From the CleverTap dashboard, navigate to Analytics > Trends.
- Select the event to analyze and view a trend. For example, select watched time for action movies (people who watched 10 hours).
- Select another event that denotes watched time for all movies (people who watched 10 hours).
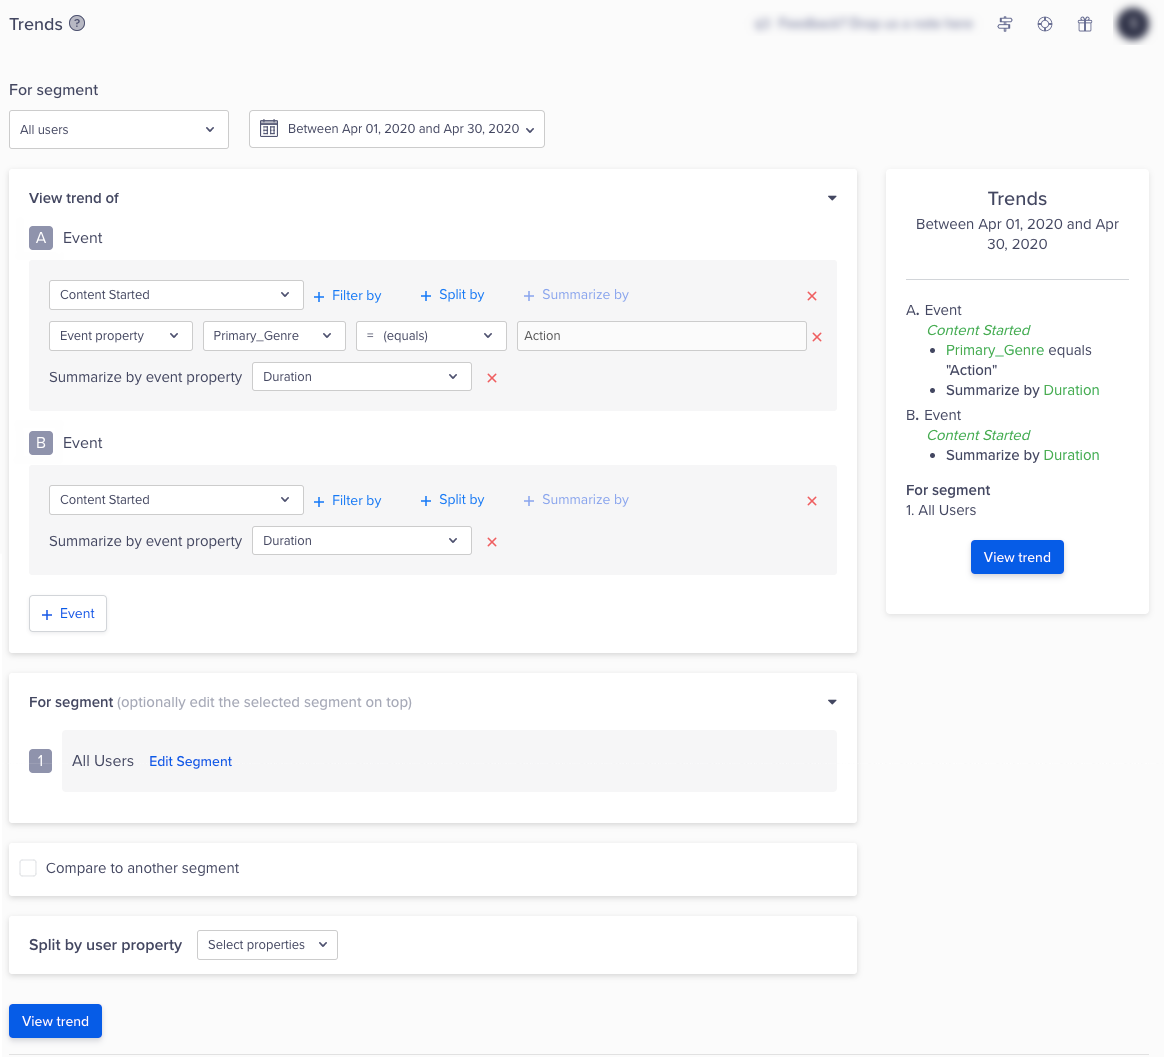
Create Custom Formula
- Click View trend. The trend displays.
- Click the Formula tab.
- Enter the formula. In our example, the property sum of Event A/Event B.
- Click Apply to view the results. The results display the popularity of action movies over the selected time period.
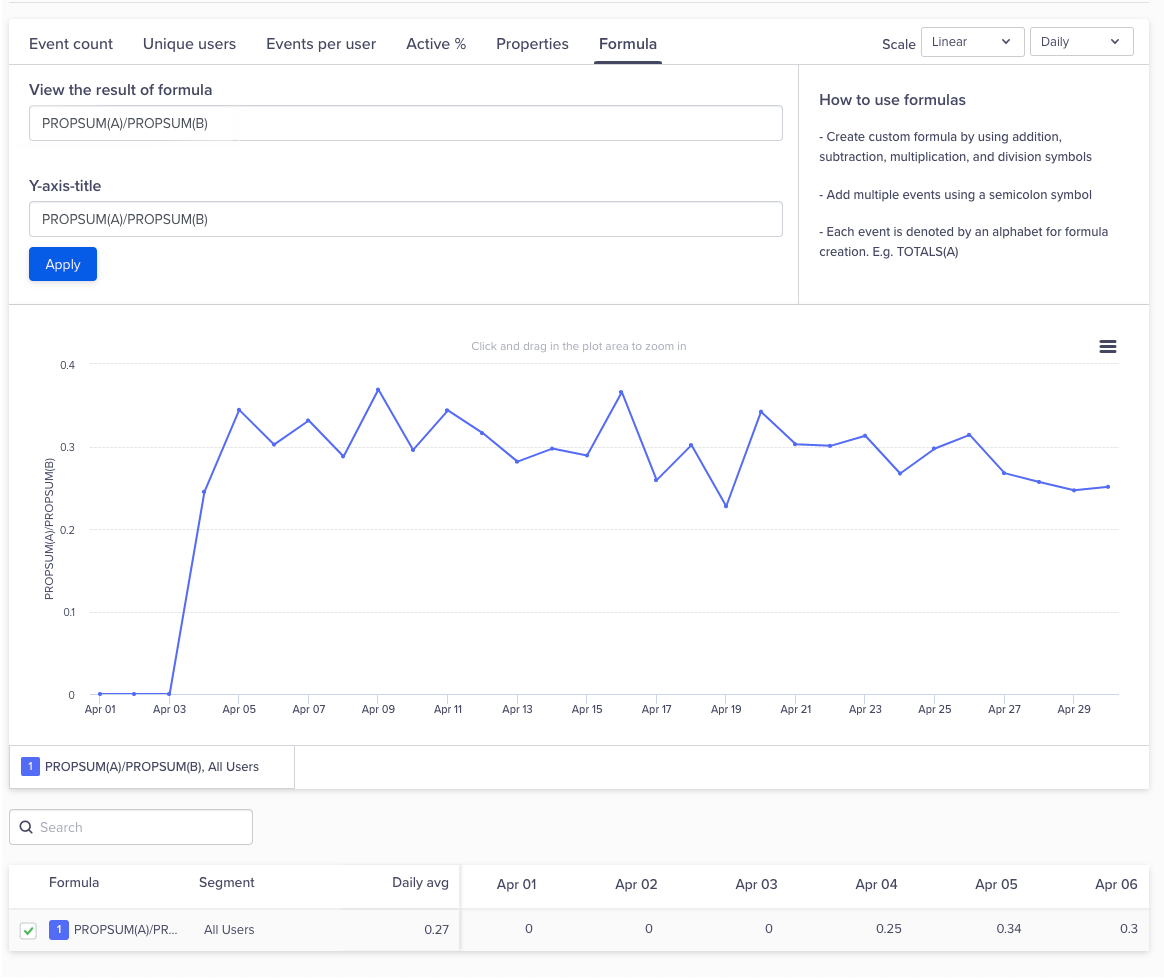
Apply Custom Formula
Compare up to Four Formulas
You can compare up to four formulas together on the same chart by adding a “;” between the formulas.
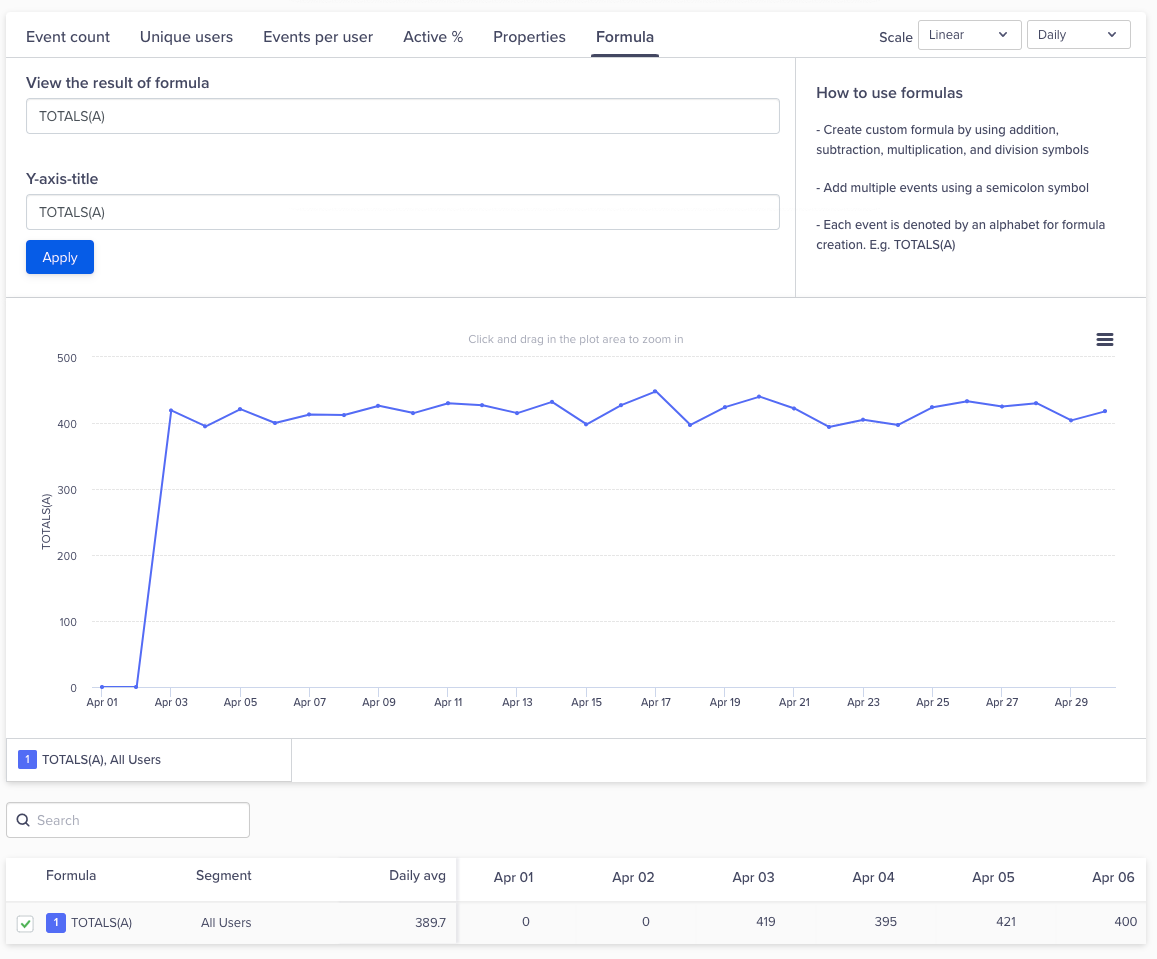
View Trend Result Formula
Event Level Functions
Use any of the following functions for your analysis:
- TOTALS: Count of selected event performed.
- UNIQUES: Unique number of users who performed the selected event.
- AVERAGE: Average number of events performed per unique users. This can also be created using TOTALS/UNIQUES.
- ACTIVE: Proportion of users who did the selected event/users who did the active event. To set the qualifying event, refer to Set the Qualifying Event.
Always Uppercase
A function must always be uppercase such as TOTALS instead of Totals.
Property Level Functions
Use any of the following functions for your analysis:
- PROPSUM: Total value of the selected event property for all the events performed.
- PROPAVG: Average value of the selected event property per occurrence of the event. This can also be created using PROPSUM/TOTALS.
Always Uppercase
A function must always have uppercase such as PROPSUM instead of PropSum. An event must be summarized by event property for a property level function.
Operators
You can use the following operators to combine the functions into custom formulas that are relevant to your business: (), /, *, +, and -.
Formula Comparison
You can compare up to four formulas together on the same chart by adding a semicolon “;” between the formulas. For example, to see the trend for the number of content consumed and the unique users who consumed the content, you can compare the formulas, such as TOTALS and UNIQUES for the same event such as, Content Started.
Select and analyze events.
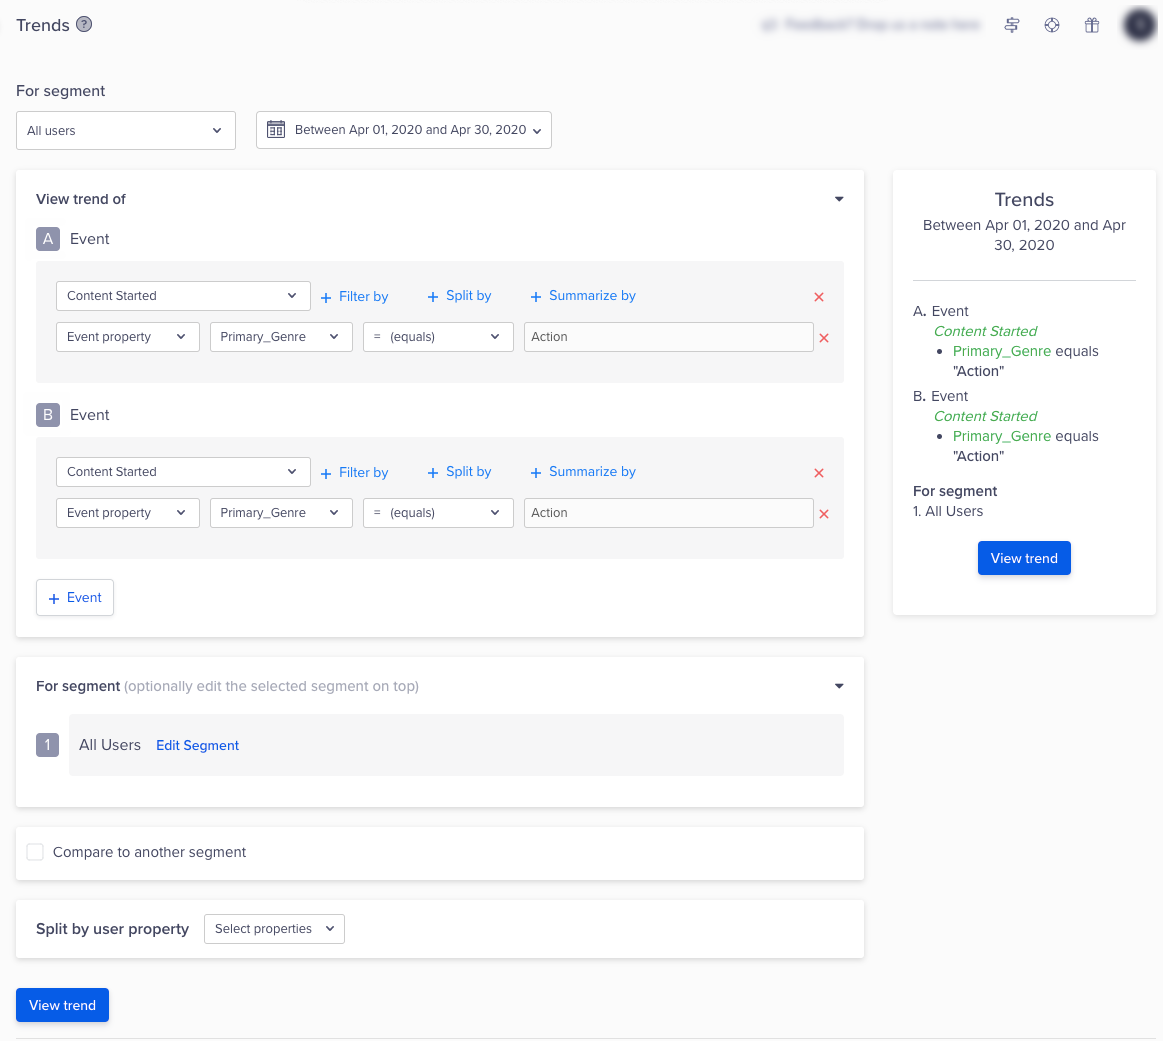
Compare Formula
Add up to four formulas separated by a semicolon ";".
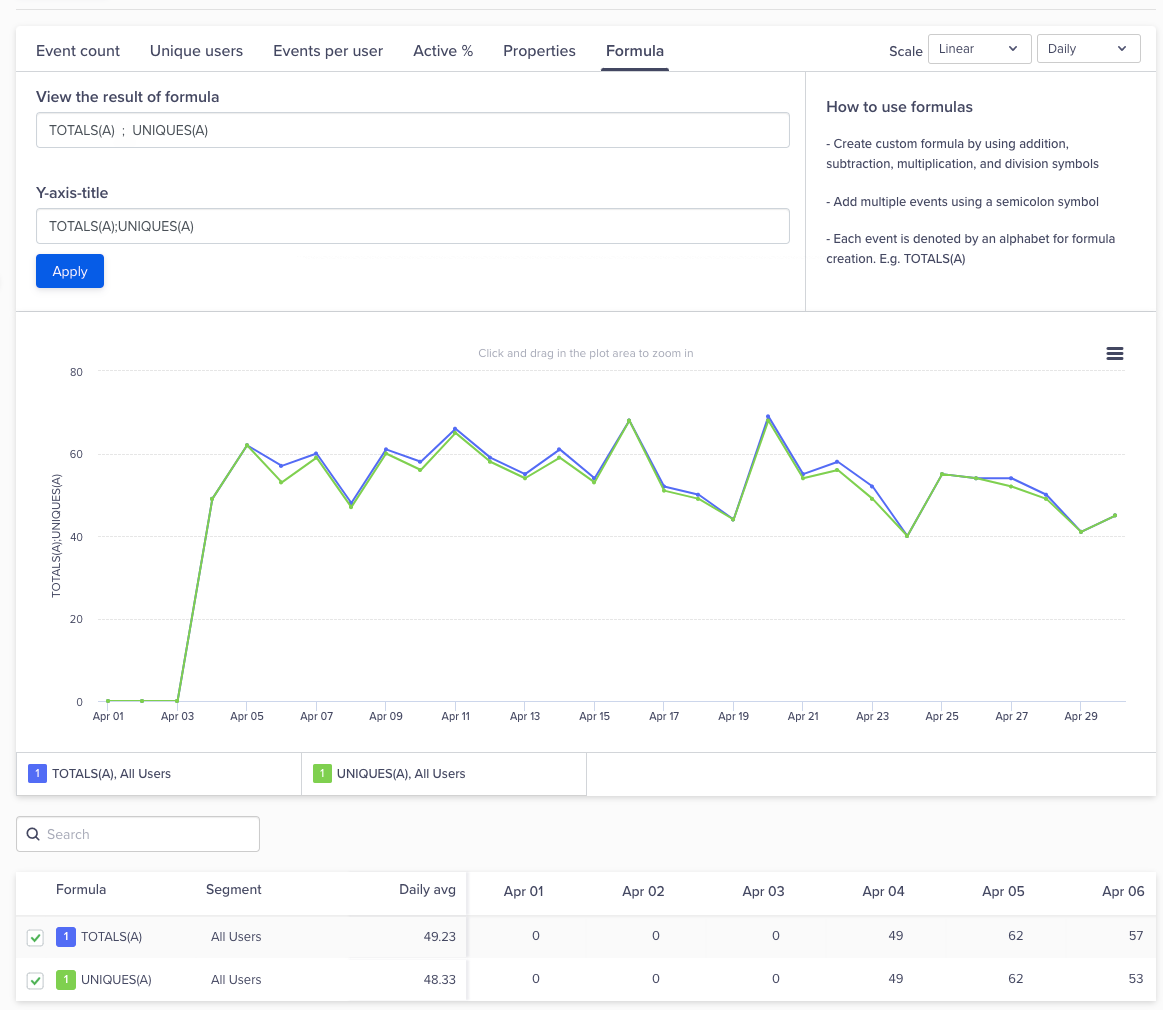
Add Formula
Updated 6 months ago
